


Introduction
Snow is an important hydrological parameter in the Northern Hemisphere, and quantifying the snow reservoir is necessary for water resources assessment and for mitigating the potential hazard of the spring flood. In order to successfully simulate the temporal evolution of the snow reservoir, snowmelt and the snow-covered area (SCA), the spatial probability density function (PDF) of snow water equivalent (SWE) plays a key role (Reference Buttle and McDonnellButtle and McDonnell, 1987; Reference ListonListon, 1999; Reference Luce, Tarboton and CooleyLuce and others, 1999; Reference Essery and PomeroyEssery and Pomeroy, 2004; Reference Luce and TarbotonLuce and Tarboton, 2004). Furthermore, the spatial PDF of SWE is known to vary throughout the snow season. This was observed by Reference Pomeroy, Essery and TothPomeroy and others (2004) during the melt period and through the entire snow season by Reference Alfnes, Andreassen, Engeset, Skaugen and UdnæsAlfnes and others (2004). The algorithms used to describe the spatial PDF of SWE in hydrological models thus have to take this feature into account.
The spatial PDF of SWE often serves as the basis for modelling SCA. The temporal development of SCA is important in hydrology and in land surface schemes in atmospheric models. The dynamics of runoff is affected by changes of the area generating meltwater, and flux accounting must be carried out separately for snow-free and snow-covered fractions of a grid in a land-surface scheme (Reference ListonListon, 1999; Reference Essery and PomeroyEssery and Pomeroy, 2004). The snow-cover depletion curve (SDC) can be derived from the spatial PDF of SWE and describes the relationship between SCA and spatially averaged SWE (Reference Martinec, Rango and RobertsMartinec and others, 1994; Reference Luce, Tarboton and CooleyLuce and others 1999; Reference Luce and TarbotonLuce and Tarboton, 2004). Reference Luce, Tarboton and CooleyLuce and others (1999) derived the SDC from integrating a generic PDF of SWE which shifts to the left as melting proceeds. Reference Essery and PomeroyEssery and Pomeroy (2004) assumed a log-normal distribution of SWE when they showed how the sign of the correlation between melt and SWE influences the SDC. Reference Shamir and GeorgakakosShamir and Georgakakos (2007) discussed the high interannual variability in SDC for single catchments, which translates to interannual variability in spatial PDF of SWE.
A highly relevant parameter that has to be taken into account when modelling snowmelt and the evolution of snow-free areas is the correlation between SWE and melt. Reference Essery and PomeroyEssery and Pomeroy (2004) show that, given a PDF for SWE, the relation between changes in SCA and mean SWE (i.e. the SDC) varies according to the sign and magnitude of the correlation between melt and SWE. There has been some debate in the literature regarding the nature of this correlation, and Reference Faria, Pomeroy and EsseryFaria and others (2000) found that the spatial distribution of daily melt was negatively correlated to the distribution of SWE within a boreal forest stand. Reference Pomeroy, Essery and TothPomeroy and others (2004), however, found no spatial covariance between melt energy and SWE in dense mature spruce forest, although this does not directly describe the correlation between melt rate and SWE. Furthermore, Reference Pomeroy, Essery and TothPomeroy and others (2004) found negative correlation at small scales (<100m) and medium scales (<2000 m), and even positive correlations at the catchment scale (<200 km). In addition to these non-conclusive findings, both Reference Pomeroy, Essery and TothPomeroy and others (2004) and Reference SkaugenSkaugen (2007) reported that the relationship between spatial mean and variance of SWE is not monotonous throughout the accumulation and melting season. At the very beginning of the melting season the spatial mean decreased, whereas the variance increased slightly and later declined with the mean. This behaviour is also seen in studies in the Swiss Alps, where the spatial mean of SWE plotted against the spatial standard deviation shows that their relation is not monotonous (Reference Egli and JonasEgli and Jonas, 2009; Reference Egli, Griessinger and JonasEgli and others, 2011). In the Swiss studies, this phenomenon is called hysteresis, suggesting that predicting the variance requires the history of the mean and not just the mean.
In Reference SkaugenSkaugen (2007) a method for estimating a temporally varying spatial PDF of SWE was introduced. This distribution can reproduce the observed variability in shape of the PDF caused by accumulation and melting events. The spatial distribution of SWE presented in Reference SkaugenSkaugen (2007) could, however, be applied only to snow-covered areas, and did not take into account the development of snow-free areas in a catchment. In order to take the method a step further and make it suitable for implementation in a hydrological model, changes in SCA are derived from the spatial PDF of SWE and the intensity of the melting event.
Correlation between snowfall events and also between accumulated SWE and melt plays a crucial role in the proposed method for estimating the spatial PDF of SWE. In our study we discuss how the correlation between melt and SWE and the hysteresis effect may be linked.
In this study we compare estimates of spatial moments of SWE (mean and standard deviation) and SCA, modelled with the snow distribution routine of the HBV model and the model developed in this paper, against observed values. The main objective is to present a method for estimating the spatial PDF of SWE at the catchment scale while taking changes in SCA into account. The proposed method is parameterized solely from observed precipitation data and does not introduce any parameters to be calibrated.
The next section presents the methods used to estimate the spatial moments of SWE. The method builds on the results presented in Reference SkaugenSkaugen (2007), and spatial SWE is hence modelled as a two-parameter gamma distribution. Furthermore, the challenge of estimating the spatial moments of SWE after both accumulation- and melting events is treated separately and special emphasis is placed on how changes in SCA affect the moments.
Method
Unit fields
In Reference SkaugenSkaugen (2007), the PDF of accumulated SWE was approximated as a correlated sum of gamma-distributed unit fields, y(x), where × represents space. For the remainder of this paper the unit y(x) is denoted y The unit fields of snowfall are distributed in space according to a two-parameter gamma distribution, y = G(V 0, α0), with PDF

where α0 and ν 0 are scale and shape parameters respectively. The mean of the unit equals E(y) = ν 0 /α 0, and the variance equals Var(y) = ν 0 /α 0 2. The choice of distribution is motivated from studies reporting the gamma distribution as a suitable choice for the spatial distribution of precipitation (Reference Onof, Mackay, Oh and WeatherOnof and others, 1998; Reference Mackay, Chandler, Onof and WheaterMackay and others, 2001), SWE (Reference Kuchment and GelfanKutchment and Gelfan, 1996; Reference SkaugenSkaugen, 2007) and snow depth (Reference Egli, Griessinger and JonasEgli and others 2011). Reference SkaugenSkaugen (2007) found that the gamma distribution was in good agreement with the observed spatial distributions of SWE. It can also be noted that the presented method applies to the catchment scale, where the variability of precipitation influences the variability of snow depth (Reference ListonListon, 2004). The values for ν0 and α0 can be estimated from the observed spatial mean and standard deviation sampled from precipitation events. From analysis of 19year long time series of precipitation from various areas in Norway, the spatial mean, m, and standard deviation, s, of precipitation were found to follow a functional relationship of the type s = am (Reference Skaugen and AndersenSkaugen and Andersen, 2010), where a and h are determined using nonlinear regression. Once a suitable choice of the mean of the unit is chosen, the corresponding spatial standard deviation, s, can be estimated from s = amh and ν0 and α0 can be determined using Eqn (2) below.
During the snow season, the snowpack may experience a series of melting and accumulation events. These two processes have different spatial frequency distributions and are differently correlated in space. Estimating the spatial variance of SWE after a series of alternating melt and accumulation events is thus a challenge and must include the covariance between the units. Furthermore, SCA varies throughout the season, which necessarily gives a non-homogeneous spatial field of SWE. In this study, SCA is set equal to 1 (full coverage) for every snowfall event, whereas a melting event implies a reduction in coverage.
The procedure for estimating the spatial PDF of SWE is to estimate the spatial conditional mean, E(z’(t)), and variance, Var(z’(t)), of accumulated SWE, z’(t), as functions of the units, y and weighted by changes in SCA. The spatial PDF of SWE is subsequently modelled as a gamma distribution with parameters

The distribution of z ’ does not contain zeros and is hereafter called conditional (i.e. conditional on snow). For the non-conditional PDF of SWE, which also includes zeros, the variable SWE is denoted z.
Moments and parameters of the gamma distribution of an individual snowfall event
We start the procedure for determining the spatial moments of SWE by investigating a simple case, namely a single snowfall event. According to Reference SkaugenSkaugen (2007), the spatial mean of a snowfall event that comprises n units,
 , can be written as

and the variance as

Note that we have n(n–1) covariance elements since the trace of the covariance matrix consists of the variance for each individual y We estimate the covariance between the units as the average covariance over the n(n–1) pairs of units, and equal to a fraction c(n) of the variance of the individual
 . This is a departure from Reference SkaugenSkaugen (2007) where c is a tuned, non-dynamic value and not a function of the number of units n. The variance of z’(t) is thus

Since c (n) is the ratio between covariance and variance, it is the average correlation for the n (n–1) pairs of units and equal to

The estimation for a single event of n units is carried out using Eqns (3) and (5). With an estimate of the spatial variance from the relationship s = amh we can also estimate the correlation coefficient in Eqn (6).
The average correlation c(n) is a declining function of n, which corresponds with the results of Reference ZawadzkiZawadski (1973) who found that the temporal correlation of precipitation is a rapidly declining function of time. To estimate the conditional moments from individual snowfall events, we have no apparent use for the estimate of the covariance between the units. The following subsections show, however, how sequences of melting and accumulation events, together with changes in SCA, complicate the estimate of the spatial moments of SWE.
Accumulation events on a previous snow reservoir
Let the snow reservoir, consisting of n units, be increased by a new snowfall of u units. Our task is to estimate the moments of the new spatial PDF of SWE. The snow coverage prior to the snowfall event is denoted SCA t _1 whereas the SCA after the event is set equal to full coverage, SCA t = 1. We determine the mean and the variance for the previously covered part SCA t _1 and newly covered part (1 — SCA t _1) separately. The moments for these two areas are assumed independent and the moments for the new totally covered area are estimated as

and

Hence, the task is to estimate the mean and variance for the two areas SCAt−1 and 1 − SCAt−1, i.e.
 and

The mean
The mean is simply estimated as the sum of the units times the unit mean. For the two areas, the mean is
 and
 respectively. The mean for the new totally covered area is thus

The variance
For the newly covered area, 1 –SCA t _1, the variance is estimated using Eqn (5) as

Estimating the variance for the previously covered area, we need to consider the covariance matrix. The matrix is at all times symmetric, and we can view the additional snowfall as an extension of the elements of the matrix, so that after a snowfall event of u units the original n × n matrix becomes a matrix of (n + u) × (n + u) elements. We proceed to estimate the four parts of the matrix separately, Var
n
xn
, 2Cov
n
xu
and Var
u
xu
(Fig. 1), and finally estimate
 as the sum of these parts.
Covariance matrix for n + u units. Since the matrix is symmetrical, Covnxu and Covuxn are equal.

The variance of the previous n events, Var
n
xn
, is expressed by the updated parameters (Eqn (2)) of the gamma distribution at time t—1 and equal to
 . This variance may differ from that obtained by Eqn (5), using n, because there may be a history of accumulation and melting events which prevents Var
n
xn
from being a straight forward function of n, as is the case in Eqn (5). The sum of the elements in the covariance matrix for Cov
n
xu
(and Cov
u
xn
) is
 and the sum for Var
u
xu
is
 . The correlation coefficient, c
acc, is estimated as if the total variance Var[z’(t)]SCA and Var
n
xn
were estimated using Eqn (5) with u+ n and n elements respectively. This is an approximation since we do not know if Var
n
xn
is estimated by Eqn (5) or may be the result of previous accumulation and melting events as discussed above. The equation

is then solved for c acc. The correlation coefficient c acc is thus estimated as

which gives

and finally

As the four parts of the covariance matrix describing the variance of the previously covered area are now estimated, we can write Var[z’(t)]SCA as

and, finally, the spatial variance of the total snow-covered area, SCAt, as:

Melting events
Let the snow reservoir, consisting of n units, be reduced by u units after a melting event. The snow coverage before and after the melting event is SCA t _1 and SCA t respectively, where SCA t < SCA t _1. We set SCA t _1 as 1, so that SCA t is the relative reduction in snow coverage due to melting, and not the catchment value. The reduction in snow coverage poses a problem in that we have to separate between non-conditional (the area includes a fraction of zero values) and conditional moments. We thus have to determine the spatial moments for the area of the new coverage SCA t (conditional moments) and for the area which includes the previously covered part, SCA t _1 (non-conditional moments).
The mean
The non-conditional mean after the melting event is estimated as
 and the conditional mean is

We note that the difference in conditional means before and after the melting event is

where u′ is the conditional number of melted units.
The variance
When assessing the conditional variance after the melting event, the melting event is seen as an extension of the elements of the covariance matrix, similarly to accumulation events. The original n × n matrix becomes, after melting u′ units, a matrix of (n + u’) × (n + u’) elements. We proceed, as in the case of accumulation, to estimate the four parts of the matrix separately (Var n xn , 2Cov u′ ×n and Var u ×u′ ; see Fig. 1 and substitute u with u) and finally estimate Var[z’(t)]SCA as the sum

The only possible negative contribution in Eqn (10) is Cov u xn , since both Var n × n and Var u ′Xu ′ are by definition positive. Negative covariance implies that melting is negatively correlated with SWE, i.e. melting is more intense from areas with less SWE.
The variance of the n events prior to the melting, Var
n
xn
, is expressed by the updated parameters of the gamma distribution (Eqn (2)) at time t — 1 and equal to
 .
The negative covariance contribution Cov n xu ′ (or Covu’xn) between melt and SWE is estimated as

The nature of the correlation c mlt is unknown, but we can estimate the limiting values for no melt (u′ = 0) and complete melt (u′ = n). When (u′ = 0), the covariance is obviously zero, but for the latter case the total variance becomes zero and we can estimate c mlt from Eqn (10), Var n ×n + Var u ×u ′ = 2Cov u′xn, which gives

and

For specific values of u′ (u’ ≤ n), we approximate c mlt(u’) as a linearly increasing function of u′:

The variance of the melting events is estimated using Eqn (5):

Finally, the total variance of the new conditional distribution after a melting event is computed as

Estimating changes in snow-covered area (SCA)
Recall that after a snowfall event, SCA for the area of interest is set equal to 1 (the same procedure as applied in the HBV model). After a melt event, however, the estimation of changes in SCA is somewhat more elaborate. In Reference DingmanDingman (1994) the energy requirements for transforming a snowpack into meltwater are stated as Q = Q1 + Q2 + Q 3 where the different energy quantities refer to warming the snowpack to a uniform temperature of 0°C (Q1), producing a certain fraction of meltwater contained in the snowpack (Q 2) and transforming the snow into meltwater (Q3):

where hm is SWE, h wret is free water stored in the snowpack (usually a fixed percentage of SWE in hydrological models), ci is the heat capacity of ice, pw is the density of water, T s and Tm are snowpack and melting point temperatures, respectively, and λf is the latent heat of fusion. All the energy quantities are linear functions of the depth, h, of SWE, so an assumption that areas with the least SWE are the first to become snow-free due to smaller energy requirements appears reasonable. This assumption is used to estimate the reduction in SCA after a melting event. Previous sections propose a gamma distribution, fa, with parameters ν and a as a model for the PDF of SWE,

We also assume that the spatial frequency of melt has a gamma distribution, fs. Various studies suggest gamma- or log-normal distribution for melting (Reference Essery and PomeroyEssery and Pomeroy 2004; Reference SkaugenSkaugen, 2007), but a uniform distribution has also been used (Reference ListonListon, 1999; Reference Egli and JonasEgli and Jonas, 2009). It is further assumed that the parameters of fs follow the same principles as for accumulation, i.e. that the moments can be estimated using Eqns (3) and (5) with u′ replacing n. At all times u′ ≤ n, which implies that until the final melting event occurs, fs is more skewed to the left than fa.
Based on the above, and also on the theoretically established negative correlation between melt and SWE, we state that all points with SWE values less than some value X will be left snow-free. This gives us a reduction in the spatial extent of SCA equal to
 . We furthermore argue that the value of X is the value where the frequencies of the melt distribution, fs, are equal to the frequencies of the accumulation distribution, fa. This is because the areal coverage of the melt values less than
 is greater than the areal coverage of the accumulated values less than
 . In addition, since f
s is not bounded to the right, some areas with higher values of SWE than X will be left snow-free after a melting event. For example, if we consider discrete PDFs of the accumulation and melt distribution (p
a and p
s), then a fraction of the total snow-covered area will contain SWE values in the interval defined by, say, SWE=X+x. A smaller fraction of the area with values in the interval SWE = X+× will be left snow-free since p
s(X+x) is smaller than p
a(X+x). When we consider the total snow-covered area, a fraction of all the frequencies of the accumulation distribution f
a for SWE values higher than X will be left snow-free. If these frequencies are summed they will thus represent the area for SWE values higher than X that are left snow-free,
 The reduction in SCA after a melting event is thus

Recall that the reduction in SCAred is relative, i.e. it is the reduction from the previous snow cover, which is also the probability space of both f a and f s, and thus equal to 1.
Results
In this section we first show how the results of the proposed algorithms for estimating the spatial moments of SWE and SCA (hereafter called the G_model) compare with observed data and with the model used for estimating the spatial distribution of SWE in the Swedish rainfall–runoff model, HBV (Reference BergströmBergström, 1992; Reference SælthunSælthun, 1996). We then present observations of observed spatial snowmelt, which justifies the assumption of gamma-distributed snowmelt.
In the snow distribution routine in the HBV model (hereafter called the LN_model) the spatial distribution of snow is modelled as the sum of uniformly and log-normally distributed snowfall events. In the LN_model, a uniform spatial distribution of SWE is used up to a specified threshold of accumulated SWE. For additional snowfall events, each snowfall event is log-normally distributed through a calibrated coefficient of variation (CV) at a specified set of quantiles, i.e. each additional snowfall event has a spatial PDF of fixed shape (through the calibrated CV) regardless of its intensity. The spatial distribution of melt is uniform, and reduction in SCA occurs when the SWE associated with a quantile becomes zero. The reduction in SCA is thus the sum of quantiles with zero SWE. The snow routine of the HBV model does not keep track of the spatial moments of accumulated SWE, so it is not straightforward to assess the modelled spatial PDF for this model. In this study, the SWE values for the different quantiles are fitted to a log-normal distribution, and the spatial moments are derived from the parameters of the fitted distribution. The estimated quantiles were well represented by the fitted log-normal distribution.
Comparing estimated spatial mean, standard deviation and SCA with observed data
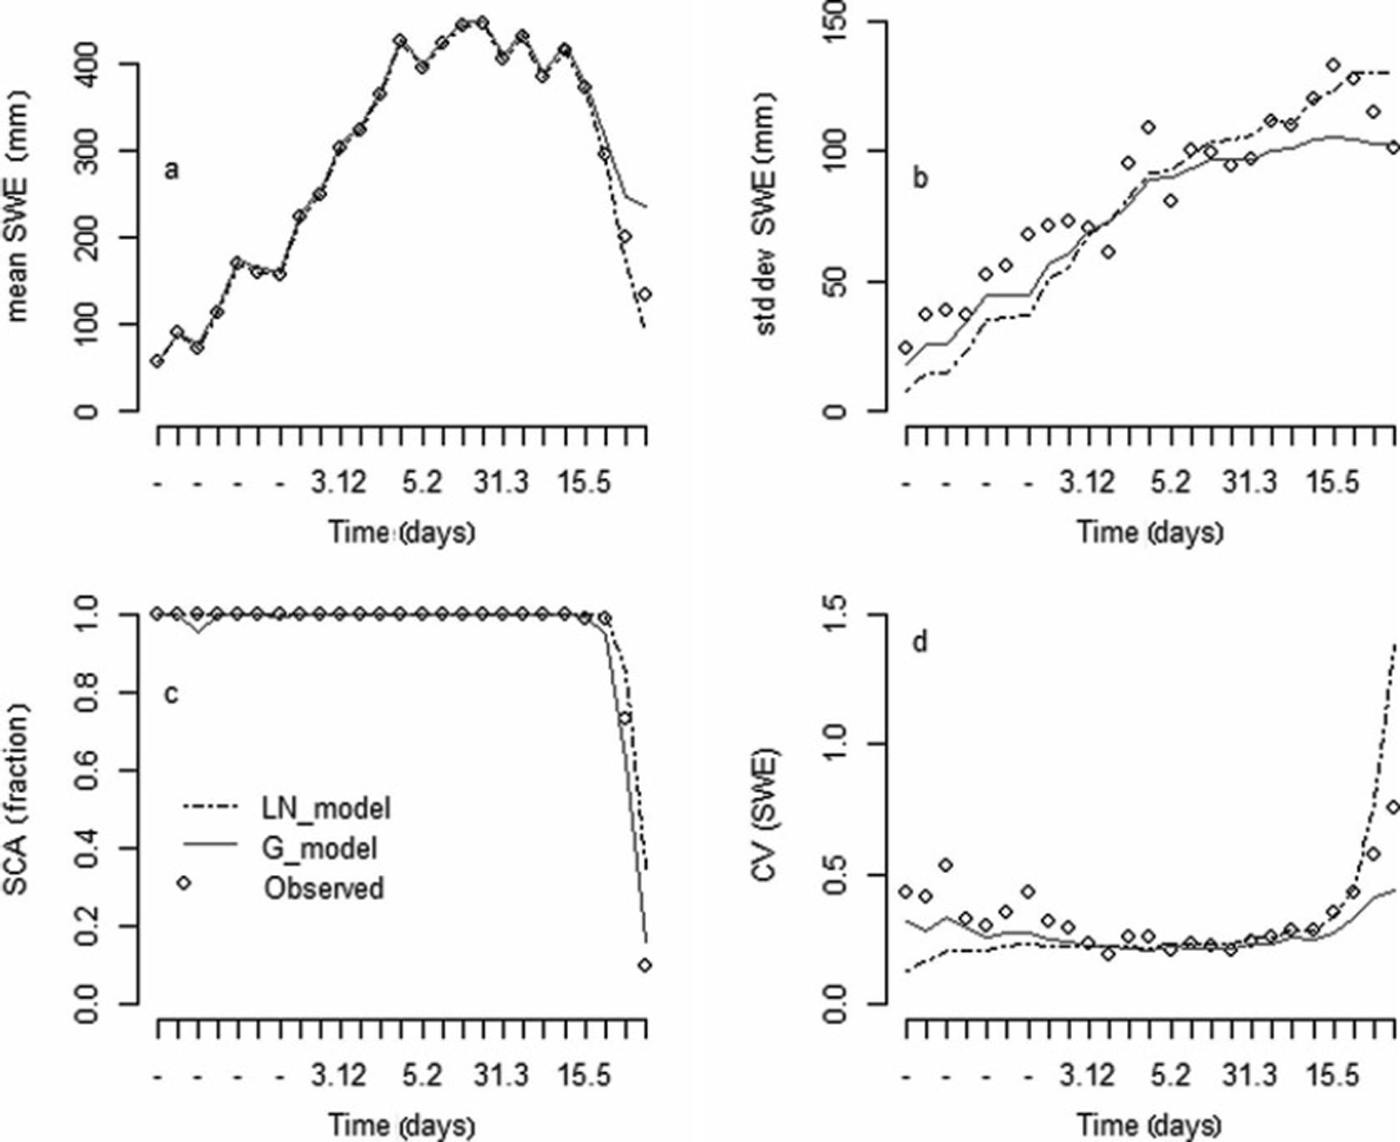
In order to assess the performance of the G_model, we need to compare the results against observed data. Two such datasets exist in Norway. The first is the dataset from Norefjell in southern Norway and was previously presented in Reference SkaugenSkaugen (2007). At Norefjell, snow surveys at 1000 m a.s.l. were carried out every second week along a 2 km long snow course during the winters 2002/03 and 2003/04. Snow depth was measured every 10 m, and density measurements were taken twice for each snow course. Average snow density was measured from two snow pits at locations with average snow depth. This provided a time series of snow course data covering an entire snow season from the start of accumulation to the end of the melting period. Twenty-five surveys were made at this site. The second dataset is from the Norwegian Water Resources and Energy Directorate (NVE) research site for snow at Filefjell, southern Norway (Reference Stranden and GrønstenStranden and Grønsten, 2011). The site is located at 1000ma.s.l., and has a stable snow cover throughout November-April. The vegetation is grass and willow thicket (<50cm). About 45 stakes are placed at a flat stretch of 450 m, ensuring that exactly the same point is measured for each sample. At the stakes snow depths and densities were usually measured once a week throughout the melting season. For each survey of snow depths, snow density was measured at every tenth stake using a snow tube (Reference DingmanDingman, 2002, p. 174). Seven surveys were made in 2011 and eight in 2012. Both sites represent areas smaller than the typical catchment scale, but assessments of SWE at catchment level are usually carried out using snow surveys of a similar spatial scale. SCA is estimated for the sites by counting the zero fraction of measurements. From the observed conditional spatial mean of SWE and SCA, we can derive the non-conditional values of accumulation and melt (n and u), which is input to the snow distribution models. The output from the models is the conditional mean, standard deviation and SCA. Figures 2–4 show observed and estimated (by Eqns (7–9) and (14) for the G_model) conditional mean and standard deviation, SCA and CV for Norefjell and Filefjell. For the G_model the parameters α0 and ν 0 are estimated from precipitation data according to the procedure described previously and in Reference Skaugen and AndersenSkaugen and Andersen (2010). The spatial mean and standard deviation of precipitation were sampled for an area of 40 × 40 km2 for Norefjell and 30 × 30 km2 for Filefjell, and the relationships s = amh were established. The mean of a unit was chosen to be E(y)=m=0.1 (mm).
Observed and simulated (by G_model and LN_model) conditional mean (a), standard deviation (b), SCA (c) and CV (d) for Norefjell.
Same as Figure 2 but for Filefjell 2011.

Same as Figure 2 but for Filefjell 2012.

The parameter CV for the LN_model was calibrated to optimize the estimation of the spatial standard deviation of SWE. The optimal value calibrated for the 2011 season at Filefjell was used to estimate the 2012 season.
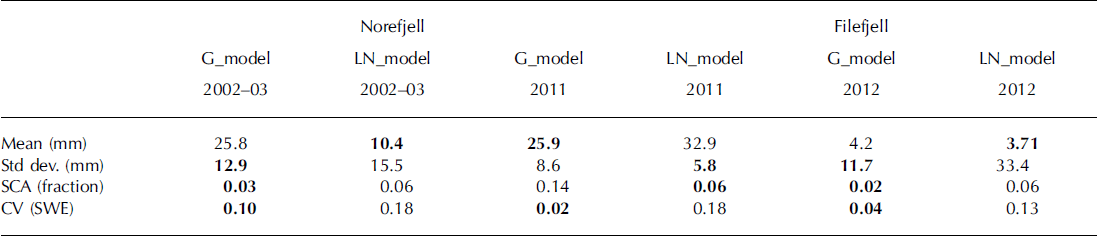
Table 1 shows the root-mean-square error (RMSE) for the simulated spatial mean, standard deviation, SCA and CV. The G_model has better RMSE scores for CV than the LN_model for all series. For spatial standard deviation and SCA the G_model gives better RMSE scores for two of the three series. For the spatial mean, the LN_model is better for two of the three series. Note especially that for the Filefjell 2012 series, for which the LN_model is not calibrated, the G_model is only slightly inferior in estimating the spatial mean and considerably better in estimating the other parameters (see also Figs 2–4).
RMSE for the G_model and the LN_ model. Bold values indicate the better estimate of G_model and LN_model. The LN_model for 2012 at Filefjell uses a CV calibrated using the data from 2011
Spatial distribution of snowmelt
For the 2009–12 snow seasons, attempts were made to measure the spatial distribution of snowmelt at Filefjell. The spatial distribution of snowmelt was estimated from differences in SWE at the stakes if consecutive measurements showed a decline in SWE. Figure 5 presents three melt events where we have plotted the empirical cumulative distribution functions together with estimated gamma distributions. The moments needed for estimating the parameters are estimated using Eqns (3), (5) and (6), and Eqn (2) is used to estimate the parameters. Note that the input to the estimation of the parameters is just the average melted amount, u. When applying a Kolmogorov–Smirnov test, we find that for 8 of the 12 observed melting events we could not reject the hypothesis that the empirical spatial distribution was gamma-distributed. Choosing the gamma distribution as the melt distribution, f s, is hence justified.
Spatial empirical and gamma cumulative distribution function for three measured melting events at Filefjell.

Discussion
In Figures 2–4 we observe an increase in observed spatial standard deviation at the onset of the melting period. For both Norefjell and Filefjell the maximum observed standard deviation can be seen to appear some time after the maximum SWE (at 15 May for Norefjell, 18 April for Filefjell 2011 and 9 May for Filefjell 2012). This feature has been described by Reference Pomeroy, Essery and TothPomeroy and others (2004) and Reference SkaugenSkaugen (2007) and was dubbed the ‘hysteretic’ effect of the spatial variability of SWE by Reference Egli and JonasEgli and Jonas (2009) and Reference Egli, Griessinger and JonasEgli and others (2011). The standard deviation simulated by the G_model captures this phenomenon to some degree, in that the highest simulated standard deviation coincides with the observed (Norefjell and Filefjell in 2011), whereas the spatial standard deviation of the LN_model continues to increase after this time. If we consider the last two terms in Eqn (10) (Eqns (11) and (13)), we find that these terms regulate whether the changes to the variance prior to the melting event,
 are negative or positive. At the start of the melting season, the negative contribution of Eqn (11) is more than compensated by Eqn (13), and the variance is increased or stable. As the melting season proceeds, the negative contribution increases and the total variance decreases.
Note that as a mathematical consequence the sign of the correlation between SWE and melt comes out negative, since otherwise the variance would never decrease. The sign of this correlation has been debated in the literature (Reference Faria, Pomeroy and EsseryFaria and others, 2000; Reference Essery and PomeroyEssery and Pomeroy, 2004; Reference SkaugenSkaugen, 2007), but it follows from the derivation of the spatial variance of SWE in this paper, and also from physical reasoning (that less energy is required to melt smaller amounts of SWE), that correlation between melt and SWE is negative.
The method proposed in this study is only parameterized from observed spatial statistics of precipitation. Besides showing that the spatial variability of precipitation to a large degree determines the spatial variability of SWE, the benefit of not having to use calibrated parameters is clearly seen in Table 1 and Figure 4. The LN_model, calibrated on 2011 data, is clearly inferior to the G_model when simulating the 2012 season. This exercise shows that the LN_model has less skill than the G_model when simulating a snow season for which it is not calibrated.
To our knowledge, this is the first time the empirical spatial distributions of snowmelt have been presented. Figure 5 shows that a gamma distribution for snowmelt is entirely plausible and that more intense melt gives a less skewed distribution (e.g. cf. Fig. 5a and b). The observed distributions of snowmelt thus support the assumption that the spatial frequency distribution of melt can also be modelled as a sum of correlated gamma-distributed variables.
Conclusions
A method for estimating the spatial statistical moments of SWE is proposed. Given the spatial moments, the spatial frequency distribution for SWE can be approximated. The distribution is dynamic in that its parameters change according to melt and accumulation events. A statistical model for the spatial PDF of SWE serves as the basis for methods like the snow depletion curves, but here facilitates an algorithm for estimating changes in SCA. The simulated SCA compares well with observed data.
The estimated moments of SWE agree very well with observed moments; in particular, the spatial standard deviation and coefficient of variation is better modelled than by the standard method currently used by the Norwegian version of the HBV model.
Through the mathematical–statistical formulation of the model, the correlation between melt and SWE is necessarily negative. Through this result, the ‘hysteretic’ effect reported by several authors for the spatial standard deviation of SWE is explained.
This study also presents empirical spatial distributions of snowmelt. It is shown that the distribution can be modelled as a sum of correlated gamma-distributed variables and approximated by a gamma distribution.
In an ongoing study the algorithms developed for relating the PDFs of SWE and melt to changes in SCA is used to update the snow reservoir from satellite-derived SCA.



