Introduction
Trichomonas vaginalis is a flagellated parasite that infects the genito-urinary tract of humans. It is the causal agent of trichomoniasis, one of the most common non-viral sexually transmitted diseases worldwide with an estimated 276 million cases per year according to the World Health Organization (WHO) (Newman et al., Reference Newman, Rowley, Vander Hoorn, Wijesooriya, Unemo, Low, Stevens, Gottlieb, Kiarie and Temmerman2015). Currently, trichomoniasis is associated with a high risk of acquiring human immunodeficiency virus (HIV) and human papillomavirus (HPV) (Lazenby et al., Reference Lazenby, Unal, Andrews and Simpson2014; Ghosh et al., Reference Ghosh, Muwonge, Mittal, Banerjee, Kundu, Mandal, Biswas and Basu2017), and may leads to adverse pregnancy outcomes (Silver et al., Reference Silver, Guy, Kaldor, Jamil and Rumbold2014; Mielczarek and Blaszkowska, Reference Mielczarek and Blaszkowska2016). Furthermore, resistance to 5-nitroimidazoles, the conventional clinical treatment for this infection, has been observed in some T. vaginalis strains (Dunne et al., Reference Dunne, Dunn, Upcroft, O'Donoghue and Upcroft2003), making difficult their use in symptomatic patients.
Trichomonas vaginalis adheres to epithelial cells and survives in the urogenital tract of the host (da Costa et al., Reference da Costa, de Souza, Benchimol, Alderete and Morgado-Diaz2005; Pereira-Neves and Benchimol, Reference Pereira-Neves and Benchimol2007), hence the mucosal immune response is the first line of defense against this pathogen. Particularly, the innate immune system plays a critical role in the containment and elimination of the parasites through the action of specialized cells including neutrophils, dendritic cells and macrophages (Iwasaki and Medzhitov, Reference Iwasaki and Medzhitov2015; Sica et al., Reference Sica, Erreni, Allavena and Porta2015). Apart from their phagocytic function, macrophages' plasticity allows them to acquire different phenotypes with distinct biological functions depending on the microenvironment or metabolic state of the host (Martinez and Gordon, Reference Martinez and Gordon2014; Fraternale et al., Reference Fraternale, Brundu and Magnani2015; Tan et al., Reference Tan, Wang, Li, Hong, Wang and Feng2016; Murray, Reference Murray2017). For example, macrophages activated by either a TLR agonist as LPS or microbial products, M(LPS + IFNγ), display an M1 phenotype, critical for elimination of pathogens. Macrophages activated by IL-4, M(IL-4), show an M2 phenotype to promote wound healing and inflammation resolution (Martinez and Gordon, Reference Martinez and Gordon2014; Murray et al., Reference Murray, Allen, Biswas, Fisher, Gilroy, Goerdt, Gordon, Hamilton, Ivashkiv, Lawrence, Locati, Mantovani, Martinez, Mege, Mosser, Natoli, Saeij, Schultze, Shirey, Sica, Suttles, Udalova, van Ginderachter, Vogel and Wynn2014).
Macrophages recognize Pathogen-Associated Molecular Patterns (PAMP's) through Receptor Recognition Patterns (RRPs) (Takeuchi and Akira, Reference Takeuchi and Akira2010; Broz and Monack, Reference Broz and Monack2013). Upon activation of RRPs, a complex signalling pathway is triggered that culminates with the activation of transcription factors inducing the expression of inflammatory genes (Takeuchi and Akira, Reference Takeuchi and Akira2010; Kumar et al., Reference Kumar, Kawai and Akira2011; Broz and Monack, Reference Broz and Monack2013), reactive oxygen species (ROS) like superoxide anion, and nitric oxide (NO) production (Forman and Torres, Reference Forman and Torres2002; Bogdan, Reference Bogdan2015), all of which will contribute to pathogen elimination. Toll-like receptor 9 (TLR9) is one member of the TLRs family expressed predominantly in dendritic cells, B lymphocytes and macrophages, and is localized in the endoplasmic reticulum, endosomes and lysosomes (Hemmi et al., Reference Hemmi, Takeuchi, Kawai, Kaisho, Sato, Sanjo, Matsumoto, Hoshino, Wagner, Takeda and Akira2000; Latz et al., Reference Latz, Schoenemeyer, Visintin, Fitzgerald, Monks, Knetter, Lien, Nilsen, Espevik and Golenbock2004; Farrokhi et al., Reference Farrokhi, Abbasirad, Movahed, Khazaei, Pishjoo and Rezaei2017). TLR9 recognizes unmethylated CpG dinucleotides (CpG DNA), which are common in bacterial, viral and protozoan genomes (Shoda et al., Reference Shoda, Kegerreis, Suarez, Roditi, Corral, Bertot, Norimine and Brown2001; Ahmad-Nejad et al., Reference Ahmad-Nejad, Häcker, Rutz, Bauer, Vabulas and Wagner2002; Krieg, Reference Krieg2002) but are rarely found (~1%) in mammalian genomes (Jones and Takai, Reference Jones and Takai2001; Krieg, Reference Krieg2002). Several reports have demonstrated that CpG DNA has immunostimulatory properties, inducing both maturation and activation of professional phagocytes as well as promoting a Th1 immune response (Messina et al., Reference Messina, Gilkeson and Pisetsky1991; Stacey et al., Reference Stacey, Sweet and Hume1996; Krieg, Reference Krieg2000, Reference Krieg2002), all of which is important to resolve infections. It has also been shown, both in vitro and in vivo, that parasite CpG DNA displays immunostimulatory effects on diverse immune cells via TLR activation and pro-inflammatory factor production, leading to improved infection resolution (Zimmermann et al., Reference Zimmermann, Egeter, Hausmann, Lipford, Röcken, Wagner and Heeg1998; Shoda et al., Reference Shoda, Kegerreis, Suarez, Roditi, Corral, Bertot, Norimine and Brown2001; Das et al., Reference Das, Ghosh, Singh, Saha, Ganguly and Das2015; Gong et al., Reference Gong, Cao, Guo, Dong, Yuan, Yao, Ren, Yao, Xu, Sun and Zhang2016). Furthermore, CpG DNA induces an enhanced mucosal immunity, which has resulted in its safe use in vaccines for humans as co-adjuvant (McGhee et al., Reference McGhee, Mestecky, Dertzbaugh, Eldridge, Hirasawa and Kiyono1992; Stacey and Blackwell, Reference Stacey and Blackwell1999; Holmgren and Czerkinsky, Reference Holmgren and Czerkinsky2005; Iho et al., Reference Iho, Maeyama and Suzuki2015). For example, the licensed Hepatitis B vaccine Engerix-B® (Halperin et al., Reference Halperin, Van Nest, Smith, Abtahi, Whiley and Eiden2003) and the licensed Anthrax vaccine Bio Thrax® (Rynkiewicz et al., Reference Rynkiewicz, Rathkopf, Sim, Waytes, Hopkins, Giri, DeMuria, Ransom, Quinn, Nabors and Nielsen2011) both contain CpG ODN as an adjuvant. In this study, we hypothesized that T. vaginalis DNA (TvDNA) can have immunomodulatory functions. To address this, we evaluated the effect of TvDNA on the immune response in vitro (using RAW264.7 cells), in addition to an in vivo trichomoniasis murine model. Our data show that TvDNA elicits an increase of pro-inflammatory cytokines and induces a local inflammatory response. Furthermore, TvDNA is able to modulate the immune response favouring the host and contributing to parasite infection resolution.
Materials and methods
Cell lines and strains
RAW264.7 cells were maintained in DMEM GlutaMAX medium (10566-016, Gibco) supplemented with 10% foetal bovine serum (FBS) (16000-044, Gibco) at 37 °C in a 5% CO2 atmosphere. Trichomonas vaginalis GT21 strain (Olmos-Ortiz et al., Reference Olmos-Ortiz, Barajas-Mendiola, Barrios-Rodiles, Castellano, Arias-Negrete, Avila and Cuéllar-Mata2017) was maintained in TYI-S-33 medium supplemented with 6% of adult bovine serum (ABS) (SU-120 microLab) and incubated at 37 °C.
Animals
Female BALB/c mice (6–8 weeks of age) were maintained under specifications from the Mexican Official Norm NOM-062-ZOO-1999 and fed ad libitum.
Trichomonas vaginalis DNA isolation
Parasites (3.8 × 10⁶) were grown in 120 mL of TYS-33 medium supplemented with 6% of ABS at 37 °C for 24 h. The trophozoites were harvested by spinning down at 500×g for 5 min and the pellet was washed three times with phosphate solution buffer – Tris EDTA (PBS-EDTA) pH 7.2. Trichomonas vaginalis DNA (TvDNA) was isolated by two methods. In the first method, TvDNA was isolated using the Wizard Genomic DNA purification kit (A1120, Promega) with some modifications and additional phenol-chloroform isolation. In the second method, freshly isolated TvDNA using the Wizard Genomic DNA purification kit was additionally purified by affinity chromatography using the system DetoxiGel Endotoxin Removing Gel (20344, ThermoScientific) under the manufacturer's specification. Finally, TvDNA was quantified in a Gene-Quant spectrophotometer and stored at −20 °C until used.
Bacterial and mammalian DNA isolation
Escherichia coli DNA and mouse spleen DNA were isolated using the Wizard genomic DNA purification kit (Promega) following the manufacturer's instructions. The bacterial and mammalian genomic DNA were quantified and stored as described above.
Limulus amoebocyte lysate-QCL and differential SDS-PAGE assay
To verify the purity of TvDNA, the endotoxin level from TvDNA was tested by limulus amoebocyte lysate (LAL)-QCL-1000 (5064-7U, LONZA) following the manufacturer's specifications. Additionally, 50 µg of TvDNA were analysed in SDS-PAGE and stained using three methods: Coomassie, silver and periodic acid-shift (PAS), to rule out any possible contamination of proteins and/or saccharides coming from the parasite. Moreover, 50 µg of TvDNA were used for electrophoresis on a 2% agarose gel and visualized under ethidium bromide staining to verify the integrity of TvDNA.
Nitric oxide production assay
The nitric oxide (NO) production in culture supernatants was indirectly determined by a modified Griess assay (Arias-Negrete et al., Reference Arias-Negrete, Jiménez-Romero, Solís-Martínez, Ramírez-Emiliano, Avila and Cuéllar-Mata2004), evaluating the nitrite concentration released by RAW264.7 cells. Briefly, 2.5 × 10⁵ macrophages were placed in 96-well plates and stimulated with TvDNA (50 µg mL−1). Bacterial lipopolysaccharide (LPS, L3012 Sigma Aldrich) was used as a conventional positive control (Su et al., Reference Su, Chiou, Chao, Lee, Chen and Tsai2011). Unstimulated macrophages and DNA from BALB/c mice spleen (50 µg mL−1) were used as negative controls. To block LPS, cells were treated in the presence or absence of polymyxin B (25 mg mL−1). The cells were incubated at 37 °C in a 5% CO2 atmosphere for 36 h. The Griess assay was performed using 100 µL of macrophage supernatants, adding 50 µL of sulphanilamide solution and 50 µL of N-1-naphthyl-ethylenediamine. The reaction was performed at room temperature in the absence of light for 40 min. Nitrite accumulation was determined by spectrophotometry at 540 nm using a standard calibration curve of nitrite.
Semiquantitative RT-PCR
Expression of both pro-inflammatory cytokines (IL-6, IL-12p40, TNF) and anti-inflammatory cytokines (IL-10 and IL-13) in RAW264.7 cells was evaluated at different times of exposure to TvDNA (0.5, 1, 2, 3, 6, 9, 12, 15, 18 h). Briefly, total RNA was isolated from RAW264.7 cells incubated with TvDNA by TRIzol™ Reagent according to the manufacturer's instructions. Two micrograms of total RNA were treated with DNase I, amplification grade system to remove any trace of genomic DNA. Retrotranscriptase assays were performed using SuperScript™ III Reverse Transcriptase system according to the manufacturer's instructions. Expression level analysis for IL-6, IL-12p40, TNF, IL-10, IL-13 and GAPDH (as control), was performed by Platinum® PCR SuperMix using the specific oligonucleotides (Table S2). The amplification conditions for IL-6, TNF and GAPDH were: first denaturalization at 94 °C/3 min (1 cycle), second denaturation at 94 °C/30 s, followed by alignment at 51 °C/30 s and extension at 72 °C/1 min (35 cycles) and a final extension of 72 °C/10 min (1 cycle). The band sizes observed were 159 bp for IL-6, 203 bp for TNF and 300 bp for GAPDH. The amplification conditions for IL-10, IL-13 and IL-12p40 were: first denaturation at 94 °C/3 min (1 cycle), second denaturation at 94 °C/30 s, followed by alignment at 55 °C/30 s, extension at 72 °C/1 min (35 cycles) and a final extension at 72 °C/10 min (1 cycle). The observed band sizes were 563 bp for IL-10, 110 bp for IL-13 and 125 bp for IL-12p40. All amplification products were analysed in 2% agarose gels using ChemiDoc MP Imaging Systems and the densitometric analysis was performed using software ImageLab4.0.
Macrophage polarization assay
Macrophages' morphological changes induced by TvDNA were determined by confocal microscopy. Briefly, 1 × 10⁵ RAW264.7 macrophages were seeded on 12 mm coverslips placed inside the wells of 24-well tissue culture plates in DMEM without foetal bovine serum but containing the following stimuli: lipopolysaccharide (LPS) (10 ng mL−1) plus interferon gamma (IFN-γ) (10 ng mL−1) as positive control for M1 phenotype induction; IL-4 (20 ng mL−1) as positive control for M2 phenotype induction and TvDNA (50 µg mL−1). Cells were incubated for 24 h with the different stimuli at 37 °C in 5% CO2. Next, cells were washed three times with PBS. Macrophages were fixed with 2% paraformaldehyde and then washed twice with PBS-glycine. Finally, the cells were mounted with 10 µL of ProLong™ Gold Antifade Mountant. Images were taken by confocal microscopy and were edited using ZEN 2 lite software. The morphology of 100 cells per field was evaluated. The axial ratio was calculated using ImageJ software (https://imagej.nih.gov/ij/) and reported as the aspect ratio.
Nitro blue tetrazolium assay
Reactive Oxygen Species (ROS) released from activated macrophages under different stimuli were determined by nitro blue tetrazolium (NBT) assay (Choi et al., Reference Choi, Kim, Cha and Kim2006). Macrophages (1 × 10⁵ cells) were seeded into 96-well culture plates in DMEM without foetal bovine serum in the presence of lipopolysaccharide (LPS) (500 ng mL−1) plus interferon gamma (IFN-γ) (10 ng mL−1) as control for M1 phenotype induction, IL-4 (20 ng mL−1) as control for M2 phenotype induction, TvDNA (50 µg mL−1) or diphenyleneiodonium (DPI) (30 µ m), a NADPH oxidase (Nox2) inhibitor. NBT (1 mg mL−1) was added along with each different stimulus at the start of the assay to determine all released ROS. The plate was centrifuged at 800×g for 1 min at room temperature and incubated at 37 °C in a 5% CO2 atmosphere for 40 min. Next, the supernatant was discarded and the cells were quickly washed with 70% methanol to remove any trace of non-reduced NBT. Formazan particles formed inside macrophages' phagosomes were solubilized with 2 mm KOH (110 µL) and DMSO (140 µL). Finally, released ROS was measured at 620 nm.
Trichomonas vaginalis infection in female BALB/c mice
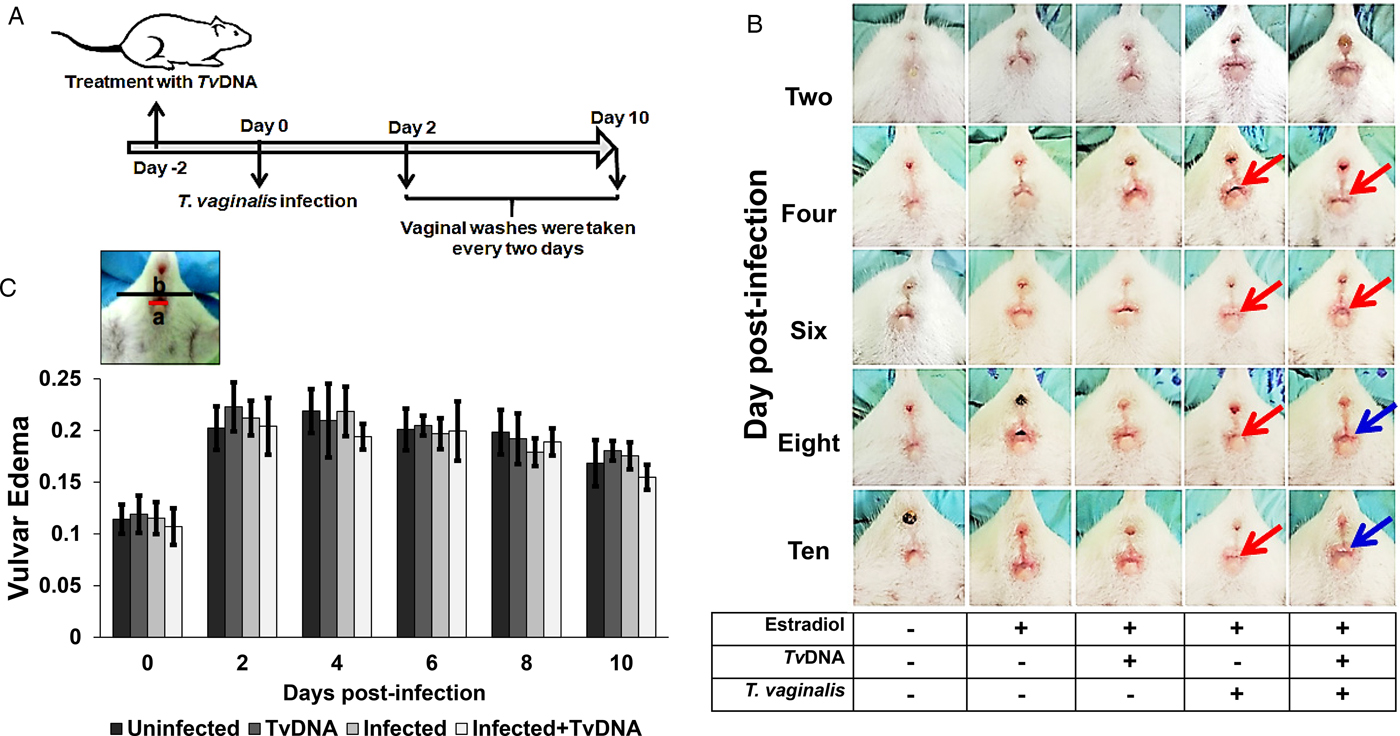
Female BALB/c mice (6–8 weeks old) were used to establish T. vaginalis infection according to the protocol reported by Olmos-Ortiz et al. (Reference Olmos-Ortiz, Barajas-Mendiola, Barrios-Rodiles, Castellano, Arias-Negrete, Avila and Cuéllar-Mata2017). Five different groups, with five female BALB/c mice per group, were established. Four out of five groups were treated subcutaneously with 50 µL of oestradiol valerate/norethisterone enanthate (MESIGYNA, BAYER) at 5 and 50 mg mL−1, respectively (Fig. 4A). To explore the effect of TvDNA, two groups were treated with 50 µg mL−1 of TvDNA, vaginally administered two days before infection. Two groups of mice were vaginally inoculated with 1 × 10⁵ parasites in 50 µL TYI-S-33 medium. From the second day until the tenth day post-infection, vaginal washes were collected. One group of five uninfected mice was used as a control. The in vivo experiments were conducted twice.
Vulvar inflammation evaluation
The parameters to define vulvar inflammation due to T. vaginalis infection, were vulvar irritation (redness), the presence of purulent secretions and vulvar size increase. The vulvar size increase was evaluated by the length (in a number of pixels) of vulvar diameter over the rear width of each mouse on photos taken at each post-infection day. The vulvar size values were acquired in a double-blind fashion.
Trichomonas vaginalis viability in female BALB/c mice pretreated with TvDNA
To determine the effect of TvDNA pretreatment on the murine model of infection with live trophozoites, the parasites' viability at 4, 6 and 10 days post-infection was quantified using the LIVE/DEAD™ Viability/Cytotoxicity Kit system according to the manufacturer's instructions. Vaginal washes from female mice treated and untreated with TvDNA and later infected with the parasite were centrifuged at 400×g for 10 min, the pellet was resuspended in 100 µL of TYI-S-33 medium and deposited in culture tubes with 5 mL of TYI-S-33. The cultures were incubated at 37 °C for 3 days. A culture tube with viable trophozoites from a regular culture and another with non-viable trophozoites (killed with methanol 70% at 37 °C for 30 min) were incubated along with the culture tubes from the vaginal washes being tested. Next, the culture tubes were centrifuged at 500×g for 5 min and the pellet was resuspended in 50 µL of PBS to which 50 µL of calcein 10 µ m (to distinguish live cells) and 100 µL of ethidium homodimer 4 µ m (to identify dead cells) were added. The cell suspension was gently mixed and incubated for 30 min at room temperature in darkness. Afterwards, samples were centrifuged at 500×g for 5 min, the pellet was washed twice with PBS and the trophozoites were fixed with 2% paraformaldehyde. Then, trophozoites were washed twice with PBS-glycine and resuspended in PBS. The trophozoites were mounted with 10 µL of ProLong™ Gold Antifade Mountant. Images were taken by confocal microscopy and were edited using de software ZEN 2 lite. The ratio of calcein-AM (green-fluorescence) over ethidium-homodimer-1 (red fluorescence) parasite number was plotted as viability percentage.
Quantification of cytokines in vaginal washes of infected female mice
The effect of TvDNA on cytokine secretion was evaluated through changes in IL-6, IL-10 and IL-17 cytokine levels. These cytokines were quantified by ELISA kits (Invitrogen, San Diego, CA, USA: 88-7064-22 for IL-6, 88-7105-22 for IL-10 and eBiosciencie, Waltham, MA, USA: BMS6001 for IL-17) according to the manufacturer's guidelines. Cytokines were measured at 0, 4, 8, 10 and 14 days post-infection in mice pretreated with or without TvDNA. Mice treated with oestradiol valerate/norethisterone enanthate and untreated were used as control. We analysed the cytokine secretion in vaginal washes from T. vaginalis-infected mice from two independent experiments, collecting 150 µL from each vaginal wash (in PBS at pH 7) at each day post-infection. Samples for each cytokine determination were performed using 50 µL from the vaginal washes recovered. Data plotted correspond to the average from 10 mice per condition (n = 10 ± standard error).
Statistical analysis
The aspect ratio of the cells, nitrite and ROS production data were analysed by the Kruskal–Wallis test with subsequent Dun's test (three independent experiments). The parasite viability and the cytokine production in vivo experiments data were analysed by the Kruskal–Wallis test with subsequent Dun's test (two independent experiments). Vulvar inflammation data were analysed by the Kruskal–Wallis test and post hoc test. All data are presented as the mean ± standard error.
Results
TvDNA induces NO production in RAW264.7 cells
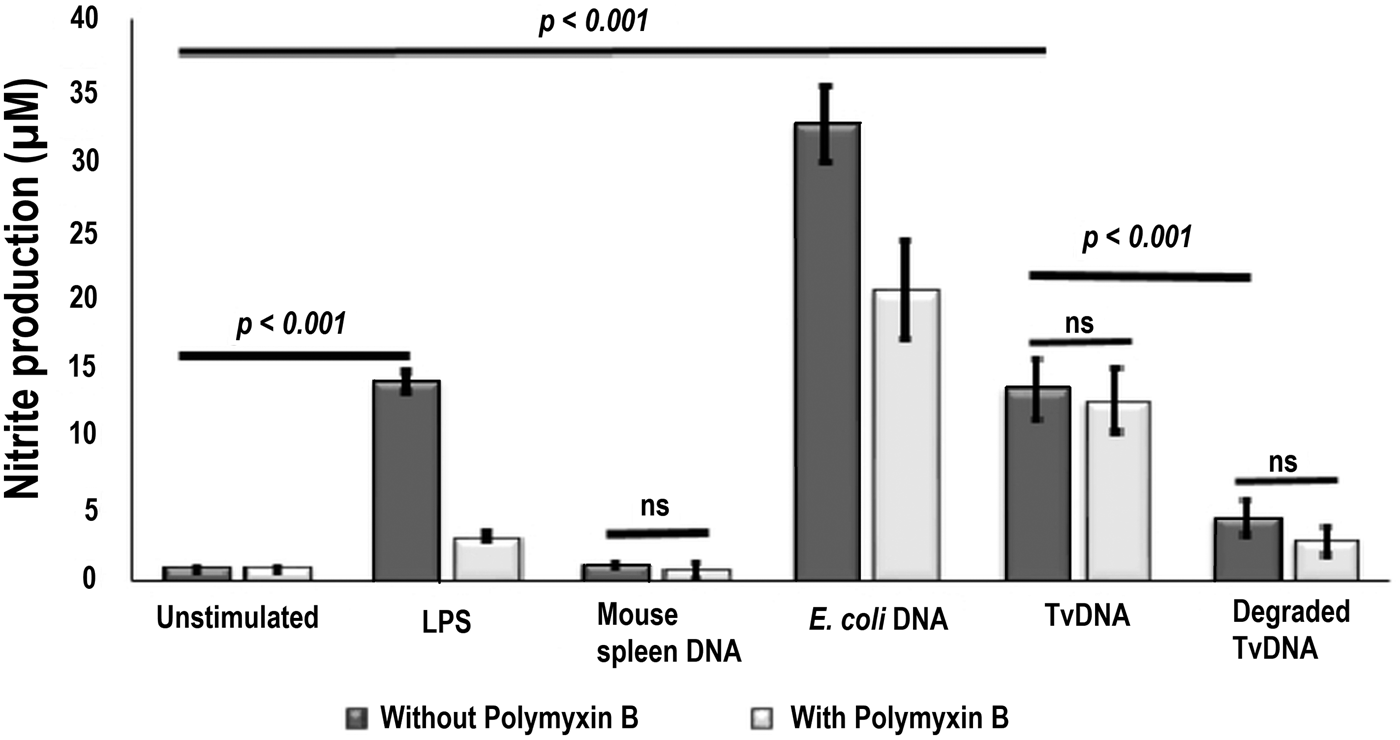
Nitric oxide (NO) is a small inorganic radical that is implicated in the modulation of several physiological functions in mammals. In immune cells, NO is produced by inducible nitric oxide synthase (iNOS) and has beneficial microbicidal, antiparasitic, antiviral and antitumoral effects (Pautz et al., Reference Pautz, Art, Hahn, Nowag, Voss and Kleinert2010; Bogdan, Reference Bogdan2015). External components of T. vaginalis activate human macrophages (Han et al., Reference Han, Goo, Park, Hwang, Kim, Yang, Ahn and Ryu2009) as it has been reported that attenuated parasites induce NO production. Therefore, we tested whether TvDNA, an internal molecule of the parasite, could induce activation in RAW264.7 cells. Upon exposure to TvDNA (50 µg mL−1) murine macrophages released nitrite at similar levels as bacterial LPS (10 ng mL−1), the main component of the cell wall of Gram-negative bacteria (Fig. 1). In order to confirm that the activation was due to TvDNA and not to residual bacterial LPS contamination from the TvDNA isolation procedure, we added polymyxin B (which binds to LPS) (Galanos et al., Reference Galanos, Lüderitz, Rietschel, Westphal, Brade, Brade, Freudenberg, Schade, Imoto and Yoshimura1985; Schletter et al., Reference Schletter, Heine, Ulmer and Rietschel1995; Raetz and Whitfield, Reference Raetz and Whitfield2002) to macrophages stimulated with TvDNA. The addition of polymyxin B did not abolish the NO production of macrophages stimulated with TvDNA as in those macrophages that were treated only with bacterial LPS or stimulated with E. coli DNA (Fig. 1). Importanlty, there was no significant NO production by RAW264.7 cells stimulated with either DNase I-degraded TvDNA nor DNA obtained from mouse spleen (Fig. 1). Furthermore, the purity of TvDNA was assessed by endotoxin test (Table S1) and differential SDS-PAGE assays (Fig. S1A). Additionally, we evaluated the efficiency of two methods to obtain the parasite nucleic acid by determining the NO production in RAW264.7 cells treated with TvDNA (Fig. S1B). Our findings indicate that both ‘isolated’ and ‘isolated and purified’ TvDNA can activate macrophages for an efficient immune response starting with high NO production. Moreover, our data show that the integrity of TvDNA is required to induce macrophage activation (Fig. 1 and Fig. S1C). Henceforth, ‘isolated’ TvDNA was used in the following in vitro and in vivo experiments to further evaluate its effect.
TvDNA induces NO production in RAW264.7 cells. NO production was determined in culture supernatants of untreated (black bars) and polymyxin B-treated (25 mg mL−1, grey bars) RAW264.7 cells by the Griess modified assay after 36 h of incubation with LPS (10 ng mL−1), mouse spleen DNA (50 µg mL−1), E. coli DNA (50 µg mL−1) or TvDNA (50 µg mL−1). Degraded TvDNA was obtained after incubation with DNAse I. Unstimulated macrophages were used as negative control. Data are representative of three independent experiments expressed as mean ± s.d. Significance was determined by Kruskal–Wallis analysis and Dunn's test (n = 18, ***P < 0.001). ns = non-significant.

TvDNA induces an early pro-inflammatory profile in murine macrophages
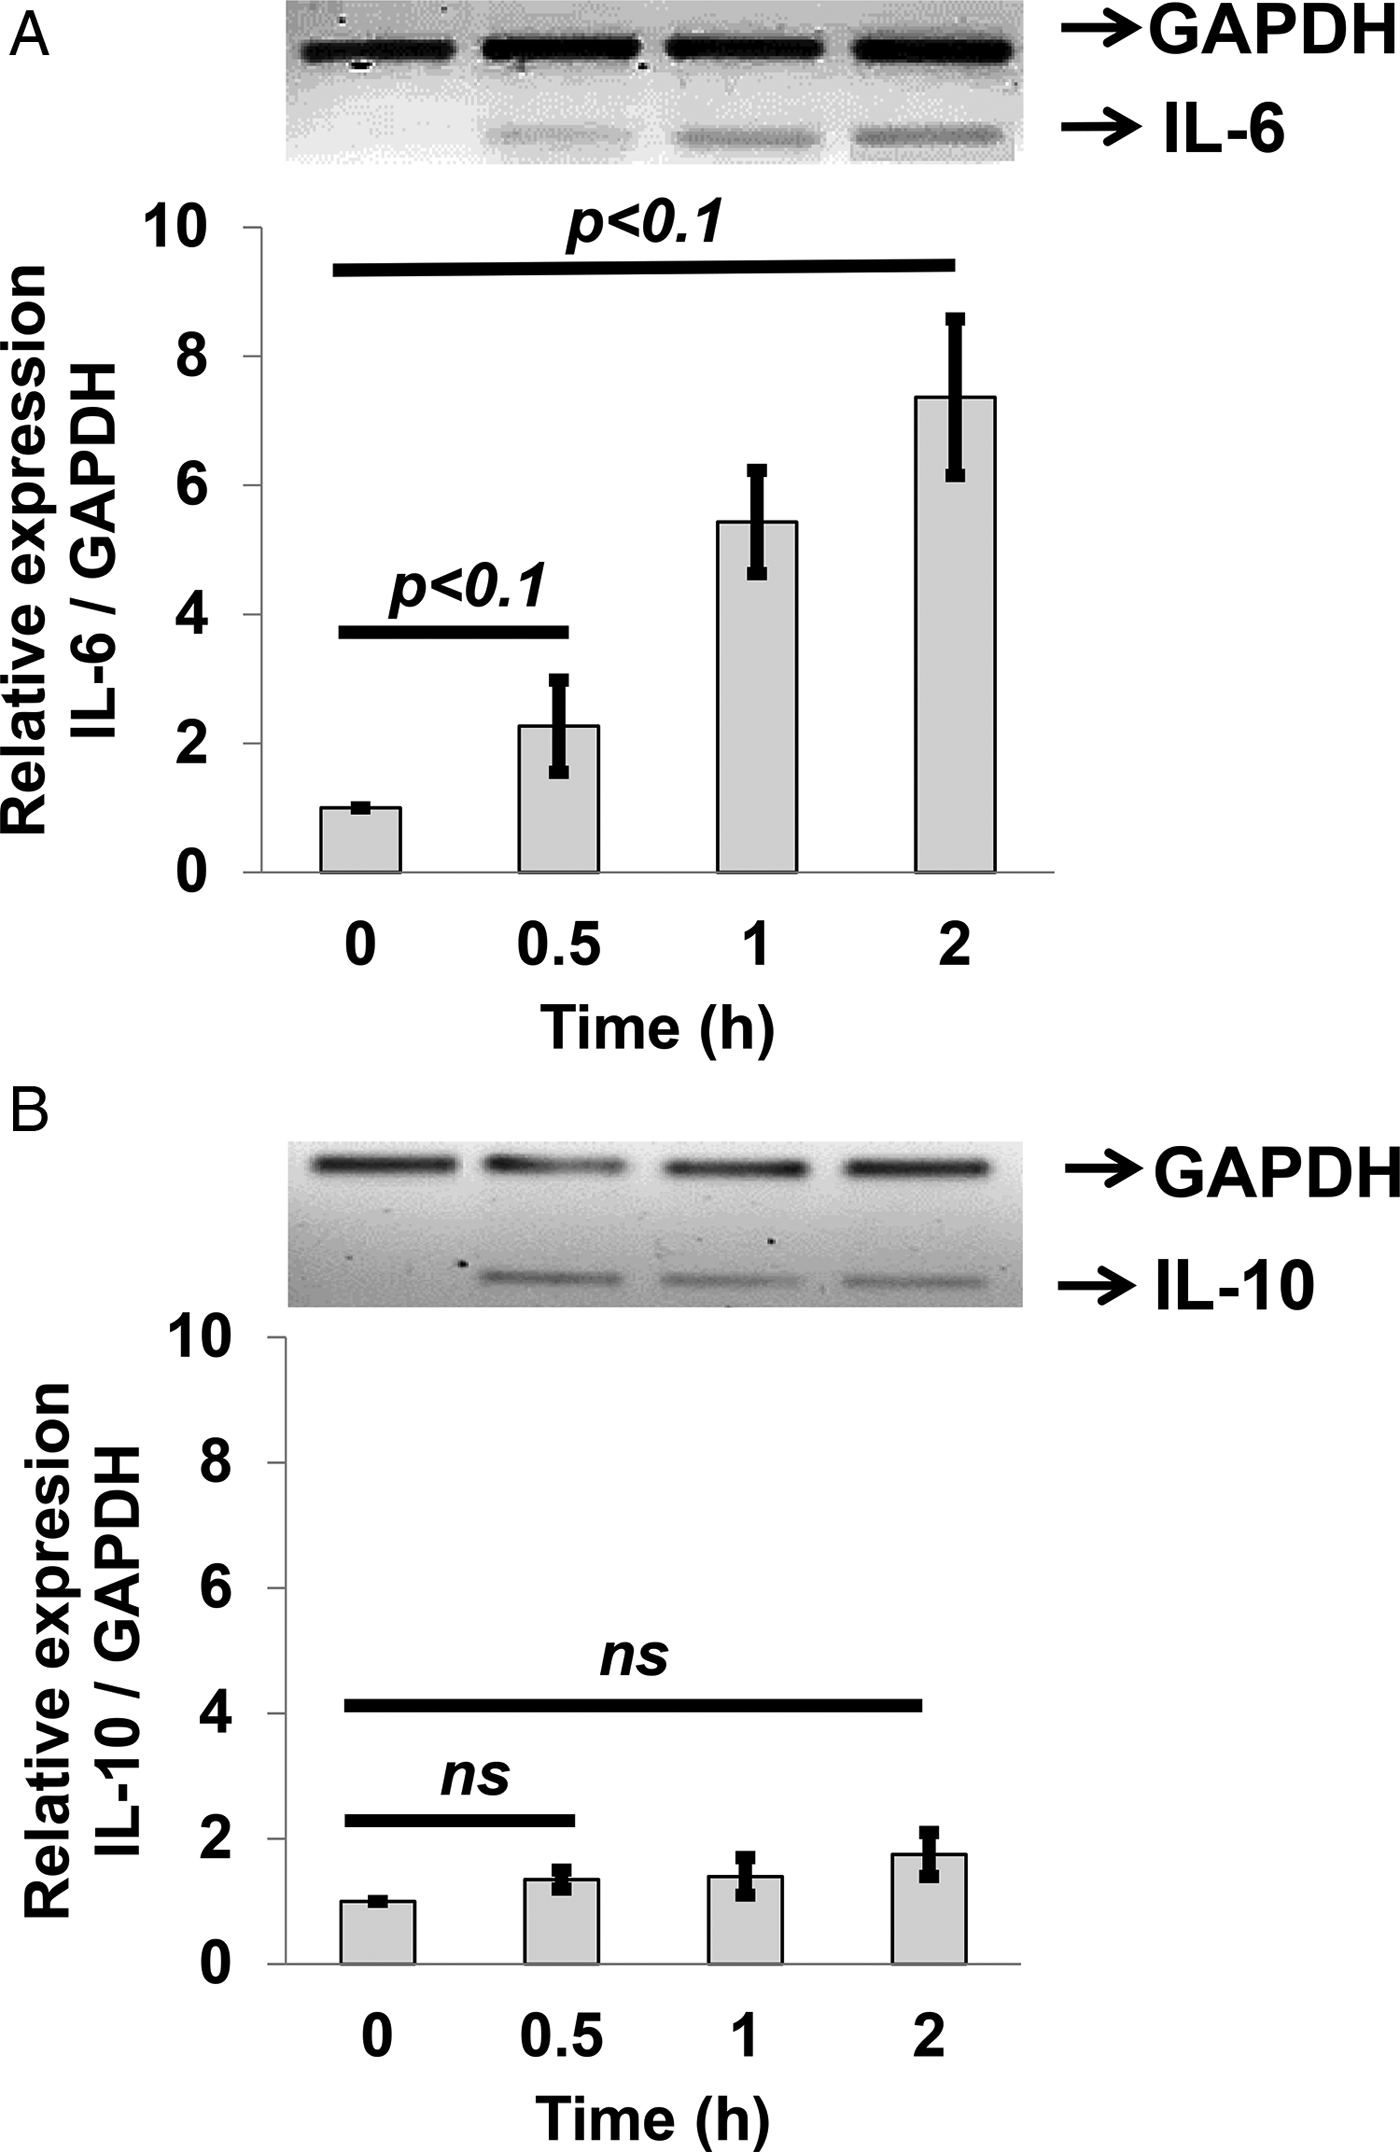
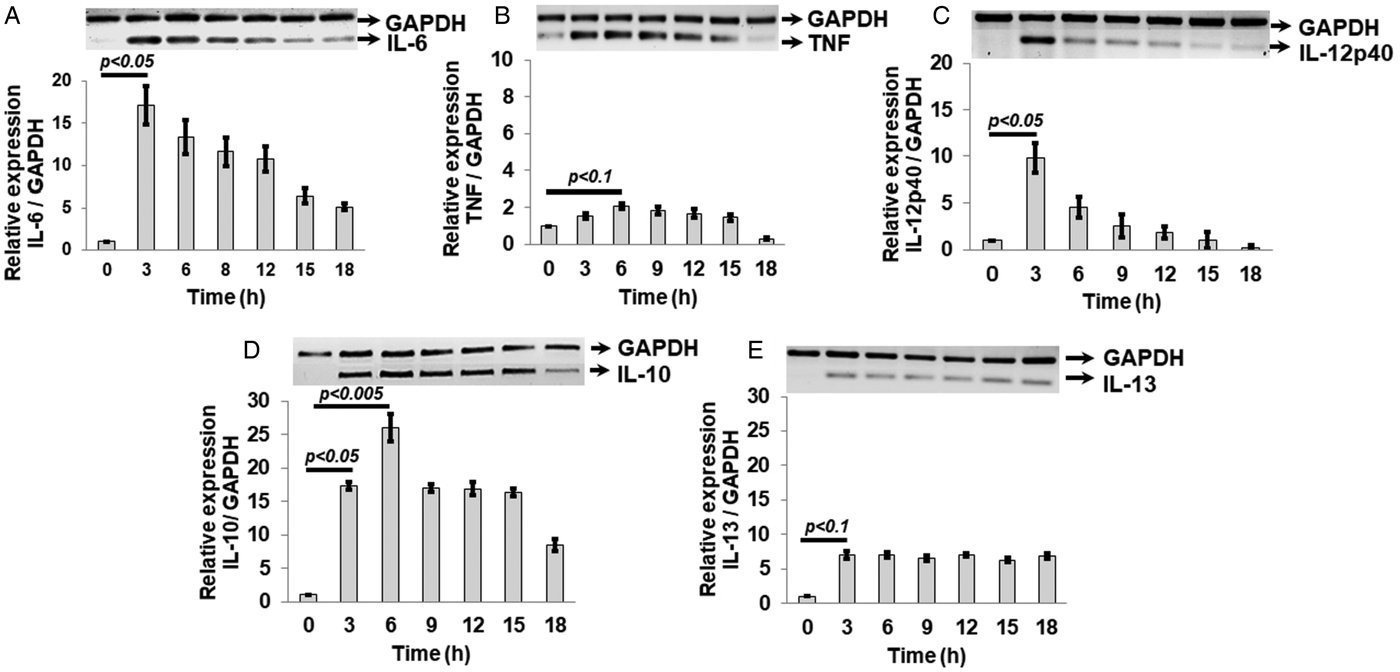
Our results indicated that TvDNA is a macrophage activator similar to bacterial LPS (Fig. 1). Next, we investigated the type of response induced by TvDNA through cytokine mRNA expression in RAW264.7 cells. Significant mRNA expression levels of IL-6, a pro-inflammatory cytokine, were induced within 30 min and a further increase on IL-6 mRNA was observed after up to 2 h of TvDNA treatment (Fig. 2A). In contrast, there was no significant increase in the anti-inflammatory cytokine IL-10 mRNA when RAW264.7 cells were stimulated with TvDNA for up to 2 h (Fig. 2B). We next looked at the effect of longer TvDNA exposure times on the mRNA levels of these cytokines. Interestingly, the highest IL-6 mRNA expression level was observed at 3 h followed by a gradual decrease after 18 h of TvDNA exposure (Fig. 3A). Although different in magnitude, a similar temporal effect was observed for the mRNA levels of pro-inflammatory cytokines TNF and IL-12p40 (Fig. 3B and C). The RAW264.7 macrophages required three hours to show a significant increase in IL-10 mRNA expression that reached the highest levels until 6 h of treatment. These increased IL-10 mRNA levels were sustained up to 15 h of TvDNA exposure and started to decrease by 18 h (Fig. 3D). On the other hand, the expression levels of IL-13, another anti-inflammatory cytokine, showed a significant increase 3 h after TvDNA treatment that was sustained throughout 18 h (Fig. 3E). Taken together, these findings suggest that TvDNA modulates macrophages' response via a robust cytokine production through an early pro-inflammatory phase, followed by an anti-inflammatory profile to avoid an exacerbated inflammatory stage.
Early cytokine mRNA expression in RAW264.7 cells stimulated with TvDNA. Relative expression of IL-6 mRNA (A) and IL-10 mRNA (B) were evaluated by RT-PCR. GAPDH was used as a constitutive expression control. The densitometry analysis was performed in ImageLab6.0 software. Data are representative of three independent experiments expressed as the mean ± s.e. Significance was determined by Kruskal–Wallis analysis and Dunn's test (n = 9, +P < 0.1).

TvDNA induces an early proinflammatory and delayed anti-inflammatory profile in RAW264.7 cells. Relative expression of IL-6 (A), TNF (B), IL-12p40 (C), IL-10 (D) or IL-13 (E); mRNA levels were evaluated by RT-PCR. GAPDH was used as a control for a constitutively expressed gene. Data are representative of three independent experiments expressed as mean ± s.e. Significance was determined by Kruskal–Wallis analysis and Dunn's test (n = 9, +P < 0.1, **P < 0.05, ***P < 0.005).

TvDNA induces NADPH oxidase (Nox2) activity and morphology changes in murine macrophages
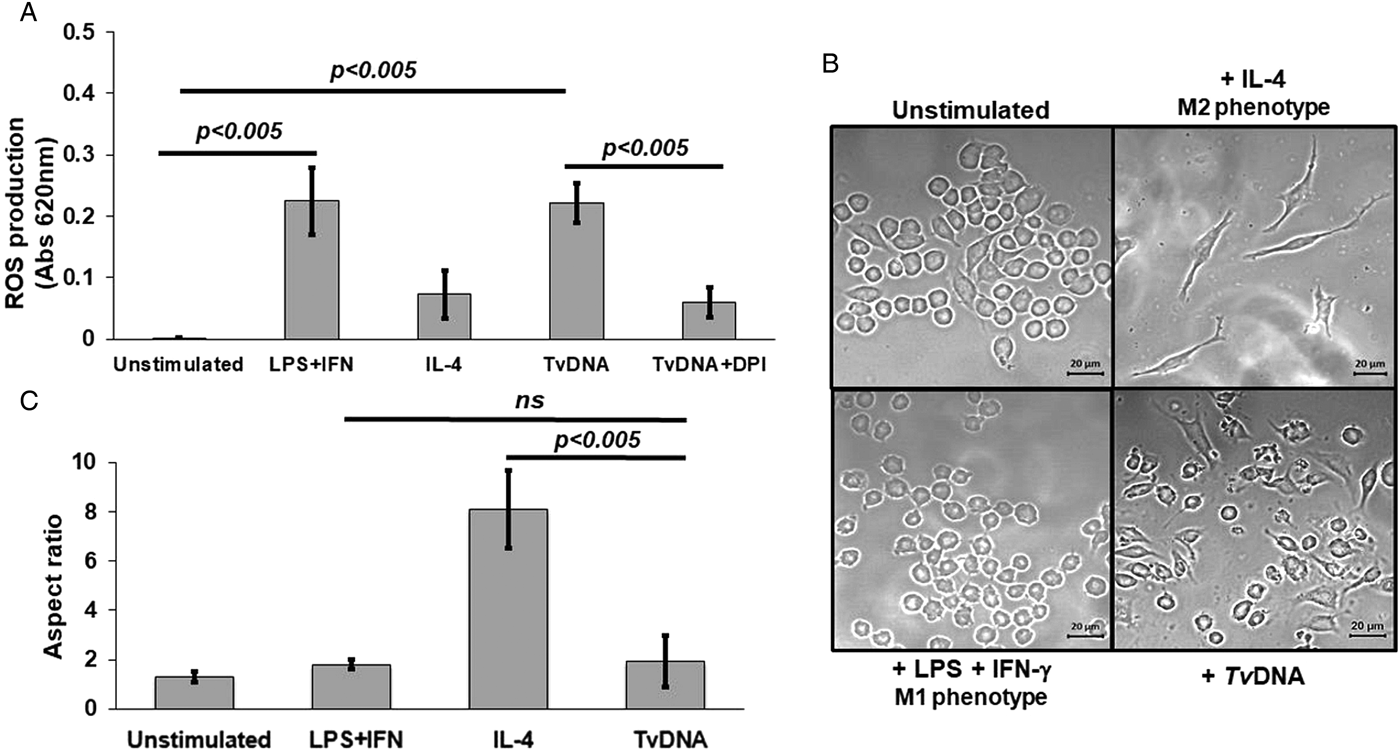
Macrophages are professional phagocytes in which NO is a pro-inflammatory mediator that contributes to the elimination of pathogens (Bogdan, Reference Bogdan2015). However, ROS production is also part of the microbicide machinery of these cells through NADPH oxidase activity (Nox2) (Warnatsch et al., Reference Warnatsch, Tsourouktsoglou, Branzk, Wang, Reincke, Herbst, Gutierrez and Papayannopoulos2017). ROS, particularly superoxide anion, are involved in M1 and M2 macrophage differentiation (Martinez and Gordon, Reference Martinez and Gordon2014; Murray, Reference Murray2017). Thus, we first evaluated superoxide anion production using the nitro blue tetrazolium colorimetric assay (Choi et al., Reference Choi, Kim, Cha and Kim2006). Because ROS release occurs within minutes after stimulation (Choi et al., Reference Choi, Kim, Cha and Kim2006), we exposed RAW264.7 macrophages to TvDNA (50 µg mL−1) for 40 min. As shown in Fig. 4A, macrophages displayed increased levels of ROS upon TvDNA treatment that were similar to those induced by a combination of LPS (500 ng mL−1) plus IFNγ (10 ng mL−1). Importantly, ROS production was inhibited when macrophages were treated with TvDNA plus DPI (30 µ m), a selective inhibitor of Nox2 (Kowluru and Kowluru, Reference Kowluru and Kowluru2014; Zhu et al., Reference Zhu, Fan, Wang, Chen, Yang, Lu, Chen, Zheng and Liu2017). These results suggest that TvDNA promotes ROS production via Nox2 activity. Interestingly, the inhibition of ROS levels with DPI was comparable to the low levels produced by macrophages that were treated with the anti-inflammatory cytokine IL-4, that promotes M2 phenotype in macrophages (Gordon, Reference Gordon2003; Martinez and Gordon, Reference Martinez and Gordon2014). Because the role of M1 or M2 macrophages during T. vaginalis infection remains unknown, we next investigated whether TvDNA induced any morphological changes in RAW264.7 cells that characterize the functionally distinct M1/M2 phenotypes. Therefore, RAW264.7 macrophages were co-stimulated for 24 h with LPS (10 ng mL−1) plus IFNγ (10 ng mL−1). As expected, these macrophages displayed a ‘fried egg’-like shape, the characteristic morphology of M1 phenotype, (Fig. 4B, bottom left). In contrast, macrophages stimulated with recombinant IL-4 (20 ng mL−1) showed a fibroblast-like appearance, the characteristic morphology of M2 phenotype (Fig. 4B, top right). Strikingly, macrophages stimulated with TvDNA (50 µg mL−1) largely displayed a ‘fried egg shape’ after 24 h of treatment (Fig. 4B, bottom right). The aspect ratio of macrophages reflecting the morphological changes induced by TvDNA and the other treatments was quantified and it is shown in Fig. 4C. These data indicate that the majority of TvDNA-treated cells displayed the M1 morphology profile, which prevailed over the M2 profile. Taken together, these findings show that TvDNA induces a burst of ROS release due to NADPH-oxidase activity, which may lead to a morphological and functional M1 phenotype in RAW264.7 macrophages. As previously shown (Sica et al., Reference Sica, Erreni, Allavena and Porta2015), this kind of macrophage activation can contribute to infection resolution.
ROS production and morphology changes induced by TvDNA in RAW264.7 cells. (A) ROS production in RAW264.7 was determined using the NBT assay after 40 min of treatment with different stimuli. Cells were incubated with LPS (500 ng mL−1) plus IFNγ (10 ng mL−1) or recombinant IL-4 (20 ng mL−1) as M1 or M2 phenotype induction controls, respectively. Macrophages were incubated with TvDNA (50 µg mL−1) in the presence or absence of DPI (30 µ m), a Nox2 inhibitor. Unstimulated macrophages were used as a negative control. Data are representative of three independent experiments expressed as the mean ± s.d. Significance was determined by Kruskal–Wallis analysis and Dunn's test (n = 18, *P < 0.025). ns = non-significant. (B) Morphology changes were observed in RAW264.7 cells incubated for 24 h with LPS (10 ng mL−1) plus IFNγ (10 ng mL−1) as M1 phenotype control, while recombinant IL-4 (20 ng mL−1) was used as M2 phenotype control. Macrophages were pretreated with TvDNA (50 µg mL−1) to determine its effect or left untreated to use as a negative control. Images were taken by confocal microscopy, Scale bar 20 µm. Data are representative of three independent experiments. (C) Quantitative analysis of the morphological changes in macrophages induced by TvDNA. The aspect ratio for cells under different stimuli was measured and calculated using ImageJ software. Significance was determined by Kruskal–Wallis analysis and Dunn's test (***P < 0.005). One hundred cells per condition were analysed. ns = non-significant.

TvDNA pretreatment promotes inflammation in female mice challenged with live parasites
The CpG motifs contained in the microbial genome have an immunomodulatory effect, and it has been shown that these sequences are able to counteract an infection using in vivo models (Shivahare et al., Reference Shivahare, Vishwakarma, Parmar, Yadav, Haq, Srivastava, Gupta and Kar2014). Shivahare et al. (Reference Shivahare, Vishwakarma, Parmar, Yadav, Haq, Srivastava, Gupta and Kar2014) observed in both hamster and murine models of visceral leishmaniasis an increase in mRNA expression for iNOS and pro-inflammatory cytokines when the infected animals had been pretreated with CpGODN enveloped in liposomes. On the other hand, IL-10 and TGF-beta mRNA levels decreased. This characteristic Th1 immune response was associated with a decrease in the parasitic burden for both infectious models.
Our results suggest that TvDNA modulates macrophages' response through NO, cytokines and ROS production in vitro, presumably due to the CpG motifs contained in T. vaginalis genome. To determine how TvDNA impacts both infectivity and pathogenicity of this parasite, we investigated the TvDNA immunomodulatory effect in female BALB/c mice infected with T. vaginalis, using the in vivo infection model that we previously reported (Olmos-Ortiz et al., Reference Olmos-Ortiz, Barajas-Mendiola, Barrios-Rodiles, Castellano, Arias-Negrete, Avila and Cuéllar-Mata2017) (Fig. 5A). TvDNA was vaginally administered two days before infecting female mice with live trichomonas. Four days post-infection, both untreated and TvDNA-treated female mice, showed signs of trichomoniasis, characterized by soft vulvar swelling, oedema formation, and whitish discharges. The vulvar oedema persisted up to 10 days post-infection in both groups of trophozoite-inoculated female mice. However, the infection signs were less evident in the infected group pre-treated with TvDNA (Fig. 5B). In parallel, we also measured the extent of the vulvar oedema by quantifying the number of pixels of vulvar diameter over the rear width for each mouse, at each post-infection day. Comparing the two mice groups, untreated and pretreated with TvDNA, there was no significant difference in vulvar oedema throughout the infection period, up to 10 days post-infection (Fig. 5C). For vulvar oedema measurements, we considered as zero time of infection, the mice prior to being subjected to infection. These findings suggest that pre-treatment of TvDNA induces and maintains an inflammatory reaction in the host, which could be important for infection resolution.
TvDNA promotes vulvar inflammation in infected mice. (A) Female mice were TvDNA-pretreated or not, then infected with live trophozoites and vaginal washes were collected at 0, 4, 6 and 10 days post-infection. (B) Development of vulvar oedema in untreated and TvDNA-pretreated (50 µg mL−1) mice during ten days of infection with 5 × 10⁶ trophozoites. Red arrows show the vulvar oedema and blue arrows show the persistence of vulvar oedema. (C) Evaluation of vulvar oedema at different days post-infection in untreated (black bars) and TvDNA-pretreated (grey bars) mice. Vulvar oedema at different days post-infection was calculated as the ratio of vulvar diameter (a = red line) over the mouse rear width (b = black line). Data are representative of two independent experiments expressed as the mean ± s.d. Significance was determined by Kruskal–Wallis analysis and Dunn's test (n = 5 per group, P > 0.1).

TvDNA pretreatment of female mice affects the viability of T. vaginalis during parasite infection
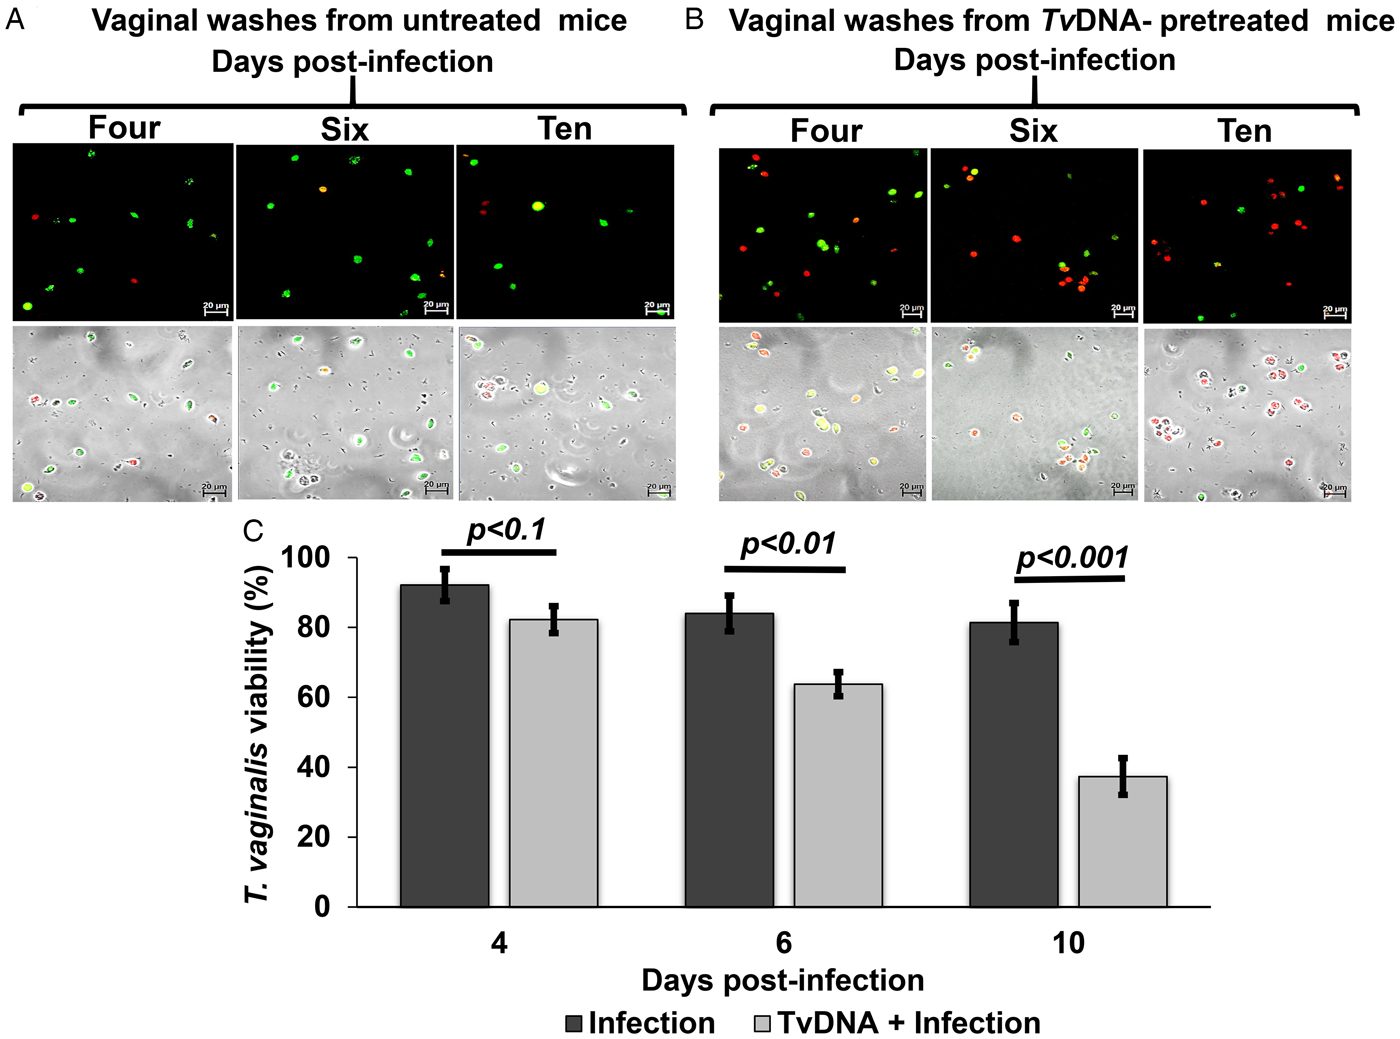
It has been reported that the immune stimulation triggered by CpG DNA induces a strong Th1 response, which is necessary to decrease parasite burden and to resolve the infection in a murine model of leishmaniasis (Ehrlich et al., Reference Ehrlich, Fernández, Rodriguez-Pinto, Castilho, Corral Caridad, Goldsmith-Pestana, Saravia and McMahon-Pratt2017). Our data suggest that TvDNA pretreatment induces a sustained inflammatory response in infected female mice (Fig. 5B and C), thus we hypothesized that this sustained inflammatory response could affect parasite viability. To demonstrate our hypothesis, we evaluated the viability of T. vaginalis trophozoites in vaginal washes obtained from infected female mice that were pretreated or not with TvDNA using a fluorescence microscopy assay that discriminates live vs dead trophozoites. As shown in Fig. 6B, we observed an increasing number of nonviable parasites from 4 to 10 days post-infection in TvDNA pretreated mice compared to the TvDNA untreated and infected mice (Fig. 6A). Next, we quantified the viability of T. vaginalis recovered from vaginal washes in untreated and TvDNA pretreated mice. TvDNA pretreatment significantly decreased the viability of T. vaginalis at four days post-infection, with the most pronounced decrease at ten days post-infection. In contrast, the viability of trophozoites in untreated mice was not changed throughout the 10 days of infection (Fig. 6C). These findings suggest that TvDNA modulates the host response to favour the parasite elimination.
Effect of TvDNA pretreatment on parasite viability in infected mice. (A) Vaginal washes from untreated and infected mice collected at 4, 6 and 10 days post-infection. Scale bar, 20 µm. (B) Vaginal washes collected from infected mice pretreated with TvDNA at 4, 6 and 10 days post-infection. Scale bar 20 µm. Live trophozoites are stained in green, while dead trophozoites are stained in red. (C) Viability rate of parasites in vaginal washes from untreated (black bars) and TvDNA-pretreated (grey bars) mice. Data are representative of two independent experiments expressed as the mean ± s.d. Significance was determined by Kruskal–Wallis analysis and Dunn's test (n = 5 per group, *P < 0.1, **P < 0.01, ***P < 0.001).

TvDNA pretreatment induces a higher production of pro-inflammatory cytokine IL-6 during parasite infection in mice
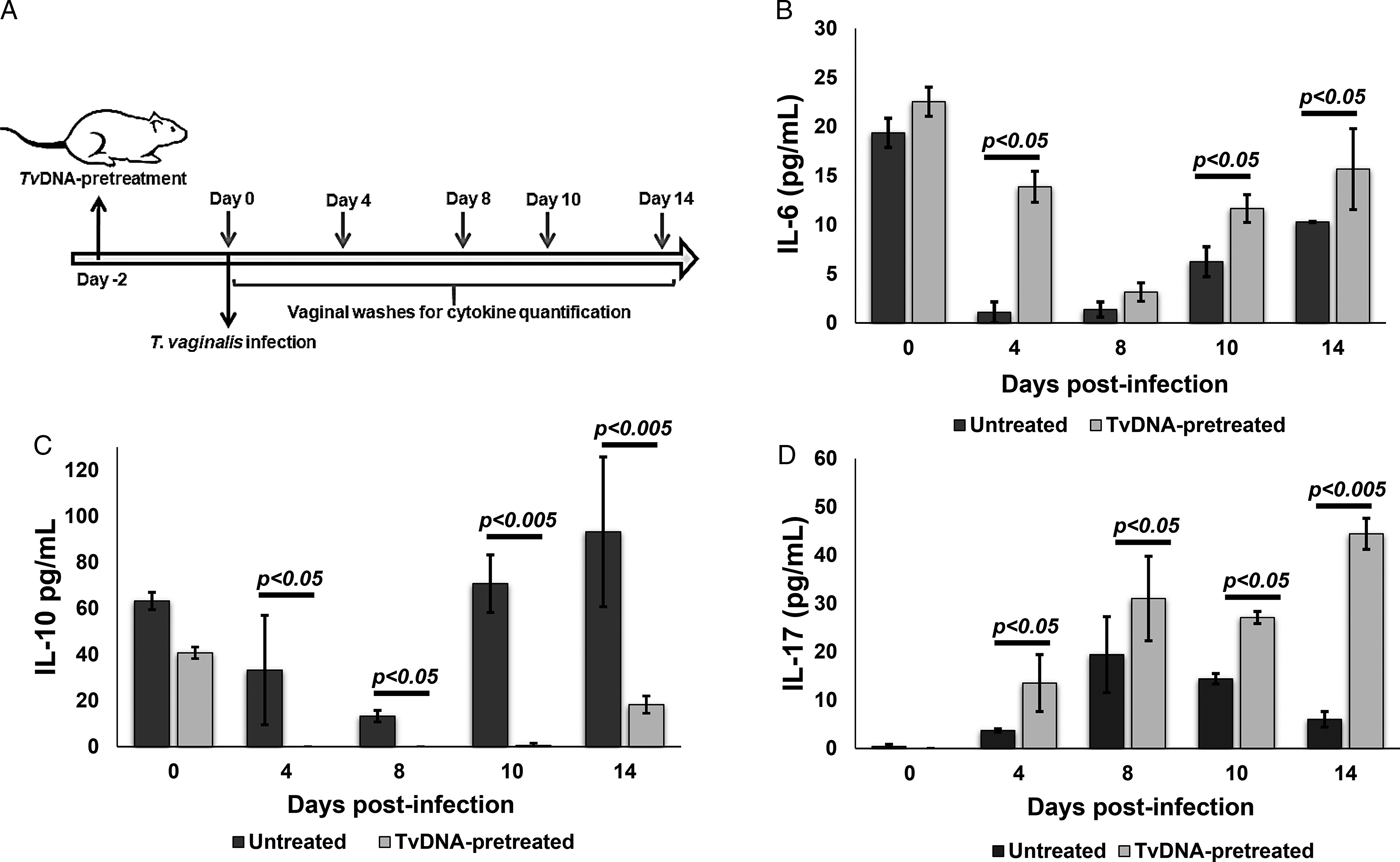
As shown in Fig. 5 we observed a sustained vulvar inflammation in mice pretreated with TvDNA and later infected with live trophozoites. Furthermore, we observed that T. vaginalis viability was significantly decreased by TvDNA pretreatment (Fig. 6). Thus, we hypothesized that these TvDNA-mediated events may be caused by a pro-inflammatory environment. To test this hypothesis we quantified IL-6, IL-10 and IL-17 cytokines in vaginal washes from mice untreated and pretreated with TvDNA and later infected with live trophozoites (Fig. 7A). Results from these measurements revealed significantly higher IL-6 levels from 4 to 14 days post-infection in TvDNA-pretreated mice compared to untreated ones (Fig. 7B). In striking contrast, IL-10 levels fell to undetectable levels at 4 to 10 days post-infection and only slightly rising after 14 days in TvDNA-pretreated mice (Fig. 7C). Interestingly, TvDNA-pretreated mice displayed significantly higher IL-17 cytokine production throughout the 14 days of infection compared to untreated but infected mice (Fig. 7D). Increased IL-17 levels are likely responsible for maintaining the inflammatory process in this condition. Taken together, these data indicate that TvDNA pretreatment promotes a pro-inflammatory environment that may contribute to decreasing the parasite viability to favour infection resolution.
Proinflammatory cytokine profile induced by TvDNA pretreatment on infected mice. (A) Female mice were TvDNA-pretreated or not, 2 days prior to being infected with live trophozoites. Vaginal washes were collected at 0, 4, 8, 10 and 14 days post-infection to quantify different cytokines. (B) IL-6, (C) IL-10 and (D) IL-17 levels in TvDNA-pretreated (grey bars) and untreated (black bars) mice infected with Tv were measured by ELISA at different days post-infection. Data were obtained from two independent experiments, with ten mice in total per evaluated condition. Graphs show the mean with standard error. Significance was determined by Kruskal–Wallis analysis and Dunn's test (n = 5 per group, **P < 0.05, ***P < 0.005).

Discussion
The mechanisms by which T. vaginalis establishes the infection and persist chronically in humans are still not completely elucidated. This is in spite of its ranking as first among STDs and its alarming association with an elevated risk of cervical and prostate cancers (Shui et al., Reference Shui, Kolb, Hanson, Sutcliffe, Rider and Stanford2016; Ghosh et al., Reference Ghosh, Muwonge, Mittal, Banerjee, Kundu, Mandal, Biswas and Basu2017). Trophozoites' adhesion to host cells is one of the first steps whereby T. vaginalis initiates the infection. This action triggers a cascade of events mediated by Pathogen-Associated Molecular Patterns (PAMPs) and the expression of compounds at the plasma membrane, including lipophosphoglycan (LPG) (Ryan et al., Reference Ryan, de Miguel and Johnson2011; Pasare, Reference Pasare2017) that contribute to the establishment of the parasite within the host. There is also a large body of evidence about PAMPs' ability to activate immune cells through nitric oxide, cytokine production and changes in the expression of some receptors on the surface of immune cells (Takeuchi and Akira, Reference Takeuchi and Akira2010; Kumar et al., Reference Kumar, Kawai and Akira2011; Broz and Monack, Reference Broz and Monack2013).
Previous studies have demonstrated an important immunostimulatory effect of CpG DNA motifs from microbes and parasites that induce both the maturation and activation of professional phagocytes (Shoda et al., Reference Shoda, Kegerreis, Suarez, Roditi, Corral, Bertot, Norimine and Brown2001; Ahmad-Nejad et al., Reference Ahmad-Nejad, Häcker, Rutz, Bauer, Vabulas and Wagner2002; Das et al., Reference Das, Ghosh, Singh, Saha, Ganguly and Das2015) as well as the promotion of a Th1 immune response (Krieg, Reference Krieg2000; Sabatel et al., Reference Sabatel, Radermecker, Fievez, Paulissen, Chakarov, Fernandes, Olivier, Toussaint, Pirottin, Xiao, Quatresooz, Sirard, Cataldo, Gillet, Bouabe, Desmet, Ginhoux, Marichal and Bureau2017) and T lymphocyte differentiation (Moseman et al., Reference Moseman, Liang, Dawson, Panoskaltsis-Mortari, Krieg, Liu, Blazar and Chen2004). Our study reveals TvDNA (a CpG DNA specific type) as a robust promoter of macrophages' proinflammatory profile (Figs 2, 3 and 4) that enables them to fight against the parasite (Fig. 6). That is, our data strongly suggest that TvDNA pretreatment can directly support the host in mounting an effective immune response. First, TvDNA induces a cytotoxic response by enhancing NO and ROS production in macrophages. Second, TvDNA promotes a substantial alteration on macrophages towards an M1 profile, inducing the expression of pro-inflammatory cytokines in addition to drastic morphological changes. Third, and most significant, TvDNA pretreatment has a prominent negative impact on parasite survival and an enhanced proinflammatory cytokine profile in our in vivo model of trichomoniasis. A potent adjuvant effect of CpG DNA has been previously reported on leishmaniasis, toxoplasmosis and trypanosomiasis (Zimmermann et al., Reference Zimmermann, Dalpke and Heeg2008; Rodríguez-Morales et al., Reference Rodríguez-Morales, Monteón-Padilla, Carrillo-Sánchez, Rios-Castro, Martínez-Cruz, Carabarin-Lima and Arce-Fonseca2015; Gong et al., Reference Gong, Cao, Guo, Dong, Yuan, Yao, Ren, Yao, Xu, Sun and Zhang2016) showing an important protective Th1 immune response in parasitic disease (Chu et al., Reference Chu, Targoni, Krieg, Lehmann and Harding1997; Zimmermann et al., Reference Zimmermann, Egeter, Hausmann, Lipford, Röcken, Wagner and Heeg1998; Ramirez et al., Reference Ramirez, Corvo, Duarte, Chávez-Fumagalli, Valadares, Santos, de Oliveira, Escutia, Alonso, Bonay, Tavares, Coelho and Soto2014). The transition of the immune response to a Th1 profile against a parasite like T. vaginalis, possibly induced by polarization of macrophages to an M1 profile, led our interest on CpG DNA to understand the specific mechanisms of an immune response that would favour the host (Abou Fakher et al., Reference Abou Fakher, Rachinel, Klimczak, Louis and Doyen2009). Thus, our data suggest that TvDNA could exert an adjuvant effect on at least one type of immune cells, improving macrophage function during T. vaginalis infection. The early effect of TvDNA on macrophages could trigger a strong response potentially able to change the outcome of the host–parasite interaction. Apart from the general adjuvant effect of CpG DNA, it has been shown that specific sequences present in each pathogen genome could promote the specificity of the host immune response (Gupta et al., Reference Gupta, Akhtar, Waye, Pandey, Pathak and Bajpai2015). Thus, there is a need to better understand the mechanisms regulating the response to CpG DNA from parasites such as trichomonas.
The transition of macrophages to M1 profile includes morphological changes that lead to the modulation of cytokines production by mechanisms still not well understood. McWhorter et al. (Reference McWhorter, Davis and Liu2015) have suggested that the lamellipodia formation could induce a new actin distribution pattern and showed that the macrophage plasticity is linked to its activation and function. It will be interesting to establish how cytoskeleton reorganization promotes macrophage polarization to achieve specific functional phenotypes and how these changes contribute to enhance the host response by decreasing trichomonas' viability.
In the present study, the lack of effect of TvDNA on vulvar oedema but the dramatic effect on trophozoite viability are opposite effects to those observed with T. vaginalis exosomal fractions (TvELV) in the pretreatment of infected mice which increased the IL-10 production, decreased the vulvar oedema and favoured the trophozoite viability in our murine infection model (Olmos-Ortiz et al., Reference Olmos-Ortiz, Barajas-Mendiola, Barrios-Rodiles, Castellano, Arias-Negrete, Avila and Cuéllar-Mata2017). Thus, it is possible that TvDNA induces macrophages to extend the proinflammatory response to prevent parasite population expansion in the host. The specific role of innate immune response in the host–parasite relationship during trichomoniasis is limited and requires further study. Overall, our work suggests that TvDNA is an immunomodulator that could redirect the result of the host–parasite interaction. Finally, TvDNA could be considered as a potential adjuvant for vaccine development against trichomoniasis.
Supplementary material
The supplementary material for this article can be found at https://doi.org/10.1017/S0031182019001094.
Acknowledgements
We thank Felipe Padilla-Vaca, PhD and Fernando Anaya-Velázquez, PhD for donating Tv GT-21 strain. We also thank Mayra C. Rodriguez for technical support.
Financial support
We are grateful to CONACyT, Mexico for a scholarship provided to MABM and for financial support (Project No. 0182671 CB-2012-01). We thank the University of Guanajuato for financial support (Project No. 139 CIIC 2018, project No. 977 CIIC 2016-2017).
Conflict of interest
The authors declare that they have no conflict of interest.
Ethical standards
Permission for this study was granted by the Ethics Committee of the University of Guanajuato. All procedures performed in studies involving animals were in accordance with the ethical standards of the institution or practice at which the studies were conducted.