





Introduction
The Mammoth Site of Hot Springs, South Dakota (USA), is located in the Black Hills, near the center of North America where southwestern South Dakota abuts Wyoming and Nebraska (Fig. 1). Although no evidence of glaciation exists for the Black Hills, the region is situated within 326 km (∼200 miles) of the Missouri River, which was the extent of the advances of the Laurentide Ice Sheet (Anderson et al., Reference Anderson, Holbrook and Goble2021). The discovery of the Mammoth Site (MS) in 1974 CE initiated an in-depth examination of the Quaternary record of the Black Hills area (Agenbroad and Mead, Reference Agenbroad and Mead1994). That work continues because of in situ preservation of large portions of the sinkhole that contain the remains of many Pleistocene mammoths as well as smaller fauna.
Ongoing refinement in our understanding of site chronology has broad research impacts, particularly for our understanding of biological responses to Quaternary environmental climate change. Previous attempts to directly date the locality were hampered by a lack of collagen in fossils. Radiocarbon age estimates of ∼26 cal ka BP are based on bioapatite assessments (Agenbroad and Mead, Reference Agenbroad and Mead1994) and were in direct conflict with a uranium-series (U-series) age of ∼129 ka that was produced from mammoth tooth enamel (Table 1). However, there is a unique capacity to continue to test previous hypotheses about the deposit because of the preservation of the locality as an in situ museum. Here, we test previous age inferences based on bone apatite radiocarbon and U-series with a new chronology based on infrared-stimulated luminescence (IRSL) of sinkhole sediments at the MS.
The MS is positioned at 1,088 m above mean sea level elevation, approximately 70 m above the present-day level of the Fall River (Fig. 1). The Fall River has preserved terraces on which the present-day town of Hot Springs was built. The MS deposit is a surface-exposed, filled breccia pipe sinkhole locality containing a large assemblage of mammoths (60+ individuals). Before the discovery and assessment of this remarkable locality, little was understood about the Late Pleistocene fauna of the Black Hills. As a result of research at the MS, additional regional exploration has revealed many caves and open-air sites that are useful for reconstructing the Late Pleistocene faunal assemblage and for understanding the impact of Quaternary climate change on the environments of the Black Hills and surrounding Northern Great Plains (e.g., Mead et al., Reference Mead, Manganaro, Repenning, Agenbroad, Stewart and Seymour1996; Morrison, Reference Morrison2000; Jass et al., Reference Jass, Mead, Morrison and Agenbroad2002). Robust temporal hypotheses for the MS are crucial to our understanding of how these subsequent discoveries do or do not overlap the record preserved at the MS.
Overview
Geological setting
The Black Hills are oval-shaped mountains that occupy about 15,540 km2 and cover an area of approximately 210 × 100 km. They are an uplift cored by Precambrian and Paleozoic rocks that radiate out, exposing younger strata at the edges of the dome, although detailed studies demonstrate a more complex record (Lufkin et al., Reference Lufkin, Redden, Lisenbee and Loomis2015). The southern Black Hills area surrounding Hot Springs is an anticlinal uplift constructed of Permian Opeche Shale, Permian Minnekahta Limestone, and Permian to Triassic Spearfish Formation (Wolcott, Reference Wolcott1967; Epstein and Doctor, Reference Epstein and Doctor2013; Mahan et al., Reference Mahan, Krolczyk and Mead2026). Where present at the ground surface in the southern Black Hills, the Spearfish Formation is a red silty bed with siltstone and gypsum in the lower member and weak shale and sandstone in the upper member. The unit is characterized by karst terrain, including sinkholes, that result from groundwater dissolution (Laury, Reference Laury1980; Epstein and Doctor, Reference Epstein and Doctor2013).
Lidar map of Hot Springs, South Dakota, with The Mammoth Site (MS) placement location. The Fall River runs through the center of Hot Springs following Hwy 385. The MS lies along Hwy 18 truck bypass.

Figure 1 Long description
Lidar map of Hot Springs, South Dakota, highlighting key locations. The map includes The Mammoth Site, marked with a red dot and several terrace sample sites labeled as T3 and T2 Terrace Samples and T2 Terrace Sample, also marked with red dots. The Modern Fall River Site is similarly marked. The Fall River runs through the center, following US HWY 18, with an ephemeral stream indicated by a dashed line. Major roads, SD HWY 71 and US HWY 18, are shown. A scale bar indicates distances of 500 meters and 1 kilometer. An inset map of the United States highlights the location of South Dakota.
Sinkholes are abundant in the northern Black Hills due to the solution and removal of gypsum and anhydrite in the Pennsylvanian Minnelusa Formation, which lead to the development of breccia pipes (Epstein and Doctor, Reference Epstein and Doctor2013) that propagate upward through the Opeche Shale and Minnekata Limestone and into the Spearfish Formation. These sinkholes also occur in the southern Black Hills as collapse features that have steepened and widened resulting from incision of the Cheyenne River and Fall River as well as groundwater base-level changes. The collapse over a solution breccia pipe, aided by warm groundwater, formed the basic structure of the MS sinkhole (Laury, Reference Laury1980; Fig. 2). As these breccia pipes collapsed, they produced numerous steep-walled sinkholes ranging in diameter from 1–2 m to as much as 140 m across and 18 m deep (e.g., the Vore Buffalo Jump; Epstein and Doctor, Reference Epstein and Doctor2013). The breccia pipes provide a chimney-like opening for warm artesian spring waters to percolate upward through the pipe as was the case at the MS bone bed.
Regional groundwater from rain and snow melt originating from the greater Yellowstone region (Wyoming and Montana) is hypothesized to have traveled via the Mississippian Madison Limestone (called the Pahasapa Limestone in the Black Hills) aquifer deep into the subsurface along underground fault systems into eastern Wyoming and western South Dakota (Lund, Reference Lund1997). The initial water is thought to be heated by the Yellowstone hotspot, with recharge water entering mainly from the Big Horn and Laramie Mountains of Wyoming and the Black Hills of western South Dakota. Groundwater rises to the surface, following fault plumbing in a greater volume to the south at Hot Springs (Lund, Reference Lund1997). In the present-day town of Hot Springs, more than 102 warm springs are known with temperatures that range between 27°C and 33°C (Laury, Reference Laury1980; Lund, Reference Lund1997), although studies of MS fauna and flora suggest the spring was warmer by 2°C to 3°C when active (32–35°C; Agenbroad, Reference Agenbroad, Agenbroad and Mead1994a).
Chronology of The Mammoth Site of Hot Springs and Fall River terraces (South Dakota) before 2026 CE.a

Table 1 Long description
Chronology entries list lab numbers, sampled material, and paired ages: conventional radiocarbon ages and calibrated calendar ages in thousands of years before present, plus a separate section of non-radiocarbon dates. Mammoth Site samples include composite bone apatite, bone apatite, bone carbonate, apatite, and heated apatite, with calibrated ages spanning about 23.25 to 41.61 thousand years BP. The oldest calibrated radiocarbon result is SMU-837 bone carbonate at about 41.61 thousand years BP, while the youngest is SMU-865 heated apatite at about 23.25 thousand years BP. Several apatite-based results cluster near 25 to 31 thousand years BP, including GX-5356A around 25.14 and SMU-838 around 30.77 thousand years BP. A Fall River Terrace T2 bulk sediment sample yields a calibrated age near 24.99 thousand years BP, similar to the younger Mammoth Site radiocarbon ages. The “other chronology” section reports much older ages from different methods: mammoth tooth enamel dated by uranium-series at roughly 129 thousand years BP and 150 plus or minus 10 thousand years BP, and Phase II west sediment dated by thermoluminescence at 101 plus or minus 10 thousand years BP. Because the table mixes radiocarbon with uranium-series and thermoluminescence results on different materials, the older non-radiocarbon ages are not directly comparable to the calibrated radiocarbon ages.
a Radiocarbon ages were calibrated using Calib 8.20 with INTCAL20 (Reimer et al., Reference Reimer, Austin, Bard, Bayliss, Blackwell, Bronk Ramsey and Butzin2020). All dates were obtained on Phase II sediments, except GX-5356A.
b Reported in Laury (1980).
c Previously dated by Morrison (2000): calibrated radiocarbon ages on black organic layer.
Site map with optically stimulated luminescence (OSL) OSL sampling localities (map view). Warm colors (red, orange, yellow) represent shallower excavations and cooler colors (greens and blues) represent deeper excavations.

Figure 2 Long description
Map of The Mammoth Site in Hot Springs, SD, displaying optically stimulated luminescence (OSL) sampling localities marked as MS-16-1 to MS-16-7. The map uses a gradient to represent excavation depths, with warm colors indicating shallower areas and cooler colors indicating deeper areas. The sampling points are distributed across the site, with MS-16-1 and MS-16-2 located in the southwestern section and MS-16-3 to MS-16-7 extending towards the northeastern section. A scale bar at the bottom indicates distances in meters, ranging from 0 to 40 meters. A compass rose in the top left corner indicates cardinal directions.
Although the MS is currently a filled-in sinkhole, the breccia pipe bottom is thrust up through the red shales of the Spearfish Formation, which can be seen forming the sinkhole walls at the surface. The sinkhole is spoon-shaped with the deepest end at the northeast (Laury, Reference Laury, Agenbroad and Mead1994; Fig. 2), which also contains the main spring conduit. After the MS sinkhole filled in, sediments were cemented and therefore resisted erosion. The MS is readily apparent on the 1967 CE geologic map as a 3- to 6-m-high hill of Qftg (Quaternary fluvial terrace gravels; Braddock, Reference Braddock1963; Wolcott, Reference Wolcott1967). The sinkhole was mapped within an older Fall River terrace by Kempton and Laury (Reference Laury, Agenbroad and Mead1994) as their Terrace 4 (T4) and these terrace gravels are present in the lower sediments of the MS. Kempton and Laury (Reference Laury, Agenbroad and Mead1994) indicated that the Fall River had already abandoned T4 before the formation of the MS sinkhole, reasoning that the delicate pond sediments present would have been precluded by coarse gravels and cobbles carried by the Fall River in its bed load if the terrace had still been at the Fall River baseline.
The MS sinkhole measures 25 × 50 m wide. The depression was originally 14 m deep at the southwestern end and at least 21 m deep at the northeastern end based on borehole data from the South Dakota Geological Survey (Fig. 2). Excavation before scientific investigations removed the upper portion of the terrace fill (3–6 m thick at the time). An additional 10–15 m have been disturbed for paleontological study (see details in Agenbroad, Reference Agenbroad, Agenbroad and Mead1994a; Laury, Reference Laury, Agenbroad and Mead1994). The upper layers record the end of deposition within the sinkhole, showing evidence of drying, cementation of sediments, and infilling. The sinkhole is now enclosed in a building, where 6 to 9 m of a probable 14 m of silty, thin lacustrine layers are exposed (Laury, Reference Laury, Agenbroad and Mead1994; Phase II) and were sampled for luminescence dating (Fig. 3). The deeper bottom third of sediments await further borehole drilling for a more complete analysis of the stratigraphic composition, character, ages, and definition of the base of the sinkhole.
Stratigraphic section with geological units labeled and locations of significant bone finds. Optically stimulated luminescence (OSL) sample locations highlighted in (A) vertical sections and (B) complete head-on view with approximations of the current preserved sediment. Note that the sinkhole walls dip quite steeply (none less than 60°), and this is reflected in the sediment dip (30° to 20° near walls but essentially flat lying in the center of the sinkhole).

Figure 3 Long description
The image consists of two parts labeled A and B. In part A, three stratigraphic columns are depicted, each representing different sections of a geological site. Column 1, labeled Southwest, shows a vertical section from 0 to 1.5 meters with layers of silt, sand and coarse material. Fossils and ripples are marked, with optically stimulated luminescence (OSL) sample locations indicated at depths of 159 plus or minus 21 thousand years and 172 plus or minus 25 thousand years. Column 2, labeled Middle, extends from 0 to 5 meters, also showing silt, sand and coarse layers, with fossils and OSL samples at 196 plus or minus 17 thousand years, 205 plus or minus 10 thousand years, 131 plus or minus 13 thousand years and 170 plus or minus 10 thousand years. Column 3, labeled Northeast, ranges from 0 to 0.75 meters, with a single OSL sample at 232 plus or minus 23 thousand years. The legend identifies symbols for fossils, ripples, gypsum veins, deformed layers and OSL sample locations. Part B shows a cross-sectional view of the site with labeled columns and OSL sample points MS-16-1 to MS-16-7, illustrating the topography and sediment layers across the site.
Regional sinkhole formation, geomorphology, and stratigraphy
The Fall River runs through the town of Hot Springs and flow originates from artesian springs located along the incised Hot Brook/Fall River drainage immediately north of and within the town of Hot Springs (Fig. 1). Multiple, detailed studies of the six to eight fluvial terrace sequences of the Fall River drainage, including the area of confluence with the Cheyenne River, have been chronologically tied directly to the MS and its previously accepted age assignment of 42 to 23 cal ka BP (Kempton, Reference Kempton1980; Laury, Reference Laury1980; Straffin, Reference Straffin1993; Kempton and Laury, Reference Laury, Agenbroad and Mead1994; Table 1).
Within the sinkhole deposits at the MS, two recognizable but currently defunct spring orifices or conduits are present; others may have existed (see position of conduits in Laury, Reference Laury1980; Fig. 2). The larger of these conduits was almost certainly the more vigorous of the two, and its presence impacted the nature of the sedimentary facies over much of the pond, including the presence of plastically deformed strata via abrasion against the turbulent flow, slump masses, mammoth footprints, and small-scale faulting, which can be seen in the immediate vicinity of the spring conduit (Laury, Reference Laury1980).
The sinkhole walls are steeply dipping (anywhere from 30° to near 90°) and show that sinkhole fill sediments overlie terrace gravels that cap the Spearfish Formation (Laury, Reference Laury1980; Fig. 3). The primary sedimentary input contributing to the filling of the sinkhole was likely from periodic episodes of water moving through terrace gravels (surface runoff) or slumping caused by mammoth bioturbation. However, there are no indications of turbulent inflow of sediments other than that disturbed by inflow through the spring conduit. These laminated lacustrine sediments, many of which contain mammoth and other vertebrate and invertebrate remains (Laury, Reference Laury1980, Reference Laury, Agenbroad and Mead1994; Agenbroad, Reference Agenbroad, Agenbroad and Mead1994a, Reference Agenbroad, Agenbroad and Mead1994b), were divided into three gradational phases of sedimentation, which Laury (Reference Laury1980) named Phase I (oldest), Phase II (quiet water silt laminae), and Phase III (youngest drying up and cementing). His last phase (III) corresponds to the top 3 m of the sinkhole fill that has been lost due to excavation.
Phase I includes the lowermost of the sinkhole sediments, characterized by gravels and sand/silt that were deposited following the sinkhole collapse, and their overall depth is unknown. These sediments consist of talus gravels that are texturally similar to the fill of the Fall River T4 (Kempton and Laury, Reference Laury, Agenbroad and Mead1994). The reddish-brown gravels grade upward and laterally into gray, fine-grained, and stratified clayey silt and silty sand but overall comprise the lowest approximately 5 m (one-third) of the total sinkhole sediment thickness. Laury (Reference Laury1980) speculated that this phase marked rapid accumulation with substantial bioturbation from mammoths due to the material’s low cohesive properties coupled with the steepness of the sinkhole slopes.
Phase II sediments accumulated more slowly and are largely undisturbed, except near the main spring conduit. These sediments are rhythmic, thinly laminated silts and sands, and probably encapsulate more time in transportation and deposition relative to the underlying materials. The sediments accumulated by sheet flow and graded dilutions emanating from the main conduit accumulating to a fill of ∼6 m. Water depths are estimated to be a relatively constant 4 to 5 m (Agenbroad, Reference Agenbroad, Agenbroad and Mead1994a) and mammoths were intermittently trapped throughout this phase and possibly Phase I but not during Phase III.
Phase III sediments occupy a smaller area of the sinkhole and are the least steeply dipping. An estimated 3 m of material was deposited as very thin light/dark and clay-rich couplets. The light/dark phases were not the result of seasonal depositional cycles, but likely from shallowing at the pond margin and associated sediment starvation (i.e., pond-margin runoff events, slumping, or random muddying). An additional 3 m of sediments were naturally eroded from the upper portion of this unit, and the remainder was scraped and lost during discovery of the site. Laury (Reference Laury1980) did note that a subaerially exposed colluvial deposit marks the transition from lacustrine to terrestrial sediments within the Phase III sediments. Extensive mammoth trampling and lack of any trapped megafauna indicate the sinkhole had filled significantly and become a shallow pond with easy entrance and egress (Laury, Reference Laury1980). These sediments were eventually cemented with calcium carbonate and magnesium sulfate.
MS historical discovery and significance
In 1974 CE, a hill on the southwest side of Hot Springs was slated to be removed for a housing development when mammoth tusks were discovered. That summer, Larry D. Agenbroad (deceased) and Jim I. Mead assessed the site and began the recovery of mammoth remains. Excavation seasons from 1974 through 1983 CE were purely exploratory in nature (Agenbroad, Reference Agenbroad, Agenbroad and Mead1994b). They found that the MS is predominantly a Mammuthus-selective natural trap sinkhole (Agenbroad, Reference Agenbroad, Agenbroad and Mead1994b) and represents the largest, extensively studied, Late Pleistocene faunal assemblage in the Black Hills. The mammalian species most commonly recovered from the locality is the Columbian mammoth (Mammuthus columbi); more than 60 individuals have been discovered as of 2026 CE (based on tusk count). Interestingly, all the mammoths trapped at the site appear to be males, and most represent younger individuals. Also recovered are a number of skeletal elements of smaller megafauna including a skull and dentaries of the short-faced bear (Arctodus simus) and remains of an extinct camel (Camelops sp.), a possible shrub ox (cf. Euceratherium collinum), a coyote (Canis latrans), and a gray wolf (Canis lupus); but no other remains are as numerous or significant as those of the mammoths (Czaplewski and Mead, Reference Czaplewski, Mead, Agenbroad and Mead1994; Mead and Agenbroad, Reference Mead, Agenbroad, Agenbroad and Mead1994; Mead et al., Reference Mead, Hevly, Agenbroad, Agenbroad and Mead1994; Jass et al., Reference Jass, Mead, Morrison and Agenbroad2002).
The MS is currently an active paleontological dig site and museum, with the bone bed nearly fully enclosed in situ within the museum. The entire sinkhole is housed under an expansive roof that can allow access for future drilling or excavation (Fig. 3). The current level of excavation permits viewing of sediments from Phases I and II and provides opportunities for additional research as well as an in situ exhibit for public education. Excavations through the bone bed vary in depth across the extent of the site, but large unexcavated areas remain to be evaluated (Fig. 2). This museum contains the largest concentration of Columbian mammoth remains in North America. The bone bed deposit is unusual in that entrapment occurred while mammals were alive. Like most Pleistocene vertebrate remains in North America, the bone is not petrified. Because of the paleontological importance of the locality, and because the bone bed site and its age are used to provide an overall understanding of the Quaternary geological sequences associated with the region and the Fall River terraces, the MS must have an accurate age assignment.
MS chronology before 2016 CE
Radiocarbon dating results
Several previous studies attempted to date the sinkhole sediments. The bulk of this work was assessed through 14C dating of bone apatite materials from mammoth and other bone specimens recovered from the sinkhole (Agenbroad, Reference Agenbroad, Agenbroad and Mead1994a; Table 1). A total of six calibrated 14C ages collected from the site range from 42.1 ± 0.74 cal ka BP to 23.25 ± 1.78 cal ka BP, with all six of the ages falling between 42.8 and 21.5 cal ka BP. Five of these ages were measured on bone apatite, one age was analyzed on bone carbonate. Only one sample (GX-5356A) came from younger Phase III sediments, all others were from Phase II sediments (Table 1).
Before 2016 CE, these assessments were assumed to be the most reliable age control for the MS, given the fact that the ages were consistent however scarce. Although it has been conclusively demonstrated that reliable radiocarbon ages can be obtained from various constituents of bone organic matter, it has also been shown that this is only true for bone from environments that favor organic preservation (Stafford et al., Reference Stafford, Jull, Brendel, Duhamel and Donahue1987, Reference Stafford, Hare, Currie, Jull and Donahue1991; Holliday et al., Reference Holliday, Johnson and Stafford1999). Where collagen is not well preserved, bone remains cannot be accurately dated. Bone apatite has frequently been shown to be an unreliable dating material in lacustrine sediments, owing to diagenetic recrystallization of bone crystallites, which can generate younger than expected ages (Hassan et al., Reference Hassan, Termine and Haynes1977; Zazzo and Saliege, Reference Zazzo and Saliege2011). Agenbroad (Reference Agenbroad, Agenbroad and Mead1994b) noted the lack of bone collagen (and consequently the amino acid hydroxyproline) from all dated bone samples; this suggests some diagenetic alteration of the organic bone sampled in Phase II strata.
U-series and luminescence dating results
At least two attempts were made to date faunal material from the MS using U-series dating methods (McKinney, Reference McKinney2010). The first date (128.965 ka with no error given; Table 1) was produced from mammoth tooth enamel in 1994 CE. The age was initially reported by Agenbroad (Reference Agenbroad, Agenbroad and Mead1994b) but was considered unreliable. This position is consistent with assertions by Szabo et al. (Reference Szabo, Malde and Irwin-Williams1969) and others who stated that it is possible for bone to act as a closed system with regard to U-series if the tests of the subsequent daughter product ratios (i.e., Th, Pa, Po, Ra, Rn, Pb) also remain consistent. A second age of 150 ± 10 ka was reported in 2010 CE (McKinney, Reference McKinney2010; Table 1), but details on the sample are not available. No other data have been reported to corroborate the requirement of U-series equilibrium in the samples that were analyzed, so the validity of these dates remains in question.
Thermoluminescence (TL) dating of upper Phase II sediments in the western portion of the MS was conducted by Agenbroad (Reference Agenbroad, Agenbroad and Mead1994b), although not thoroughly discussed. TL is the heating of sediment grains to activate a stored luminescence signal instead of through light activation as is used in optically stimulated luminescence (OSL). Although details on this age are unknown, an age of 101 ± 10 ka is in the archives (Table 1). Therefore, the utility of luminescence methods for dating sediments at the MS remained largely untested but intriguing. Given the uncertainty around the reliability of 14C, TL, and U-series analyses and especially the significant gap between the ∼150–100 ka and 43–21.5 cal ka BP dates, a new attempt at dating the MS was undertaken, again using luminescence.
The main questions about the chronology of the MS site are outlined here: (1) Which previous ages obtained on the mammoth bones are reliable? (2) How old are the sediments that the mammoth bones are buried in, and do they correspond to regional climatic events? (3) How reliable are our new ages with respect to typical luminescence assumptions (i.e., well-bleached transport path, moisture content of the sediment, warm spring water disequilibrium of the U:Th ratio in the sediments, postdepositional processes of gypsum precipitation, cementation, and/or bioturbation)? (4) How long did the sinkhole stay open?
Methods
Luminescence dating
Luminescence dating is a type of radiation exposure dating that determines the age of sediment grains based on their last exposure to light or intense heat (>450°C). When a mineral is exposed to naturally occurring radiation, electrons accumulate at defects within the crystal lattice, or “electron traps.” Exposure to light will free electrons from light-sensitive traps, a process referred to as bleaching. Ideally, all sediment grains will be reset during transportation at the time of deposition (Duller, Reference Duller2008; Rhodes, Reference Rhodes2011; Mahan and DeWitt, Reference Mahan, DeWitt and Bateman2019) and thus can be utilized to determine the amount of time that has passed since sediment was last exposed to light. However, partial bleaching may occur where a remnant signal exists after incomplete exposure to sunlight before burial. Partial bleaching can result from transport at night, under cloudy conditions, or in turbid water (Godfrey-Smith et al., Reference Godfrey-Smith, Huntley and Chen1988), resulting in age overestimation. Quartz grains bleach very rapidly, with a reduction of 99% in 10 seconds of direct sunlight, while feldspars show no remnant luminescence signal after 5–10 minutes of direct sunlight if measuring the more easily bleached IR 50°C signal (Godfrey-Smith et al., Reference Godfrey-Smith, Huntley and Chen1988).
Luminescence dating can be employed in a variety of terrestrial stratigraphic settings, can be used to date sediments from 700 ka to 0.1 ka (<700,000 years to 100 years old), and is particularly useful for sediments that receive at least brief (∼40–120 seconds) exposure to sunlight before deposition (Lian and Roberts, Reference Lian and Roberts2006; Duller, Reference Duller2008; Rhodes, Reference Rhodes2011). Quartz is preferred over feldspar if the deposit has had limited exposure to sunlight and is not older than ∼150 ka (Mahan et al., Reference Mahan, Rittenour, Nelson, Ataee, Brown, DeWitt and Durcan2023).
Several sources of uncertainty can impact the accuracy of luminescence dating. The most common problem is related to partial bleaching. Laboratory protocols can minimize partial bleaching issues, and modeling can also be utilized for best-case scenarios of the most reliable minerals, traps, storage, and components of the equivalent dose (given in Gy). Complications also exist in the calculation of the environmental dose rate or the low-level radiation that is emitted from the surrounding sediments (given in Gy/ka). There are two main sources of error for accurately estimating a sample’s environmental dose rate. The first includes accurately estimating the long-term water content as water absorbs a portion of the environmental dose rate. Water table fluctuations, wet and dry cycles, and compaction and cementation produce uncertainty in luminescence ages. The second, disequilibrium in the U-series decay chain, can result in an underestimation of the portion of the dose rate derived from uranium and its daughters (Aitken, Reference Aitken1985; Guerin et al., Reference Guerin, Mercier, Nathan, Adamiec and Lefrais2012). To minimize the impact of these uncertainties it is preferable that luminescence samples come from a relatively homogeneous stratigraphic unit that is at least 30 cm thick, and has not undergone significant bioturbation, water content variations, or diagenetic changes following burial (Lian and Roberts, Reference Lian and Roberts2006; Duller, Reference Duller2008; Rhodes, Reference Rhodes2011).
Luminescence data and ages from quartz optically stimulated luminescence (OSL) and feldspar post-infrared infrared-stimulated luminescence (pIRIR).

Table 2 Long description
Quartz OSL and feldspar pIRIR results are listed for sinkhole sediments at the Mammoth Site Museum and for Fall River terrace sediments, including water content, potassium, uranium, thorium, total dose rate, equivalent dose, replicate counts, over-dispersion, age, and a permissible age range. Mammoth Site samples MS-16-1 through MS-16-6 yield ages mainly in the mid to high hundreds of thousands of years, from about 131 to 232 thousand years, with MS-16-6 also reporting a minimum-age feldspar result above about 172 thousand years. Within the sinkhole set, MS-16-4 is the youngest at about 131 thousand years, while MS-16-6 is the oldest quartz age at about 232 thousand years; most over-dispersion values are low, suggesting consistent equivalent-dose distributions. Fall River terrace samples are much younger: Modern T0 is about 1 thousand years by quartz, while T2-16-1 is about 36 thousand years, T2-20-2/3 about 22 thousand years, and T3-20-1 about 67 thousand years. Several terrace entries show higher over-dispersion, including Modern T0 and T2-20-2/3, indicating more scatter that can reflect incomplete bleaching or mixed grains. Some samples include paired quartz and feldspar entries, and one terrace feldspar age for Modern T0 is notably lower than the quartz age, so mineral-specific behavior and model choice should be considered when comparing ages.
a Field moisture, with figures in parentheses indicating the complete sample saturation %. Ages calculated using 50% of the saturated moisture: i.e., 1 (48) = 48 * 0.5 = 24% for moisture value.
b Analyses obtained using inductively-coupled plasma optical emission spectrometry (ICP-OES) when possible; if not, results obtained using high-precision germanium (HPGe) gamma spectrometry. See “Methods” and Supplementary Material for details. MS-16-5 values for dose rate are average of all MS samples.
c Includes cosmic doses and attenuation with depth calculated using the methods of Prescott and Hutton (1994). Cosmic doses were around 0.11–0.34 Gy/ka.
d Number of replicated equivalent dose (DE) estimates used to calculate the total DE. Figures in parentheses indicate total number of measurements included in calculations.
Numbers before parentheses represented DE used for models: the central age model (CAM), except for the minimum age model (MAM) on the modern T0 and T3-20-1.
e Defined as “overdispersion” of the DE values. Obtained by the R radial plot program. Values >30% are considered to be poorly bleached or mixed sediments.
f Age for fine-grained 250–90 microns K-feldspar, post-IR IRSL (pIRIR) at 230°C; fade measured with details in Table 3. Exponential + linear fit used on DE, errors to 2-sigma.
g Sample MS-16-2 was collected by P. Hanson of University of Nebraska–Lincoln but analyzed by S. Mahan of U.S. Geological Survey.
h Age for fine-grained 250–90 microns quartz; MS-16-6 is thermal transfer OSL (TT-OSL) and is a minimum age only. Exponential + linear fit used on DE, errors to 2-sigma.
We collected a total of 10 samples for luminescence dating (Table 2). These include samples taken from the upper portions of Phase I and Phase II deposits at the MS as well as a nearby terrace (T3 or T2) to represent Phase III sediments (T2-16-1; see later discussion). We collected a total of six luminescence samples from a 6 m exposure of Phase II sediments from the bone bed in 2016 CE. These samples include sediments exposed at varying depths within the bone bed, ranging from upper exposed sediments (Fig. 4a) to material adjacent to mammoth tusks and skulls (Fig. 4b), as well as blocks of laminated sediment from deeper within the sinkhole (Fig. 4c). These samples span deposition of upper Phase I and most of Phase II, which constitute ∼90% of the stratigraphic column at the site (Fig. 3b). One sample was collected from younger materials in a previously documented Fall River terrace location to test the bleaching conditions in this depositional setting (Morrison, Reference Morrison2000; Fig. 4d). A sample from the modern Fall River channel was obtained, as well as two additional terrace samples that were collected between the MS and Morrison’s (Reference Morrison2000) previously documented site (Fig. 1) for a total of four non-sinkhole samples. We also collected a sample for geochemistry near the main spring conduit (MS-16-6; Fig. 2) but did not date the sample due to disequilibrium concerns.
The 10 samples for luminescence dating were collected using a variety of methods. After excavating back ∼10 cm into the exposure, we obtained the samples using a mechanical saw to cut a block of material (MS-16-2; Fig. 4a), a chisel to cut an intact block measuring 30 cm × 30 cm (MS-16-3; Fig. 4c), or a PVC or metal sample tube able to encase an ∼500 g sediment sample (T2-16-1; Fig. 4d). Samples were collected, removed, and capped under the cover of a black, opaque cloth to prevent light contamination and then stored in a heavy, light-tight black photography bag for transport to the U.S. Geological Survey (USGS) luminescence laboratory in Denver, Colorado, or the University of Nebraska–Lincoln (UNL) luminescence laboratory. Duplicate samples were taken at one location (MS-16-3a [USGS] and MS-16-3b [UNL]) (Fig. 4c; Table 2), while in another location, the UNL laboratory took a separate sample for independent analyses (sample MS-16-5). Four alluvial samples were collected for comparison, including two samples on the Fall River T2 (T2-16-1; T2-20-2/3) using PVC and a dark cloth (Fig. 4c and 4d; Laury’s T2 or T3 terrace), a sample from T3, and a sample from the present modern channel of the Fall River (T0). We used black film canisters and scooped a sample from a shallow underwater point bar during the daytime for our modern Fall River sample (Table 2).
Photographs of selected optically stimulated luminescence (OSL) sampling procedures and locations. Photographs courtesy of Sandy Swift. (A) Southwest corner sampling of MS-16-2 (by Paul Hanson and the “Sawzall”). (B) The center of the sinkhole has thin laminated sediments and extensive bone galleries. We sampled near here for MS-16-4 and MS-16-5 using metal tubes. (C) Duplicative MS-16-3 sampling efforts in the center of the sinkhole. A dark cloth was employed to reduce exposure in case the dried out sediments cracked in the blocks being sampled. The middle of the sinkhole is relatively void of bones. (D) Jim Mead sampling with PVC tube at the T2-16-1 site. The paludual sediments are distinctly greenish in color as opposed to the overlying alluvium of the terrace that has been tinted red by the Spearfish Formation.

OSL laboratory techniques
Determining the equivalent dose (DE)
Samples were processed at either the USGS or UNL laboratories using similar protocols following methods established by Mahan et al. (Reference Mahan, Rittenour, Nelson, Ataee, Brown, DeWitt and Durcan2023). The systematics of quartz OSL and IRSL techniques are well known (Thomsen et al., Reference Thomsen, Murray, Jain and Bøtter-Jensen2008; Steffan et al., Reference Steffan, Preusser and Schlunegger2009; Buylaert et al., Reference Buylaert, Huot, Murray and Van den haute2011). All luminescence measurements were made on Risø readers, DA 20 TL/OSL for UNL and USGS as well as a DA 15 TL/OSL (with upgrades) for USGS. Details on specific protocols and instrument configurations for the post-IR IRSL (pIRIR) at 230°C are in the Supplementary Data (see Supplementary Tables S1–S4).
Both laboratories initially attempted to date the sediments using OSL on quartz, but each of the samples we collected from the MS had saturated luminescence traps. We opted to analyze the feldspar, which can be used to date older sediments, and we chose to use the pIRIR protocol, as its use typically limits the impacts of anomalous fading. All samples were analyzed using continuous wave stimulation, and we analyzed up to 27 aliquots that held between 25 and 50 grains for each sample. Preheat temperatures for each sample were based on standard tests. A high proportion of grains (estimated at 20–45%) gave useful signals allowing DE estimation; however, we assume that the IRSL signals measured in multiple-grain studies are dominated by an unknown small number of the brightest grains, as shown in Rhodes (Reference Rhodes2015).
We rejected aliquots using commonly used criteria (Wintle and Murray, Reference Wintle and Murray2006). We accepted data that presented “recycle” ratios within 10% of 1.0 (Ballarini et al., Reference Ballarini, Wallinga, Wintle and Bos2007) and “recuperation” ratios (Aitken, Reference Aitken1998) within 2% of zero when recuperation was >20% of the normalized “natural” signal (Lx/Tx ratio), and test dose–signal errors that were ∼15%. We forced dose–response curves through the origin, and growth curves were fit to an exponential or an exponential + linear trend. Measurement parameters can be found in Mahan et al. (Reference Mahan, Krolczyk and Mead2026), with further details in the Supplementary Tables and Supplementary Figs. S1–S11. Modeling of the resultant DE into ages was performed using Galbraith et al. (Reference Galbraith, Roberts, Laslett, Yoshida and Olley1999) and Galbraith and Roberts (Reference Galbraith and Roberts2012) functions for the central age model (CAM) and minimum age model (MAM) using the R/calc_central dose software of Burow (Reference Burow2025).
Compared with quartz for OSL dating, feldspars can be more problematic due to anomalous fading, in which electrons leak from luminescence traps (Duller, Reference Duller2008). Anomalous fading and bioturbation can both cause age underestimation. Although we report three differing luminescence measurements—quartz OSL, quartz thermal-transfer OSL (MS-16-6), and pIRIR ages on potassium feldspar—we use only the pIRIR ages for dating sediments in the sinkhole.
Both labs followed the Kars et al. (Reference Kars, Busschers and Wallinga2012) 230°C pIRIR protocol when producing DE for fine-grained potassium feldspars, because the conventional IR50 protocol produced large fading values (7.5–5%/decade). As stated earlier, in direct comparison with identical light exposure conditions, potassium feldspar IRSL signals are reduced by light more slowly than the fast-component OSL signal of quartz grains (both in nature and in the lab) from the same sediment samples, and they also have decays that may not be well suited to an exponential fit (Rhodes, Reference Rhodes2015). We accepted these characteristics because we felt we could modify procedures if needed and because the feldspar grains were clearly the best choice to date a site that was older than anticipated.
We identified a small (1.65–1.2%/decade) but persistent fading rate on many samples using the pIR IRSL230 (Huntley and Lamothe, Reference Huntley and Lamothe2001; Auclair et al., Reference Auclair, Lamothe and Huot2003). Buylaert et al. (Reference Buylaert, Jain, Murray, Thomsen, Thiel and Sohbati2012) reported similar fading rates to those we measured (1.5–1%/decade) but opted not to correct their ages. They argued that it was possible that these apparent laboratory fading rates were a measurement artifact, perhaps associated with uncorrected sensitivity change, while Auclair et al. (Reference Auclair, Lamothe and Huot2003) noted their fading corrections only applied to the linear portion of the measurements (the last 25 ka), which is outside the age range of these samples. We note that Kars et al. (Reference Kars, Wallinga and Cohen2008) presented a simulation method to overcome this in older samples, but the model was insensitive to small variations in the dose rate. We compare ages both with and without fading corrections and for dose rate disequilibrium (discussed later) in Table 3.
Feldspar ages shown with two adjustments: one is to the equivalent dose (DE) for anomalous fading, and one is to the dose rate (DR) for open-system disequilibrium behavior (each step is cumulative).

Table 3 Long description
Feldspar and one quartz sample are listed with ages in thousands of years for three calculation approaches: closed-system, then a fading-corrected equivalent dose age, then an open-system dose-rate adjusted age. Across most feldspar samples, applying the fading correction increases the age by roughly 8 to 18 ka compared with the closed-system value. Applying the open-system dose-rate adjustment typically brings the age back down toward, or slightly below, the closed-system age. The oldest feldspar sample is MS-16-6 at 232 ka closed-system, 250 ka with fading correction, and 234 ka with open-system adjustment. The youngest feldspar sample is T2-20-2/3 at 22.4 ka closed-system, 24.2 ka with fading correction, and 23.1 ka with open-system adjustment. For the Morrison locality sample T2-16-1, the feldspar age shifts from 35.8 ka closed-system to 40.0 ka with fading correction, then down to 31.8 ka with open-system adjustment; the paired quartz entry has no fading-corrected value and changes from 32.3 ka to 27.3 ka with the open-system adjustment. Uncertainties are reported for each age, and the adjustments are cumulative, so differences should be interpreted in light of the stated error ranges and the assumed correction parameters.
a Fade was 1.6%/decade; all others 1.35–1.25%/decade.
b The 50% disequilibrium based on discussion of results.
Determining the dose rate (DR)
Most ionizing radiation in the sediment is from the decay of isotopes in the uranium (U) and thorium (Th) decay chains, the radioactive potassium (40K) element, and to a lesser degree, the beta from rubidium (87Rb). The DR for each sample (see Supplementary Material for complete details) was obtained by elemental data analyses using at least two different techniques; gamma spectrometry and inductively coupled plasma optical emission spectroscopy (ICP-OES). ICP-OES analyses followed procedures of the USGS (Taggert, Reference Taggert2002). The concentrations of K, U, Th, and Rb were determined using both portable and lab-based gamma spectrometry following the procedures described in Snyder and Duvall (Reference Snyder and Duval2003) and in-person communication with the USGS TRIGA Reactor staff.
U/Th ratio results from measurements of gamma activities using a low-resolution portable detector (sodium iodide), a high-resolution germanium detector in the laboratory under controlled conditions, and inductively coupled plasma optical emission spectroscopy (ICP-OES).

Table 4 Long description
U to Th ratio results are listed by sample for three measurement approaches: portable gamma activity ratios, laboratory gamma activity ratios, and ICP-OES uranium to thorium concentration ratios. Highest ratios occur in T2-16-1, with portable gamma 0.966, lab gamma 0.894, and ICP-OES 0.378, and in MS-16-7, with portable gamma 0.652, lab gamma 0.630, and ICP-OES 0.375. Several samples fall near the low to mid range: MS-16-2 has portable gamma 0.306, lab gamma 0.399, and ICP-OES 0.289; MS-16-3 has portable gamma 0.414 and lab gamma 0.399; MS-16-1 has portable gamma 0.406 and ICP-OES 0.447. Lower lab gamma appears for MS-16-4 at 0.299, and lower ICP-OES values include T0 Modern at 0.221, T2-20-2/3 at 0.227, and T3-20-1 at 0.323. Many cells are marked not available, including all methods for MS-16-5 and most methods for several other samples, limiting cross-method comparisons. Where both gamma methods are present, MS-16-7 and MS-16-3 show close agreement between portable and lab values, while MS-16-2 shows a higher lab gamma ratio than portable. Interpretation should consider that different methods use different radionuclide proxies and that missing values and stated measurement uncertainty can affect whether a ratio is meaningfully above or below a regional reference level.
a Equilibrium conditions for U/Th ratios in natural sediments are typically ∼0.30–0.35. However, the regional ratio was 0.37 (Williamson and Carter, 2011).
Deviations from this range, particularly elevated U/Th ratios, indicate U addition
or daughter excess; depressed ratios indicate U/daughter loss.
b The error is considered to be 15% based on the reported errors of all methods or ± 0.06 with a range of accepted ratios from 0.31 to 0.43.
c In excess of regional 0.37 U/Th ratio.
d In deficit of regional 0.37 U/Th ratio.
A Terraplus G-320 portable gamma spectrometer with a 10.2 cm sodium iodide (NaI) detector was used to account for the presence of any inhomogeneous geologic conditions surrounding the OSL samples. Collecting in situ gamma spectrometry measurements can account for DR heterogeneity over space but does not provide extensive information about the cause of the disequilibrium. This can include the presence of materials such as stones, bones, differences in particle sizes, particularly clay-rich lenses, as well as differences in cementation of sediments. Of particular concern to us was whether there was disequilibrium of the U decay chain due to the presence of warm water in the sinkhole. Although the MS is not a typical spring mound, but rather a collapse over a solution breccia pipe (Laury, Reference Laury1980), the surrounding spring-like warm water and artesian activity do comprise an open-system behavior from the decay chains of 238U, 232Th, and to a lesser extent 235U. Our data from gamma spectrometry and ICP-OES are in the Supplementary Material and discussed later (Mahan et al., Reference Mahan, Krolczyk and Mead2026).
Under conditions of natural abundance, the activity of 238U and 234U are equal, and therefore, the ratio of 234U/238U should be 1 (Gilmore, Reference Gilmore2011). In almost every circumstance, measuring this in water shows the ratios instead average 13.5, indicating that the 234U readily dissolves into an aqueous phase, especially under acidic or warm conditions (Arndt and West, Reference Arndt and West2004). This enriches the water (aqueous phase) for 234U relative to 238U and disrupts the secular equilibrium that exists in the 238U decay series. The 232Th series disequilibrium is less problematic because it is very immobile, even in sediments with high moisture content. This radioisotopic “scavenging” in U decay series at the sediment–water interface can be checked by examining the activity ratios of individual parent and daughter isotopes to ensure they are in equilibrium (Olley et al., Reference Olley, Murray and Roberts1996; Buylaert et al., Reference Buylaert, Murray, Gebhardt, Sohbati, Ohlendorf, Thiel, Wastegard and Zolitschka2013). Our results show that such a disequilibrium is indeed present locally and that the impacts are greatest both within ∼2 m of the spring orifice (MS-16-7) and the T2 paludal site (T2-16-1). However, disequilibrium was not appreciable in our other samples (Table 4).
We analyzed samples using ICP-OES, portable gamma spectrometry equipped with a low-resolution NaI detector in the field, and high-purity/high-resolution gamma spectrometer using a high-purity/high-resolution germanium detector in the laboratory. ICP-OES measures true elemental parent abundances, while gamma spectrometry is used to quantify gamma-emitting daughters. The values of 40K, 238U, 226Ra, 210Pb, and 232Th are measured and routinely returned for gamma spectrometry analyses. Comparison of 226Ra/214Bi and 226Ra/214Pb can tell whether the uranium value of 238U is in excess or deficit by the ratios of the daughters to parent activity. We can also use 238U/214Bi and 238U/214Pb if the 238U is measured from ICP-OES. There are multiple ways to measure disequilibria, but the U nuclides most easily measured by gamma spectrometry are in the later decay chain stages—beyond the point at which equilibrium might have been disturbed (Gilmore, Reference Gilmore2011). Our approach was to measure at least one nuclide as precisely as possible before a potential break and at least one nuclide after (Gilmore, Reference Gilmore2011) and employed as many measurement methods as possible. We measured 226Ra (early decay chain) and 214Bi and 214Pb (late decay chain; Table 4, Supplementary Tables S5, S7, and S9).
We chose three ways to identify the amount and type of disequilibrium: (1) using the ratio U/Th for sediment, as shown in Table 4; (2) using the ratio between 226Ra/Ba (because radium is a chemical analog to barium, and so radium is quantitatively coprecipitated with barite); and (3) by reporting relevant activity ratios as outlined earlier, which are typically resolvable in gamma spectra and are standard tools for evaluating disequilibrium. Our results are detailed in the Supplementary Material.
In the laboratory, the bulk sediment samples were counted using the Genie 2K software v. 3.4/3.5 and DSA-LX electronics, and the detectors are Canberra (Mirion) and Ortec GMX-40210-P Ge(Li) in a high-resolution gamma spectrometer fit with a germanium detector. Measured elemental concentrations for comparison between techniques, associated DR, and cosmic ray contributions are presented in Table 2 with further details in the Supplementary Material. Laboratory gamma spectrometry bulk sediment samples were dried, homogenized by gentle disaggregation, weighed, and sealed in plastic planchets having a diameter of 15.2 cm × 3.8 cm (some modification from Murray et al., Reference Murray, Marten, Johnston and Martin1987). Samples were then immediately placed in a gamma-ray spectrometer for ∼8.5 hours. Samples were then stored for a minimum of 21 days to allow radon to achieve radioactive equilibrium (to allow buildup of 226Ra before counting), and the measurements were repeated. The fraction of radon emanation was estimated from the difference of these two spectrometer measurements and compared against the 232Th. Our measured ratios were between 0.97 and 1.08, indicating the samples are not impacted by radon loss.
Not all samples were measured for portable gamma spectrometry, lab gamma spectrometry, and ICP-OES (see Supplementary Tables S5–S8). Of the 10 collected samples, 4 were measured with each of the methods, 2 were measured with both types of gamma spectrometry, and 4 were measured with either lab gamma spectrometry or ICP-OES. Final DR values were preferentially calculated using ICP-OES data, and if that was not available, we used the lab gamma spectrometry to calculate the eventual DR modeling in DRAC (Durcan and Duller, Reference Durcan and Duller2011; Durcan et al., Reference Durcan, King and Duller2015; Table 4).
We modeled the DR assuming disequilibrium in the 238U series chain (Supplementary Table S9). We modeled for either a 10% disequilibrium, 30% disequilibrium, or a 50% disequilibrium using DRAC (Durcan and Duller, Reference Durcan and Duller2011; Durcan et al., Reference Durcan, King and Duller2015) as a sensitivity test for our modified bulk U inputs. The 30% and 50% disequilibrium are higher orders of magnitude than found in almost every warm spring sediment (Rosholt, Reference Rosholt1959). The values that changed the DR the most were for three samples: (1) within 2 m of the spring orifice (where the sample for MS-16-7 was collected for geochemistry but not dating; Figs. 2 and 3; Supplementary Tables S8 and S9), (2) the T2-16-1 Fall River, and (3) the T0 modern Fall River sediment (Table 3). Details of the disequilibrium modification inputs are outlined in the Supplementary Material.
Alpha and beta contributions to the DR were corrected for grain-size attenuation using Bell (Reference Bell1980) for quartz and Guerin et al. (Reference Guerin, Mercier, Nathan, Adamiec and Lefrais2012) for feldspars. Cosmic-ray data were estimated for each sample as a function of depth (both as infill or as underwater), elevation above sea level, and geomagnetic latitude (Prescott and Hutton, Reference Prescott and Hutton1994). We used a long-term water content of ∼50% of total saturation to account for both the saturated conditions when the sediments were in the sinkhole and the subsequent desiccation of the sediment. Luminescence ages are presented in calendar thousands of years ago (0 ka = 2016 CE and 2020 CE for samples T3-20-1 and T2-20-2/3; Table 2) and uncertainties are given at the 95% (2σ) confidence level.
Results and discussion
How old are the sediments that the mammoth bones are buried in?
The feldspar pIRIR ages range from 159 ± 21 ka (MS-16-2), taken near the top of the deposit, to 232 ± 23 ka (MS-16-6) taken from near the bottom of the present excavation (but not the bottom of the sinkhole). This age range excludes a single sample (MS-16-4) which gave an anomalously young age of 131 ± 13 ka that was collected from near the middle of the stratigraphic section (Table 2). Each of these ages came from early Phase III or Phase II sediments, and they generally maintain stratigraphic order throughout the sedimentary sequence. Additionally, they are in close agreement with and fall within the bounds established by previous U-series and TL results. The ages do not match or overlap any previously published radiocarbon age; in fact, they are beyond the dating range of radiocarbon, and the luminescence and radiocarbon dating chronologies are separated by an order of magnitude (Table 2). Furthermore, we could not date these sediments with quartz because the luminescence traps were saturated. Minimum ages from the quartz OSL show the samples in the bone bed are older than ∼75 ka.
The age range we determined for the MS was unexpected, given previous acceptance of radiocarbon data in Agenbroad (Reference Agenbroad, Agenbroad and Mead1994b). We view our luminescence ages as robust and reliable for several key reasons:
1. Signal strength from the pIRIR samples was bright, relatively stable, and suitable for measurement under standard protocols (Supplementary Figs. S1–S11).
2. Two labs sampled independently, then generated comparable ages from two splits from the same field sample (samples MS-16-3a and MS-16-3b; Table 2; also, Mahan et al., Reference Mahan, Krolczyk and Mead2026).
3. We established that a well-dated Late Pleistocene lacustrine site in a similar depositional environment on T2 (Laury, Reference Laury1980) returned compatible luminescence and radiocarbon results.
4. Luminescence dating of sediment from a terrace intermediate in elevation to the T2 (lower in elevation) and T4 sites (the MS site sits on T4, which is higher in elevation) returned a reasonable age when compared with samples from alluvial terraces from the region by Stamm et al. (Reference Stamm, Hendricks, Sawyer, Mahan, Zaprowski, Geibel and Mazzolini2013) and Hanson et al. (Reference Hanson, Mason and Goble2006) (73–61 ka spread in error on age [T3-20-1]; Table 2).
Both Laury (Reference Laury1980) and Wolcott (Reference Wolcott1967) identified fluvial terraces and terrace remnants along the Cheyenne and Fall Rivers and their tributaries. Terraces are preserved on the landscape as a record of stream equilibrium or base level with gravels on gentle slip-off slopes that merge with the alluvium (Wolcott, Reference Wolcott1967). Laury identifies the terrace the MS sinkhole formed on as Terrace 4 (T4; there are six terraces identified, with the highest terrace labeled Terrace 6 [T6] and the present Fall River at Terrace 0 [T0], with historic downtown Hot Springs on Terrace 1 [T1]; Fig. 5). Other workers (Stamm et al., Reference Stamm, Hendricks, Sawyer, Mahan, Zaprowski, Geibel and Mazzolini2013) have identified similar terraces on the northern Belle Fourche and Red Rivers with five terrace levels (Mountain Meadow, Rapid, Sturgis, Bear Butte, and Farmingdale). Ages of the Farmingdale terrace range between 37 and 13 ka, and luminescence ages from the Bear Butte terrace range from 63 to 40 ka. Hanson et al. (Reference Hanson, Mason and Goble2006) dated terraces on the eastern side of the Laramie Range showing separate terraces dated to ∼39 ka and ∼59.5 ka, also with luminescence dating, although incision rates are significantly different between these locations.
Terraces of the Fall River with luminescence dates at sampled sites. T1 was not dated in this study, but T2 is dated to approximately 30 ka with luminescence and radiocarbon. T3 is dated to approximately 65 ka with luminescence, while The Mammoth Site sits on T4, which probably formed between 232–160 ka ago. The figure is modified from Laury (1980).

Figure 5 Long description
Cross-section from west to east, illustrating various geological formations and terraces. On the left, the elevation is marked in feet, ranging from 3350 to 3775, while on the right, it is marked in meters, ranging from 1020 to 1150. The formations are labeled from top to bottom as Spearfish, Minnekahta, Opeche and Minnelusa Formation on the west side, transitioning to Limestone Formation on the east. Terraces are labeled T6 to T0, with T6 at the highest elevation and T0 at the lowest. The Mammoth Site is indicated near T4. A breccia pipe is shown between T4 and T3. Luminescence data is provided in red text, with values such as IRSL 67 plus or minus 1.8 ka and OSL 36.2 plus or minus 1.9 ka. The Fall River is labeled near T0 on the east side. The diagram notes ‘No horizontal scale’ at the bottom left.
We sampled Morrison’s (Reference Morrison2000) Fall River Site, T2-16-1, located in the town of Hot Springs, on Terrace 3 of Kempton and Laury (Reference Laury, Agenbroad and Mead1994), which we identify as T2 (following Laury, Reference Laury1980). This site is a paludal, intermittent fluvially derived deposit preserved in an alluvial terrace fill. The depositional environment of the deposit was almost certainly a thermal spring–fed pond with water temperatures ∼24°C. Just as with the MS, spring discharge was high near the conduit but likely had low flow rates elsewhere. Organic material in association with the faunal remains yielded a date from 20.65 ± 0.45 uncalibrated ka BP, which was calibrated to 24.99 ± 0.59 cal ka BP (Morrison, Reference Morrison2000). It was unclear exactly where in the small deposit (23 m wide × 1 m thick) the radiocarbon samples came from, but we collected luminescence dating samples from the outcrop in what appeared to be the most homogeneous, undisturbed stratigraphy (Morrison, Reference Morrison2000; Fig. 4d).
Our luminescence results from these samples compare favorably with Morrison’s radiocarbon dating results. A quartz OSL age using the MAM yielded 83.4 ± 3.6 Gy (32 ± 2 ka; dose rate adjusted 27 ± 4 ka), while 25 aliquots of feldspar pIRIR returned a MAM of 113 ± 12 Gy (36 ± 4 ka; fading and dose adjusted 32 ± 4 ka; see Supplementary Material). The luminescence ages are older but do not overlap within errors of the radiocarbon age (Tables 2 and 3). The unadjusted quartz age (36–28 ka age range) significantly overlapped with but was slightly younger than the feldspar age (40–32 ka age range). We adjusted all of the feldspar ages in the study to compensate for the small but persistent fade. This fade adjustment makes the ages older (Table 3, Supplementary Fig. S12). We discuss later the disequilibrium findings of our study, which makes an additional adjustment to the already adjusted fade-corrected ages.
Both unadjusted and adjusted results instill confidence that radiocarbon (∼25 ka; Table 1) and luminescence ages (∼30 ka; Table 3) do overlap within the studied Pleistocene sinkhole/lacustrine/paludal deposit and that both quartz and feldspar grains indicate reasonably well-bleached sediments in this setting. Further, it shows the luminescence intensity and characteristics are very different between an ∼30–25 ka deposit and one we dated to ∼230–160 ka (see Mahan et al., Reference Mahan, Krolczyk and Mead2026), bolstering our assertion that the MS site is older than previously reported. We hypothesize that the lower portions of the sinkhole may date to ∼400–300 ka.
Two other samples were collected from terraces at elevations lying between the MS site on T4 and T2. Samples T3-20-1 and T2-20-2/3 were collected from deposits that were mapped as Terrace 3 in Laury (Reference Laury1980) (Fig. 5). We accepted 7 of 30 aliquots of feldspar for a MAM age of 67 ± 7 ka (T3-20-1) and accepted 10 of 40 aliquots for a MAM age of 22 ± 3 ka on T2-20-2/3 (Table 2). The quartz in this sample could not be dated, as its luminescence signal was dominated by a slow component, likely from the inclusion of chert found in local Paleozoic carbonates. The younger age on the T2-20-2/3 sample aligned closely with the Morrison (Reference Morrison2000) age; the T2 ages converge around 25–22 ka or 32–27 ka when adjusted (Table 3). This sample was taken from the upper level of the terrace on the opposite side of Fall River from the Morrison (Reference Morrison2000) paludal terrace sample. There are two possibilities for the gap in the 25–22 ka and 32–27 ka ages: (1) this sample site was in a remnant layer of the younger stratigraphy in Terrace 2 that is not preserved across the Fall River in the Morrison locality or (2) multiple alluvial packages are plastered atop this terrace with discontinuous stratigraphy.
How reliable are these ages with respect to typical luminescence assumptions?
Luminescence dating of modern Fall River sediment and partial bleaching
As previously mentioned, partial bleaching due to mass wasting is a concern in sinkholes. The sediments at the MS are sourced from the Mesozoic and Paleozoic sedimentary rocks of the southern Black Hills, which provide acceptable dose-recovery tests, a dominant fast component of luminescence in quartz, and relatively “bright” K-spar decay curves (Supplementary Figs. S1–S11). Modern samples can be useful for assessing bleaching conditions. We did not have an appropriate modern analog sample for the sinkhole sediments, as the upper portions of the MS have been heavily modified. However, because overland flow into the sinkhole was likely the most important component of net sediment accumulation (Laury, Reference Laury1980), we assumed a modern alluvial sample would be an appropriate analog for assessing bleaching conditions in the spring. We collected a luminescence sample in the channel of the modern Fall River in the town of Hot Springs during the spring runoff.
One of the most reliable ways to assess bleaching conditions is to compare the DE of quartz and feldspar (Mahan et al., Reference Mahan, Rittenour, Nelson, Ataee, Brown, DeWitt and Durcan2023). We ran 25 aliquots of quartz from the modern sample, where 5 aliquots showed no signal above background, 18 averaged 0.23 ± 0.02 Gy, and 2 gave substantially higher signals of 11 ± 1.3 Gy and 18 ± 3 Gy (see Mahan et al., Reference Mahan, Krolczyk and Mead2026; Supplementary Fig. S11a). We ran 30 aliquots of feldspar, of which 12 aliquots showed no signal above background, 12 averaged 2.18 ± 0.21 Gy, and 6 gave substantially higher signals of 3.54 ± 0.75 Gy to 5.74 ± 0.86 Gy (Supplementary Fig. S11b). This modern analog sample had the highest overdispersion of those we studied, as is expected in modern samples, ranging from 146% for the quartz and 31% for the feldspar (Mahan et al., Reference Mahan, Krolczyk and Mead2026; Table 2). The feldspars did have higher DE values when there was a measurable signal; approximately one-third appeared to be well bleached, as the luminescence signal was low, while the remaining two-thirds showed some degree of partial bleaching. Despite the relatively high overdispersion, these results suggest that both minerals were moderately well bleached during active transport. It is likely that the sinkhole sediments would have gone through multiple bleaching regimes, especially if grains were exposed multiple times in the sinkhole by either depositional processes or bioturbation.
We conclude that the modern alluvial sample yielded ages falling between ∼0.80 and 0.12 ka indicting that at least a third of the grains must have been exposed to a minimum of ∼1000 seconds of sunlight (Buylaert et al., Reference Buylaert, Murray, Gebhardt, Sohbati, Ohlendorf, Thiel, Wastegard and Zolitschka2013) and that if the Fall River or similar streams fed into the MS sinkhole, quartz and feldspar grains would very likely have been well bleached at a depth of 150 cm even in turbid water conditions, as shown in Sanderson et al. (Reference Sanderson, Bishop, Stark, Alexander and Penny2007). This is ideal for dating, as the majority of the sampled grains were bleached before deposition, despite the periglacial paleoenvironment and climate at the younger Hot Springs location during sinkhole formation and propagation. We suggest that these grains were nearly fully bleached before deposition and were subsequently entombed in a warm spring in shallow water in which sedimentation appears to be relatively uniform when the spring was active.
Bioturbation by mammoths as a sediment mixer and disaggregation of sediment in situ by the spring conduit turbidity
Another potential problem is related to sample disturbance; after sediments were deposited in presumably shallow water and low-flow conditions, a chance of sediment disturbance remains. This may be the case with the substantially younger age we determined for sample MS-16-4. This sample sits at the base of the museum exposure for Phase II sediments and is one of the deepest samples that were collected (Figs. 2 and 3b, Table 2) but returned the youngest age at 130 ka. There are five possibilities for this age discrepancy (see Supplementary Fig. S13): (1) a DR anomaly that is caused by some undetected disequilibrium or cementation peculiarities (this is discussed later); (2) the relatively high K content (2.3%) we measured for this sample, although we note that MS-16-2 also has higher K (Table 4); (3) sensitivity corrections of the feldspar that should have been modeled but were not; (4) water contents that may be underestimated; or (5) introduction of younger grains by either bioturbation or another postdepositional process (such as side wall collapse).
Bioturbation caused by mammoths could have been a major source of mixing of the sediments (Agenbroad, Reference Agenbroad, Agenbroad and Mead1994a), and the increasing frequency of deep mammoth footprints is one of the main diagnostic markers between Laury’s Phase II and Phase III sediments (Laury, Reference Laury1980). For this reason, we chose to sample where bedding was clearly present and not disrupted (Figs. 3a and b and 4c). Sample MS-16-5 was also very close to sample MS-16-4 (Figs. 2 and 3a and b), and it shows none of these ill effects, giving an age in stratigraphic order. If we did sample within a mammoth disturbance, the luminescence ages would be younger than surrounding stratigraphy but should not be 40–50 ka younger. Because we could not determine the dominant probable cause for the age inversion, we did not use it in the age range of the MS site sediments, and the discrepancy remains unresolved at this time.
While we assume that the sediment grains were adequately transported and deposited under relatively shallow water flow, it is possible that some sediments were influenced by slumping of local rock or sediment, and therefore our ages could be either significantly older than expected due to problems related to partial bleaching or significantly younger due to younger, higher grains incorporating into older lower layers. This latter scenario is unlikely for several reasons: (1) we did not identify a large number of saturated grains, suggesting that samples were exposed to sunlight; (2) the MS fill is stratified, laminated, and reasonably well sorted, which is indicative of deposition by flowing water and not slumping; (3) all but one of the ages are in correct stratigraphic order; (4) our modern sample is moderately well bleached; and (5) proxy samples from the Fall River T3 and T2 sites show a dramatic difference in luminescence signals and characteristics from sediments dated ∼30–20 ka and the much older sediments we dated in the MS fill (see Supplementary Figs. S1–S11).
Water content in the pore spaces between the sediment (both past and present)
Water absorbs a portion of the environmental radiation, particularly beta radiation, thereby reducing the dose received by mineral grains (Rosenzweig and Porat, Reference Rosenzweig and Porat2015). Adjusting the moisture content by ∼1% changes the resultant age by ∼1% in the same direction (Duller, Reference Duller2008), requiring that we estimate a sample’s average moisture content from its burial to sample collection. This is especially important for sediments that experienced changes in moisture conditions, particularly those in alluvial or lacustrine environments.
We assumed that sediments in the MS sinkhole were continuously saturated until it was infilled and desiccated, which is indicated by sedimentological evidence at the site. We also assume that as the sinkhole filled, the porosity and therefore sediment moisture contents decreased due to compaction, an issue that may have been greater toward the deeper portions of the bone bed (Buylaert et al., Reference Buylaert, Murray, Gebhardt, Sohbati, Ohlendorf, Thiel, Wastegard and Zolitschka2013). Excavation of the MS resulted in significant desiccation since the site was exposed in the 1980s. During the 2016 CE sampling, the sediments were brick hard, requiring a saw or chisel to remove them (Fig. 4a). We suspect that desiccation would have begun ∼65 ka when stream incision was occurring when T3 was being formed.
There has been investigative research into the problem of measuring past sediment moisture contents, notably from Nelson and Rittenour (Reference Nelson and Rittenour2015) and Rosenzweig and Porat (Reference Rosenzweig and Porat2015). Due to the unusual properties of the sinkhole, we decided to treat the problem as we would approach “lake sediment.” Water content and the effect on DR calculations were determined using moisture expressed as weight %. The water content of the modern Fall River sediment sample was 85%, although the river material was considerably coarser than anything we sampled at the MS (Table 2). We considered that this would be full saturation. A reasonable estimate of 60% water content was assumed for sediment near the top of the sinkhole and 40% for sediment near the bottom of the sinkhole (Buylaert et al., Reference Buylaert, Murray, Gebhardt, Sohbati, Ohlendorf, Thiel, Wastegard and Zolitschka2013). Our luminescence samples were primarily from Phase II sediments, near the middle of the sinkhole fill, and therefore we assigned long-term moisture contents of 50% to our samples of these silty sediments. To significantly impact our ages, these moisture contents would have to vary by >10%, which we believe is unlikely; regardless, the impact would be less significant than potential issues related to U disequilibrium.
U disequilibrium at the MS
The sediments in the MS fill that are larger than 0.02 mm are predominantly fine-grained sands and silts composed of 80% quartz, 1.5% chert (microcrystalline quartz), 4.7% feldspar, 3.3% rock fragments, 0.7% glauconite, 0.9% mica, and 0.4% heavy minerals. Sediments smaller than 0.002 mm are clay minerals of montmorillonite, muscovite, kaolinite, and less commonly, illite (table 1 in Laury, Reference Laury1980). We determined the radio-elemental concentrations of U, Th, and K of the sediment using multiple techniques, which were then compiled to obtain the DR. As presented in the methods, we performed three analyses. (1) We used the ratio of U/Th concentrations for typical sediment around Hot Springs, South Dakota, as accessed through the USGS geochemistry database for sediment and combined it with our own data. (2) We used the ratio between 226Ra/Ba in water (because radium is a chemical analog to barium, and so radium is quantitatively coprecipitated with barite) and reconstructed the original 226Ra activity on the basis of the 226Ra/Ba ratio in the modern waters and the Ba concentration of the sediment. (3) We measured 226Ra (early U decay chain) and 214Bi and 214Pb (late U decay chain; Table 4, Supplementary Tables S5, S7, and S8). We then compared 226Ra/214Bi and 226Ra/214Pb so we could evaluate whether 238U is in excess or deficient.
The ratio of U/Th concentrations from the modern streams and the terraces ranged from ∼0.23 to 0.37. U/Th ratios from the MS (T4) were about ∼0.35 (Table 4, Supplementary Table S8). In contrast, the current surface sediments in the modern drainages have an average U/Th ratio of ∼0.23 which is very close to the average U/Th ratio for the upper crust of 0.25 (Hu and Gao, Reference Hu and Gao2008). Our baseline for the MS T4 sediments was 0.37–0.35, T3 was 0.32, and T2 ranged from 0.37 to 0.23, while the modern channel (T0) was 0.23. The ratio in the modern drainage is very different from what was obtained from the higher terraces.
Our results (Table 4, Supplementary Table S8) show that four samples had daughter activity that was in excess of what was expected: (1) T2-16-1 from the Fall River T2 lacustrine terrace, (2) MS-16-7 from within 2 m of the spring orifice at the MS, (3) T0 modern from the current Fall River channel, and (4) MS-16-1 from the MS sinkhole. These U/Th ratios deviate from 0.25 by ±∼0.64 to 0.20 with each showing excess contributions from daughters (Table 4). Inadequate dosimetry information is available for both MS-16-2 and MS-16-3, but their U/Th ratios more closely resemble the modern 0.23 rather than the terrace T4, which averages 0.37. The only age that was significantly impacted by disequilibrium issues was for T2-16-1, which showed 50% disequilibrium excess (Table 4). Our sensitivity tests using modified U inputs changed the dose by >0.5 Gy, making the age significantly younger (Table 3, Supplementary Table S10). For this reason and one other discussed later, we prefer the 50% adjusted disequilibrium age for this sample at 27 ka for quartz OSL and 32 ka for feldspar IRSL.
Our reconstruction of the original 226Ra activity on the basis of the 226Ra/Ba ratio in the modern waters and the Ba concentration of the sediment was of limited utility. We used data on the water chemistry from Williamson and Carter (Reference Williamson and Carter2001) on the Minnekahta Aquifer beneath the town of Hot Springs. The report shows the highest amount of Ba in water is 620 ppb or 0.62 ppm (the absolute highest outlier). Results of 226Ra in the water of the same aquifer show the highest amount at 66 ppb or 0.066 ppm. We show that even with our highest measured concentration of Ba and 226Ra the disequilibrium would not approach 226Ra (equivalent U) excess at anything over 5 ppm, which is not enough to verify any disequilibrium changes in the water or water–sediment interface (see Supplementary Text for details).
The results comparing the 226Ra/214Bi and 226Ra/214Pb with 238U to see whether there is an excess or deficit in the ratios of the daughters to parent activity were more informative (Supplementary Table S9). Our results show that four samples were roughly equal in activities or concentrations (MS-16-1, MS-16-3, MS-16-6, and the T0 modern Fall River) and are probably a closed system. In MS-16-4, the 226Ra and 214Pb did not match the 214Bi. There was no 238U measured, so we are unsure of the initial parent value. For MS-16-4, the 226Ra and 214Pb are about 0.30 ppm larger than the 214Bi, placing it just outside the error bars, representing a change that should be easily accommodated in the bulk U input for the DRAC modeling program (Supplementary Table S10). In MS-16-2, the 226Ra and 214Pb did not match the 214Bi, similar to MS-16-1. However, for MS-16-2, we do have 238U measured, and it appears our target is ∼2.75–2.85 ppm. For MS-16-2, the 226Ra and 214Pb are about 0.50 ppm larger than 214Bi, which places it outside the error bars, but represents a change easily accommodated in the DRAC program (Durcan et al., Reference Durcan, King and Duller2015).
The two samples with the largest differences in daughter isotope activities are MS-16-7 (near the spring orifice) and the T2-16-1 paludal site. MS-16-7 shows that all daughter products, whether early decay or late decay, are in excess of the measured 238U. The 226Ra is 4.53 ppm, 214Pb is 4.68 ppm, and 214Bi is 4.87 ppm, while the 238U is 1.51 ppm. Collectively, the daughters are in excess by 3× the parent, confirming that samples taken near the spring orifice would need considerable adjustments for such open-system behavior. T2-16-1 has the early decay chain daughter of 226Ra in excess but has much lower concentration than late decay daughters. The 226Ra is 3.56 ppm representing 2× the 238U of 1.74 ppm. Late decay chain daughters are about 4.40 ppm (214Pb and 214Bi) representing 3× the parent 238U. There is a tenuous link, which will need future validation, that the 226Ra decay chain is indeed in open-system behavior (just as all the late decay chain daughters appear to be) but that the system eventually closes ∼40–30 ka after the spring activity ceases, as can be seen with the lower 226Ra in sample T2-16-1.
There were no large bodies of organic materials (e.g., peat) present in the sinkhole fill, other than those associated with the bones themselves. Organics were disseminated and constituted only a small portion of the layers at 0.15% to 0.19% (Laury, Reference Laury1980); this includes very little pollen or diatoms. According to Lund (Reference Lund1997), the spring water at MS would have been 33-35°C almost year-round, would have dissolved solids of ∼1500 ppm, would have consisted primarily of sulfate- and sodium chloride–rich waters, and would have had a pH between 6.7 to 7.8, so it is unlikely that organic materials were consistently contributing to open-system behavior.
Even though the sedimentary units that we sampled are located near the center of the sinkhole, relatively homogeneous, and more than 7 m from the main spring conduit, we were not convinced this ensured that our DR determinations were accurate. Because of observed 238U/226Ra disequilibrium near sample MS-16-7 (the spring conduit; see Table 4) and TS-16-1 site locality, we performed bulk U sensitivity adjustment using DRAC (Durcan et al., Reference Durcan, King and Duller2015). The warm water (27–33°C; Lund, Reference Lund1997) near the conduit preferentially deposited U up to at least 3× higher concentrations than at greater than 2 m distance from the conduit. The disequilibrium we identified rapidly decreases with distance from the conduit (Table 3, Supplementary Tables S5–S9). Therefore, between 2 to 4 m away, we adjusted samples by 30% to achieve equilibrium, assuming a U/Th ratio of ∼0.35, although no correction was really needed for samples collected farther than 5 m away from the conduit (Table 4). There is relatively little difference in the final ages once they are adjusted for anomalous fading and open-system disequilibrium behavior, except for terrace sample T2-16-1. We prefer the adjusted ages on the quartz and feldspar for T2-16-1, while for all others the final adjusted age is not even changed within the original unadjusted errors (Table 3).
How long did the sinkhole stay open and accessible to the mammoths?
Laury (Reference Laury, Agenbroad and Mead1994) approached this question by making estimates from Mirror Lake in the northern Black Hills. He calculated rates from this lower-temperature but comparable-sized lake and reported a 50 mm/yr sedimentation rate (for the past 40 years; Epstein and Doctor, Reference Epstein and Doctor2013). Assuming a 50 mm/yr sedimentation rate, the MS sinkhole would have infilled with 14 m of sediment in 280 years (14 m divided by 0.05 m/yr). This is relatively unsatisfying for two main reasons: the sand–silt couplets of dark- and light-colored sediments almost certainly reflect some seasonality or seasonal sedimentation event in the Phase II sediments, and there are considerably more couplets than 280 (see Fig. 3a and b). It also does not consider the known timescales with which to try and calculate an actual sedimentation rate.
Luftkin et al. (Reference Lufkin, Redden, Lisenbee and Loomis2015) and Perry (Reference Perry2018) both suggest that sedimentation rates for warm water are twice as fast for cooler water, but an average sedimentation rate for warm-water springs does not exist. We can make two estimates using our luminescence ages: one is to gather nearby data points from two widely spaced samples and the second approach is to use our range of ages to produce an average sedimentation rate. One way to produce an average sedimentation rate is by gathering close data points such as MS-16-2, MS-16-1, and MS-16-3 dating to ∼195 ka and ∼160 ka for a total time span of 35 ka (ignoring the young outlier of MS-16-4). These three samples are roughly 1 m apart, yielding a 35 ± 5 mm/yr sedimentation rate. Similarly, samples MS-16-5 and MS-16-6 (again ignoring sample MS-16-4) dating to 232 ka to 170 ka span a total of 62 ka. These two samples are, again, roughly 1 m apart and give a 62 mm/yr rate. Both rates are very close to the measured 50 mm/yr of Mirror Lake, but we have not found more data to test whether 62 to 52 mm/yr is common. If, alternatively, we simply take our entire sample set of ∼232–160 ka divided by the stratigraphic length of ∼6 m, then we calculate a much slower sedimentation rate of 12 mm/yr. This rate is much more compatible with the number of sand–silt couplets and the extremely long range suggested by our ages.
Our age estimate for the MS sinkhole sediments (232 to 160 ka) are compatible with paleontological evidence of mammoth and mastodon evolution and characteristics during Marine Isotope Stage (MIS) 6 and MIS 7. The Pleistocene is poorly sampled for North American mammoths, with many sites dated to less than 30 ka (Agenbroad, Reference Agenbroad2005). Our age estimates are in range with typical M. columbi morphology that was achieved in some populations by 255 ka to 130 ka. For example, Lister (Reference Lister2017) and Lister and Sher (Reference Lister and Sher2015) cite the MS bonebed specimens as prime examples of Late Pleistocene M. columbi morphology. A thorough reassessment of potential ages for a sample size as large as that found at the MS bone bed may shift our fundamental understanding of morphological trends, which a thorough reassessment could clarify, because the MS site bones are often used as reference collections for studies in this regard.
Hypothesis addressing the discrepancy between radiocarbon and other dates at the MS
Finally, we tackle the problem of the very young radiocarbon dates with the much older U-series, TL, and OSL dates. Clearly, some postdepositional process occurred to make the radiocarbon ages so vastly different from either the U-series or the luminescence ages. The TL and OSL dates have no relationship to time of cementation. They will almost always be older in a calcium-rich environment than radiocarbon ages (Geyh, Reference Geyh1995; Geyh and Eitel, Reference Geyh, Eitel, Mook and van der Plieht1998) but should not be an order of magnitude older. The U-series ages could reflect the time of onset of induration only if the uranium in the water is precipitated into the cement, and ages are therefore usually considered to be minimum estimates. Geyh and Eitel (Reference Geyh, Eitel, Mook and van der Plieht1998) found that the 14C clock is reset to nearly zero during dissolution of a calcareous detritus and the precipitation of a calcrete. Therefore, the 14C ages may record the actual final cementation process.
If the spring conduit was active and baseline level of the Fall River allowed the conduit to flow, cementation would not have occurred, because the area was always wet. As the Fall River groundwater dropped because its base level fell, both the quantity and the temperature of the water would have changed. This drop is recorded in the level of the next terrace (T3 vs. the T4 terrace the sinkhole sits on; Kempton and Laury, Reference Laury, Agenbroad and Mead1994). Intermittent ground moisture and colder temperatures meant carbonate, gypsum, and anhydrite cementation that are present today, particularly in the southeast end, would have been deposited during T3 time. The postdepositional gypsum stringers, in particular, indicate evaporation processes are occurring. A drying and warming climate may also have increased evaporation at depth. Our age determination of 73–61 ka on T3 provides evidence that the MS sinkhole likely dried, cemented, and completely infilled at the start of MIS 4 (Table 2).
Conclusions
The luminescence dating results show that the ages of sediments at the MS site fall between ∼232 ka and 160 ka and are considerably older than previously published 14C ages. Efforts to date these sediments with OSL on quartz were not successful due to saturated luminescence traps, suggesting ages >75 ka. Our IRSL ages are in close agreement with previous results from U-series (150–129 ka) on tooth enamel and early attempts to date the sediment surrounding the bones with TL dating (101 ka). A luminescence sample collected from the Fall River channel, which is fed by warm springs that occur within the town of Hot Springs, produced modern age for quartz and a very young age for feldspars. The feldspar ages collected from the alluvial terraces below the MS site were compatible with radiocarbon or other luminescence results. This indicates feldspars were relatively well bleached during transport or have gone through multiple bleaching regimes, which could be due to either favorable alluvial conditions or the input of flood sediments. Samples collected from a previously dated proxy site of lacustrine or paludal sediment (Fall River T2/T3 site; Morrison, Reference Morrison2000) produced luminescence ages that are consistent with 14C ages, although the preferred luminescence ages were adjusted for both anomalous fading and open-system disequilibrium behavior at this site. In contrast, the results of luminescence dating at the MS were incongruent with less reliable radiocarbon dates on bone apatite and carbonate from the site and seemed to have little open-system behavior.
Feldspar pIRIR yielded robust and reliable ages for the bulk of the sedimentary sequence at the MS. Although it is often difficult to obtain old (>100 ka) luminescence ages due to issues with sediment sources, transport mechanisms, and preservation potential, our results demonstrate that several potentially problematic components could be tested and verified. First, DR values were sufficiently low to avoid saturation of the luminescence signals for feldspar. Second, the narrow DE distributions of the samples analyzed indicate a high probability that the sampled sediments were well bleached before burial, suggesting that sediments were transported into the sinkhole via either shallow water or aeolian processes. Third, open-system U disequilibrium did not seem to be an intractable problem, and we were able to model ages with 30% disequilibrium successfully. Finally, sediments were largely homogeneous and non-bioturbated at the sampling site, meaning there was little chance for post-burial exposure of the sample sediments.
Standard protocols, as detailed in the Supplementary Material, were optimal for dating the MS samples based on the favorable overdispersion values for these samples and the DR behavior. Along with an amenable transport mechanism of the sampled sediments and the homogeneous nature of the sinkhole sediments, which allow us to visually see bioturbation, our confidence in the final luminescence ages is high. Moreover, the ages maintain stratigraphic order throughout the sedimentary sequence (with the lone exception for sample MS-16-4), and two luminescence dating labs produced very similar results for splits from the same sample.
Our IRSL chronology suggests that the sediments within Phase II of the MS bone bed date between ∼232 and 160 ka, indicating deposition primarily during MIS 6 and perhaps the latter stages of MIS 7. Thus, our luminescence ages allow for a calculation of accumulation rates of sinkhole sediment. The overall rate of accumulation is probably close to 12 mm/yr and implies a slow, steady rate of infill during MIS 6 and MIS 7. Our findings strongly suggest the sinkhole dried, cemented, and completely infilled before the start of the MIS 3 and are especially novel, given the paucity of well-dated, pre-radiocarbon sites on the Northern Great Plains. Contextually, the results permit a more refined understanding of biological and environmental change in the Black Hills during latter portions of the Pleistocene. In particular, the MS offers an insight into regional landscapes before the dynamic climatic, biologic, and environmental changes occurring closer to the MIS 2 glacial maximum. Finally, the chronological framework presented here provides a temporal foundation for future studies concerning terrace development along the Fall River.
Supplementary material
The supplementary material for this article can be found at https://doi.org/10.1017/qua.2026.10102.
Acknowledgments
We appreciate the initial work by Larry D. Agenbroad (deceased), Pamela Kempton, and Robert L. Laury that went into understanding the chronology and stratigraphy of The Mammoth Site during the early phases of research at the locality in the 1970s, 1980s, and 1990s. Only from their past focused research are we now able to expand on the chronology using new technology. We thank Sandra L. Swift and Monica Bugbee for their help and National Association of Geology Teachers interns Rachel Phillips and Emily Perman for their help drafting a stratigraphic column and editing figures. We appreciate the help and support from Presston Gabel and staff, along with the board of directors of The Mammoth Site of Hot Springs. We also extend gratitude to Steve Holen of the Center for American Paleolithic Research for introducing the concept of luminescence dating for the MS sediments. Without his bridge between knowledge and collaboration, the project would not have reached fruition. JIM also appreciates a few individuals for giving him the time to finish some research that has long been delayed.
Funding
Partial funding for this project was received from the U.S. Geological Survey Natural Hazards Mission Area, the U.S. Geological Survey National Cooperative Geologic Mapping Program, and the Larry D. Agenbroad Legacy Foundation, The Mammoth Site, Hot Springs. All of the remarkable work that goes on at this site would not have been possible without the scientific curiosity and generosity of Phil Anderson (landowner), heavy equipment operator George Hanson and his son, Dan Hanson, and the Hot Springs Gem and Mineral Society. Any use of trade, firm, or product names is for descriptive purposes only and does not imply endorsement by the U.S. Government.
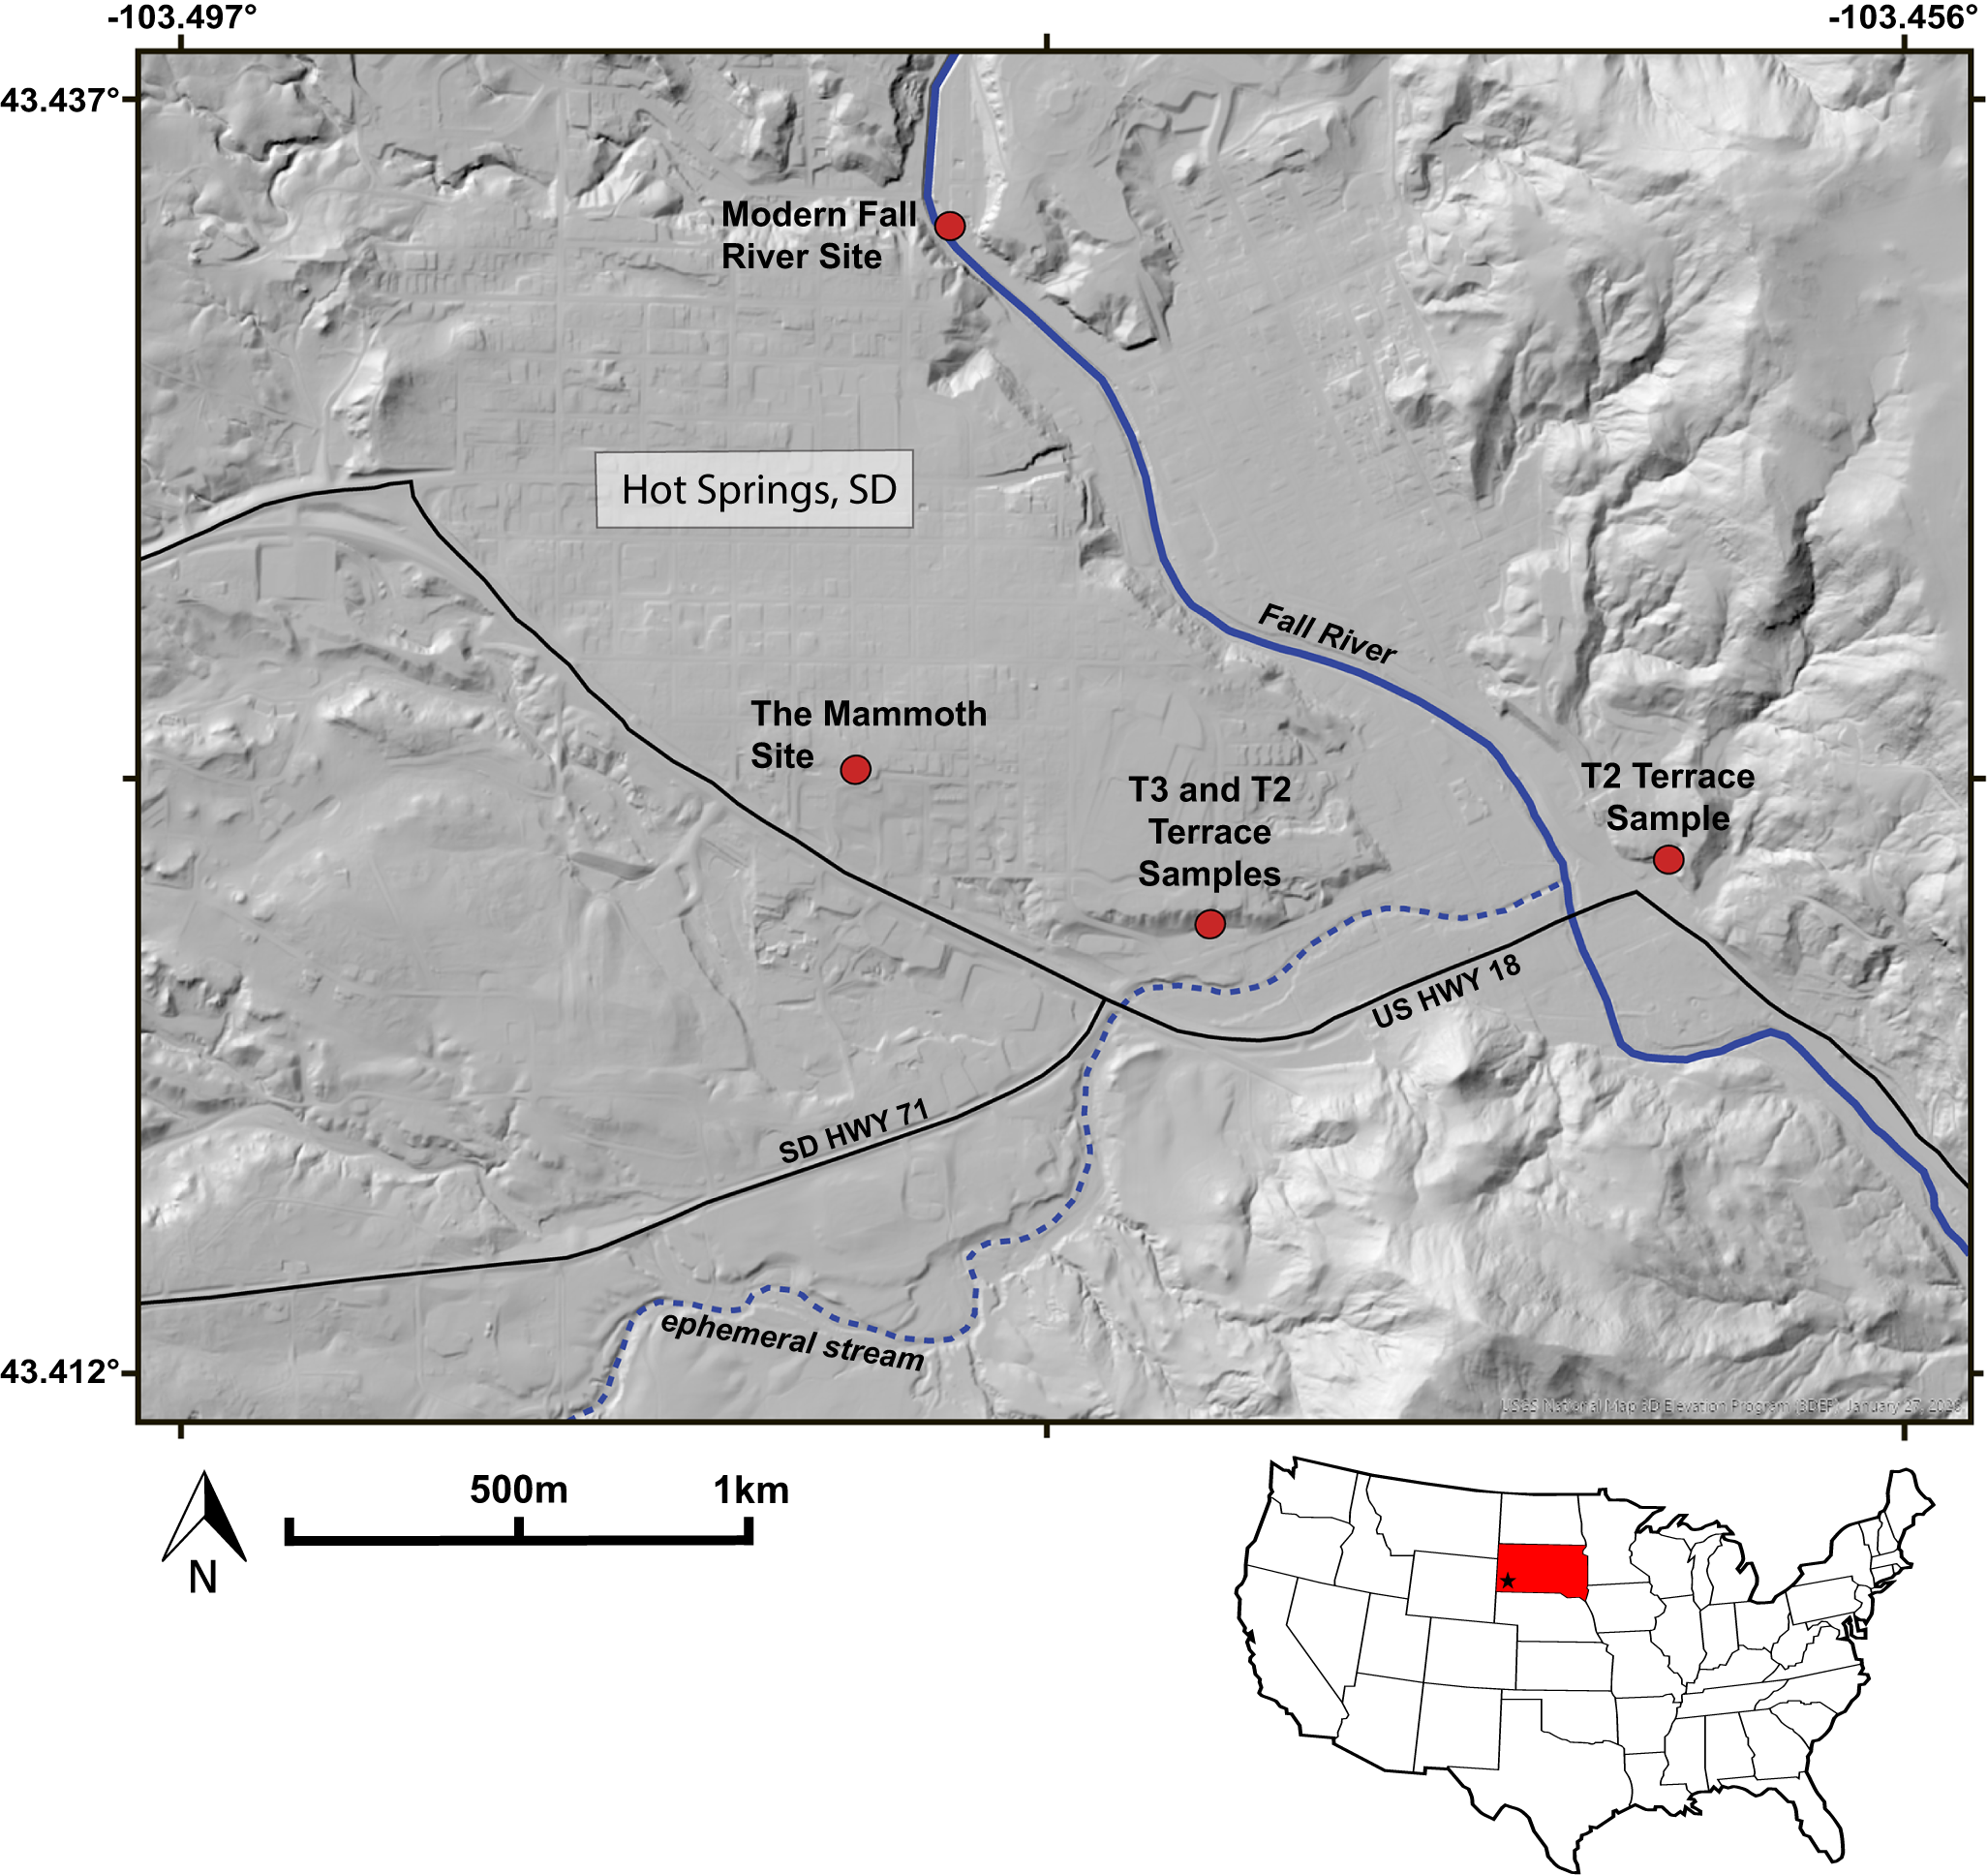
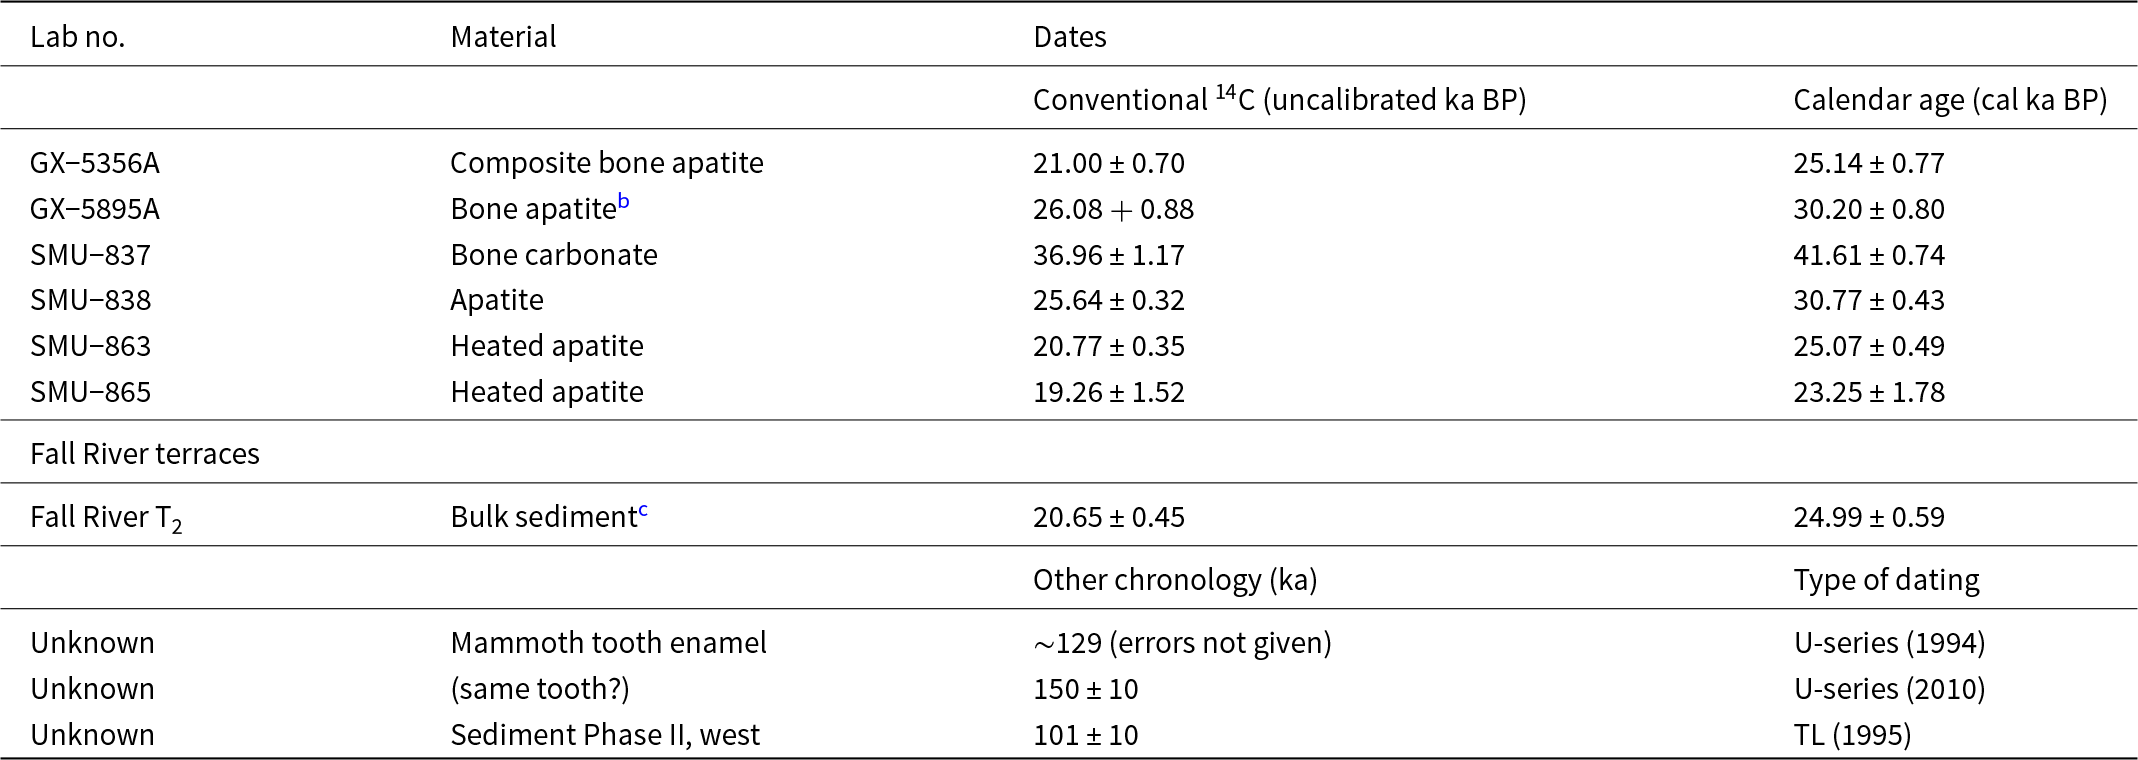
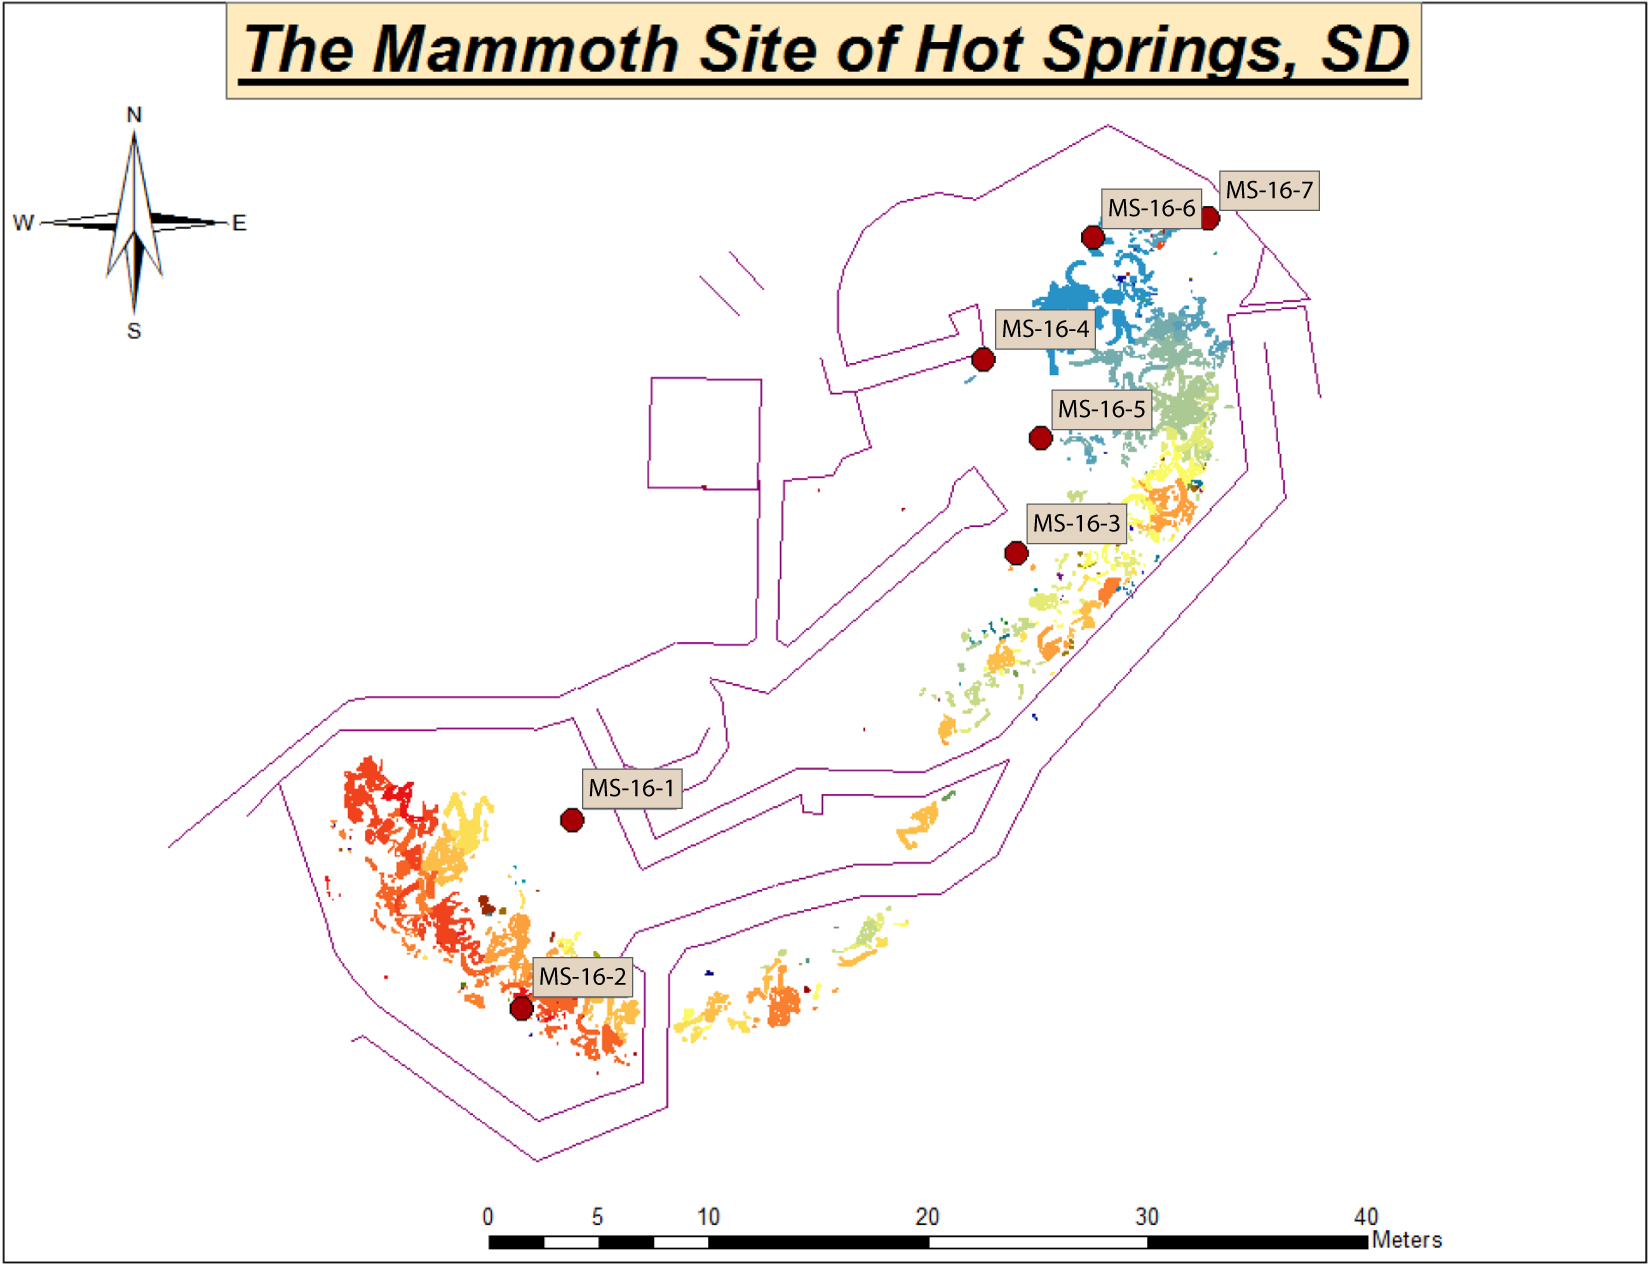
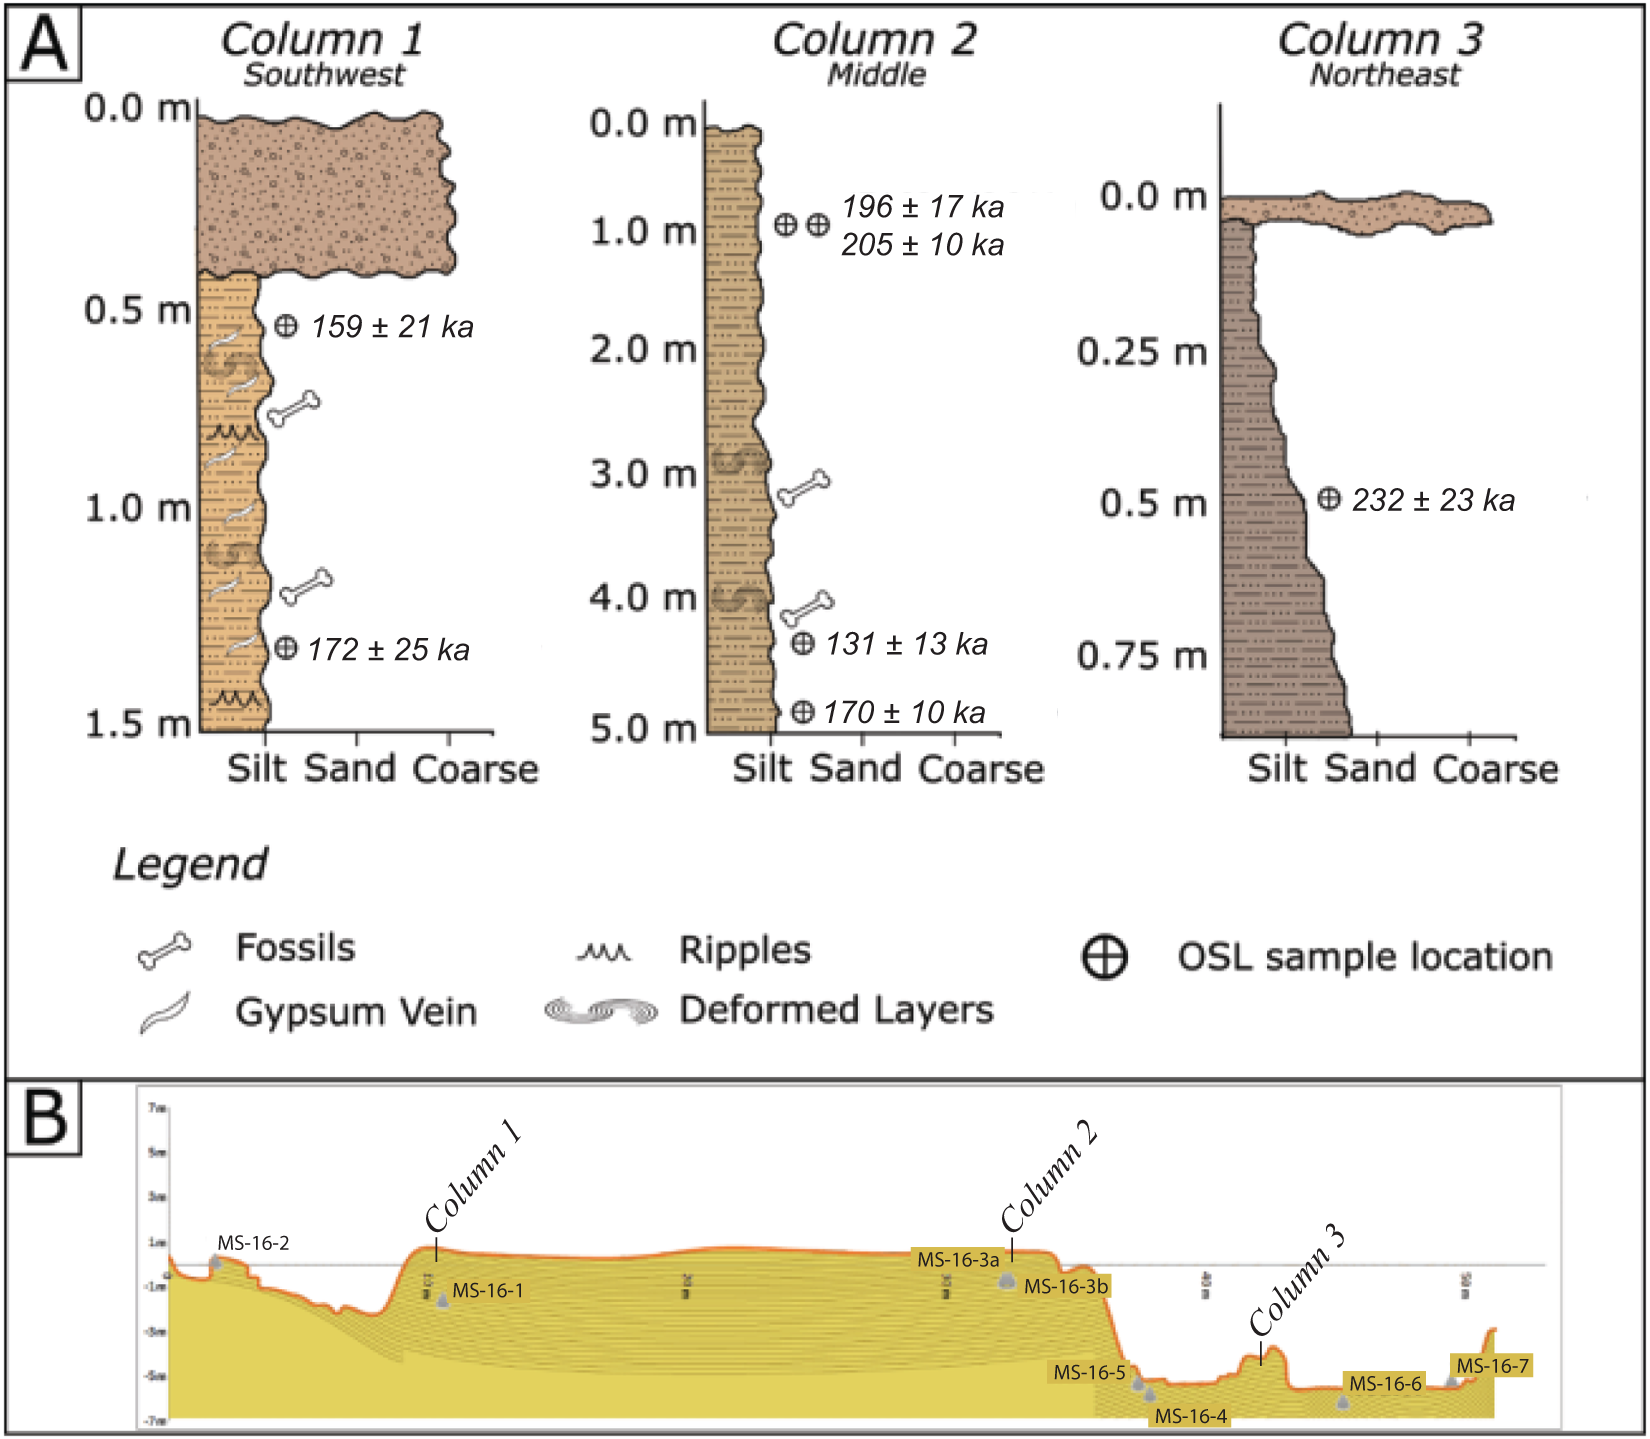
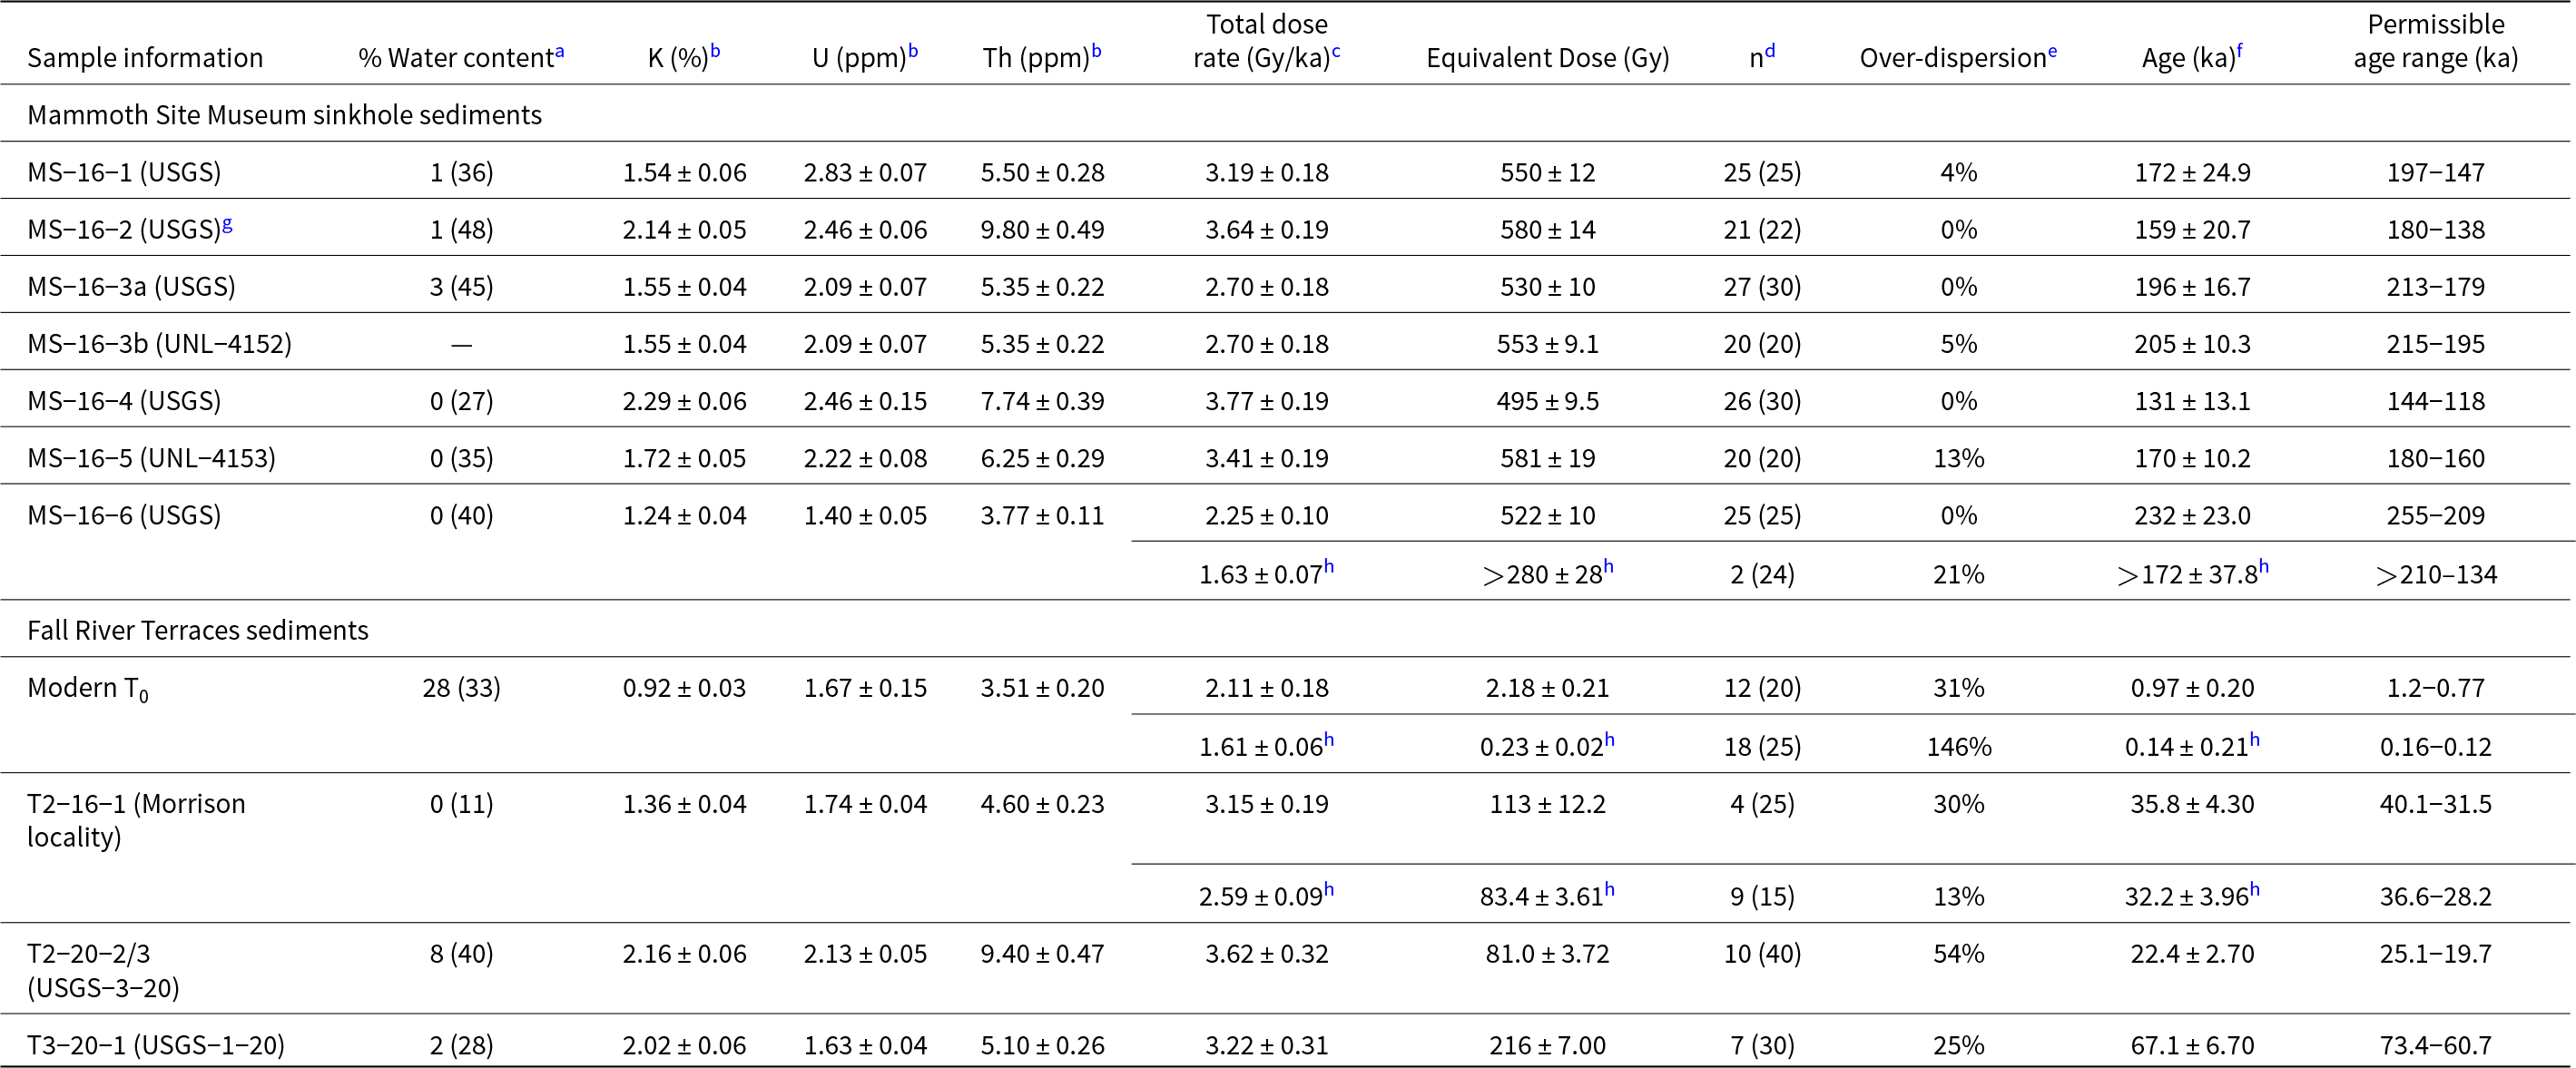
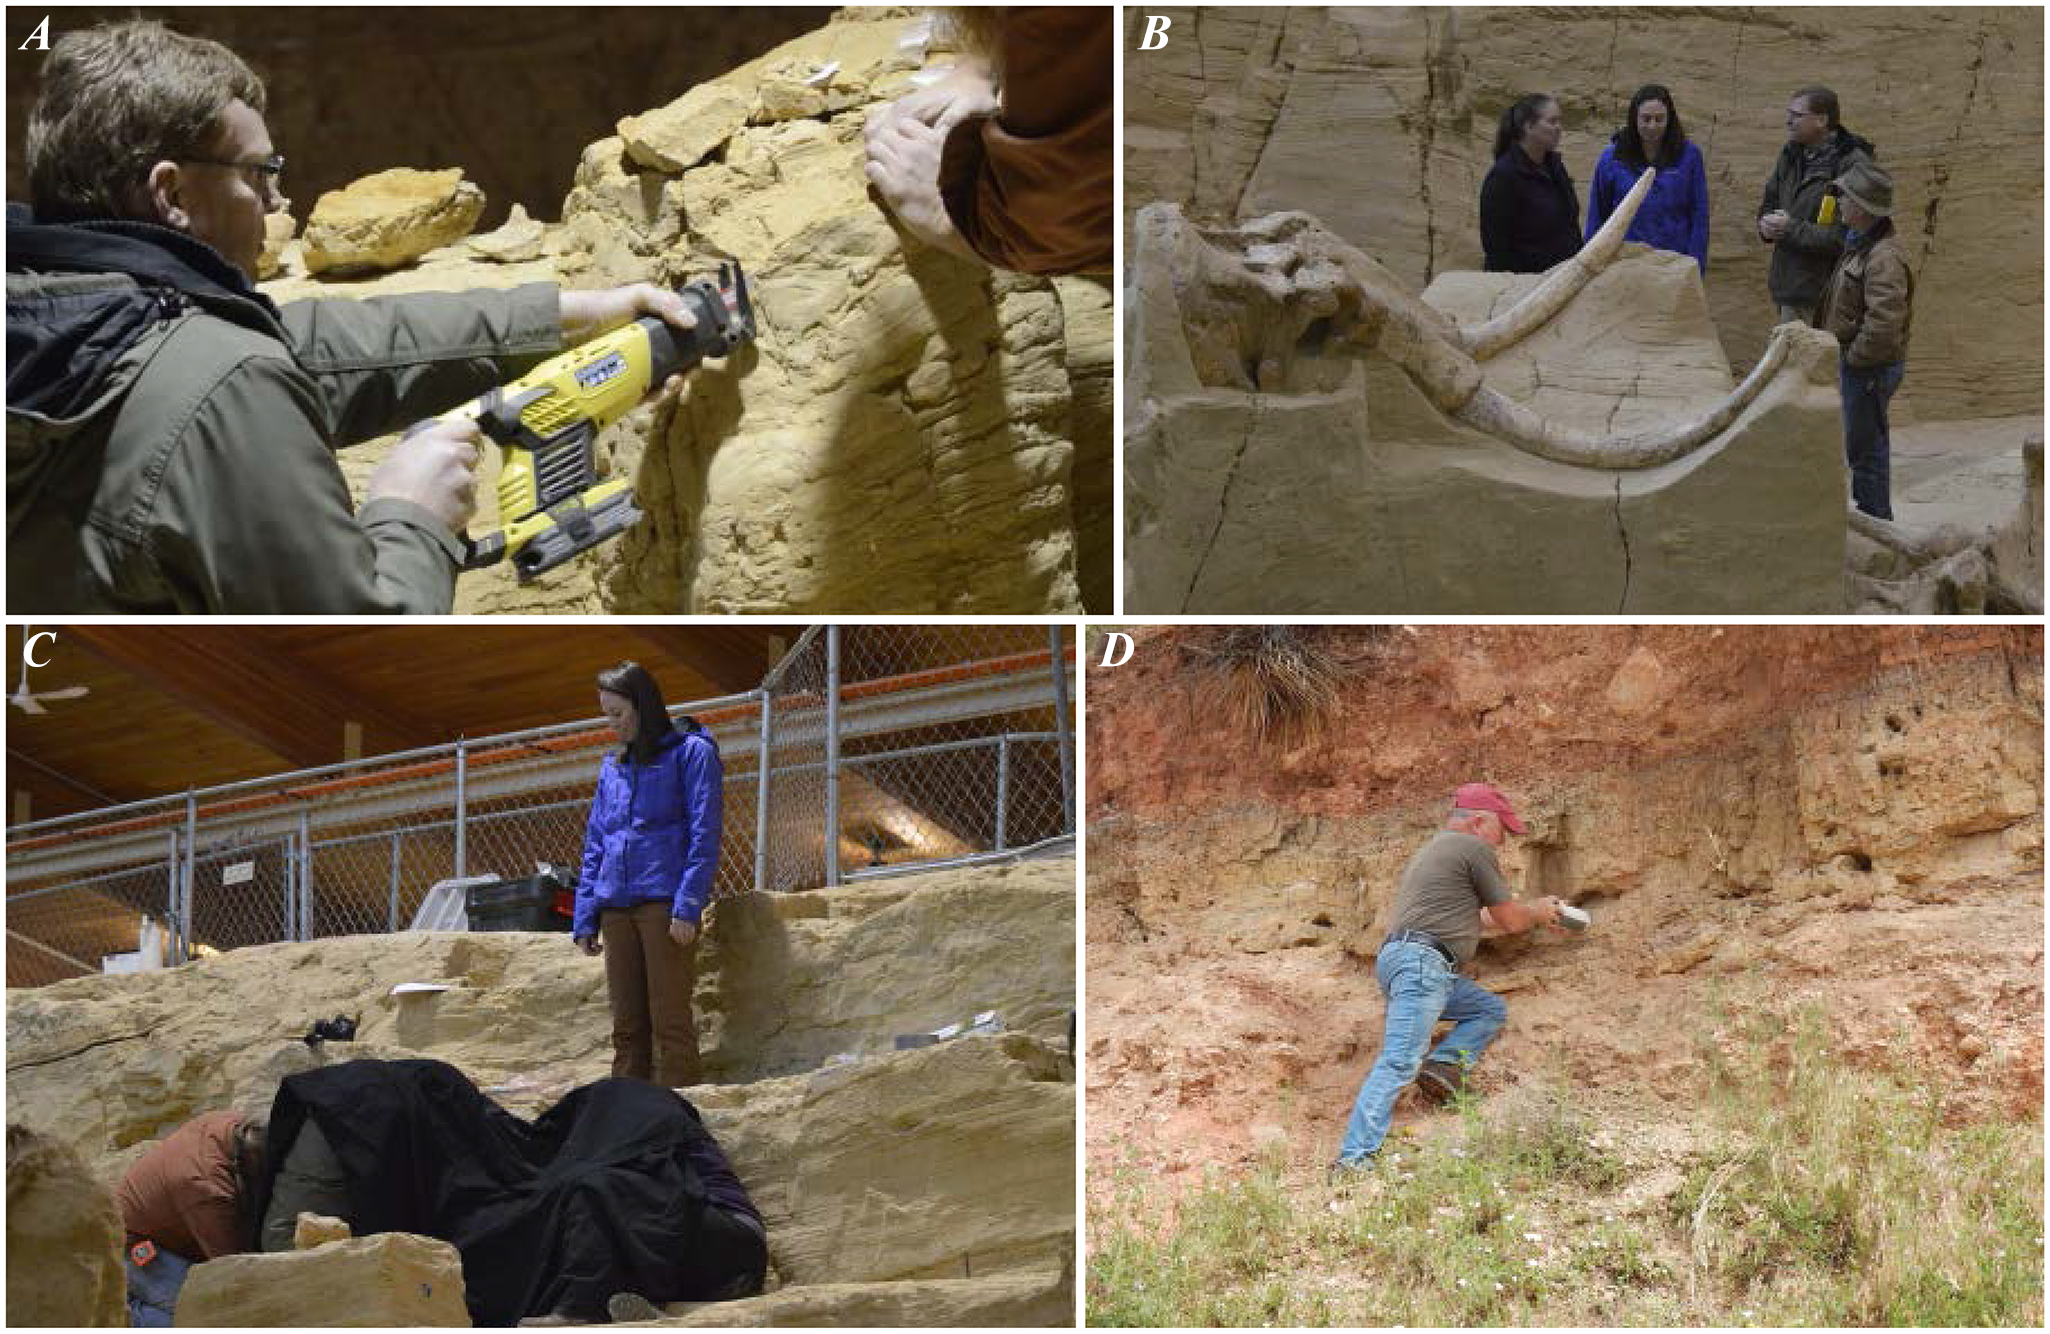
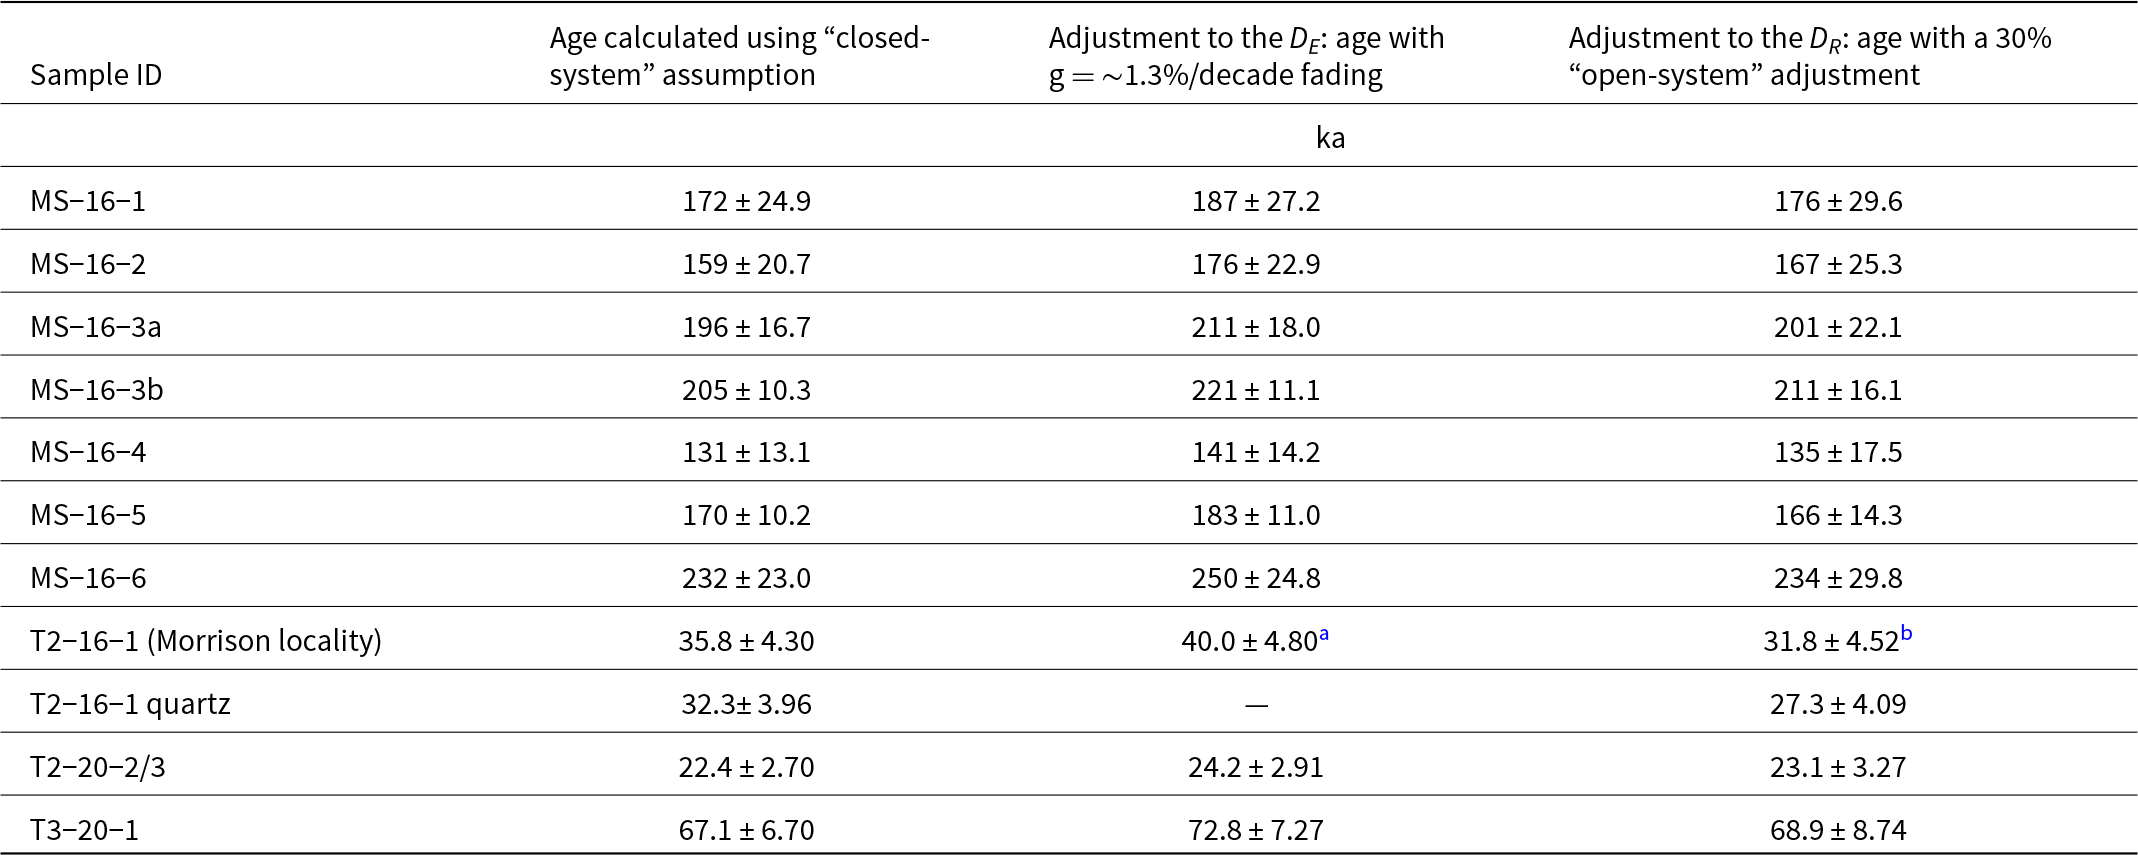
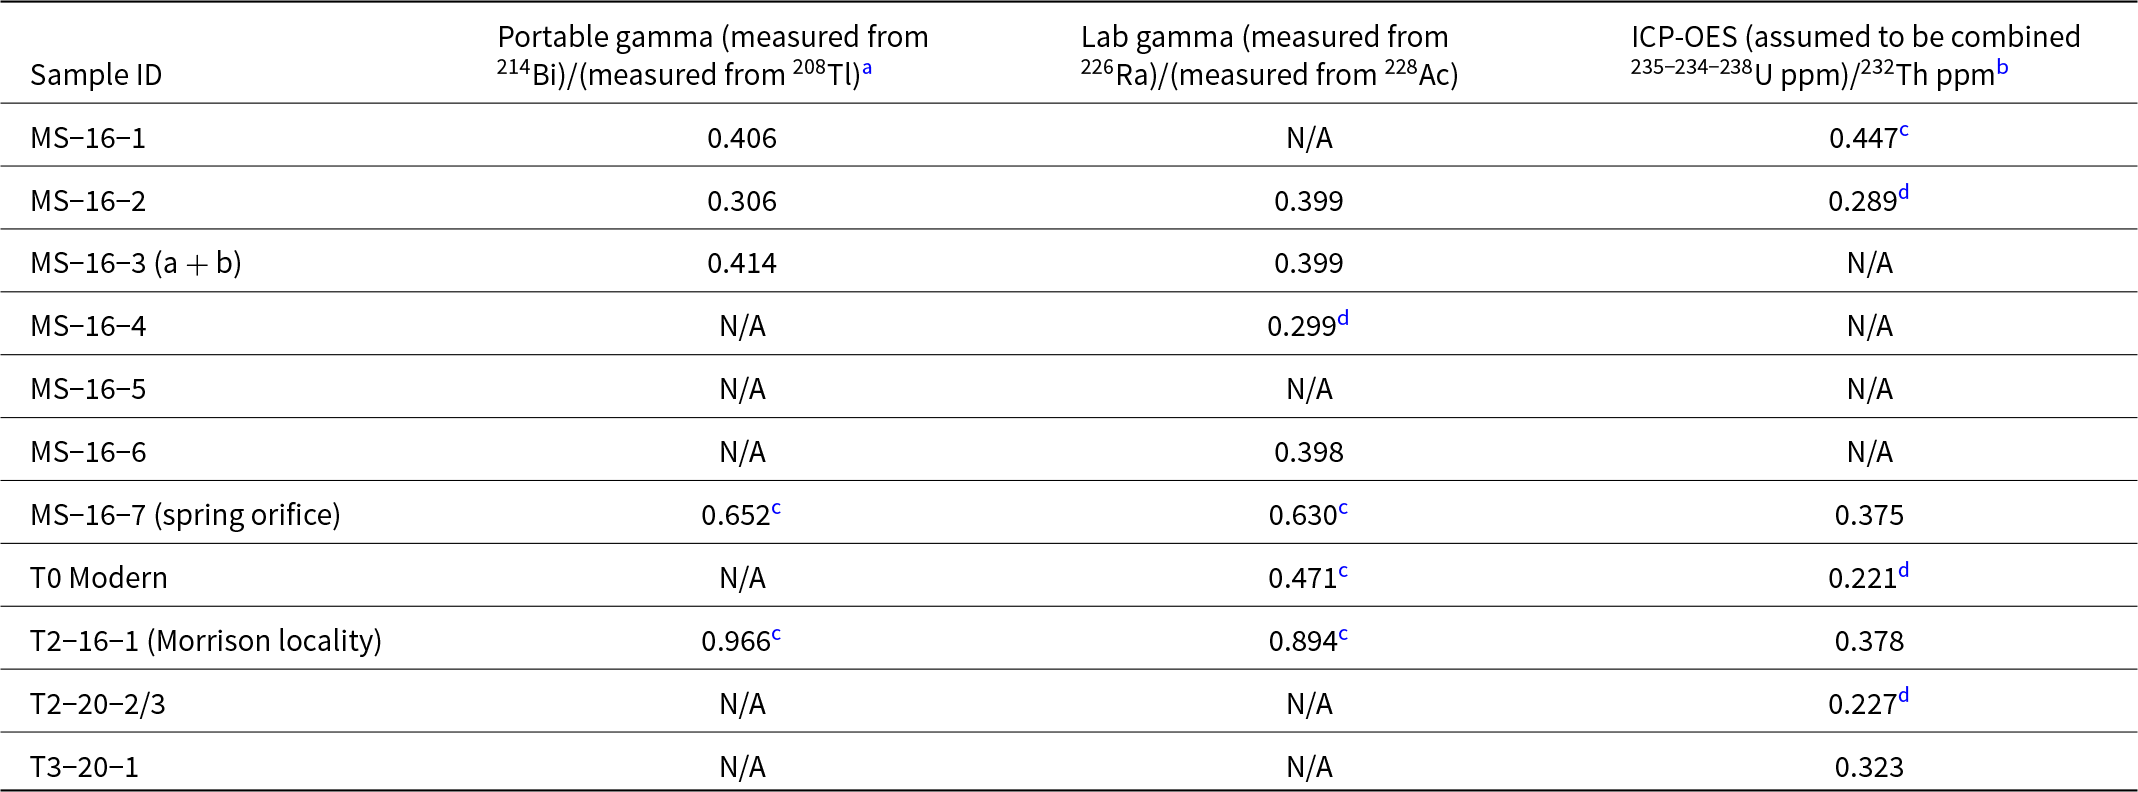
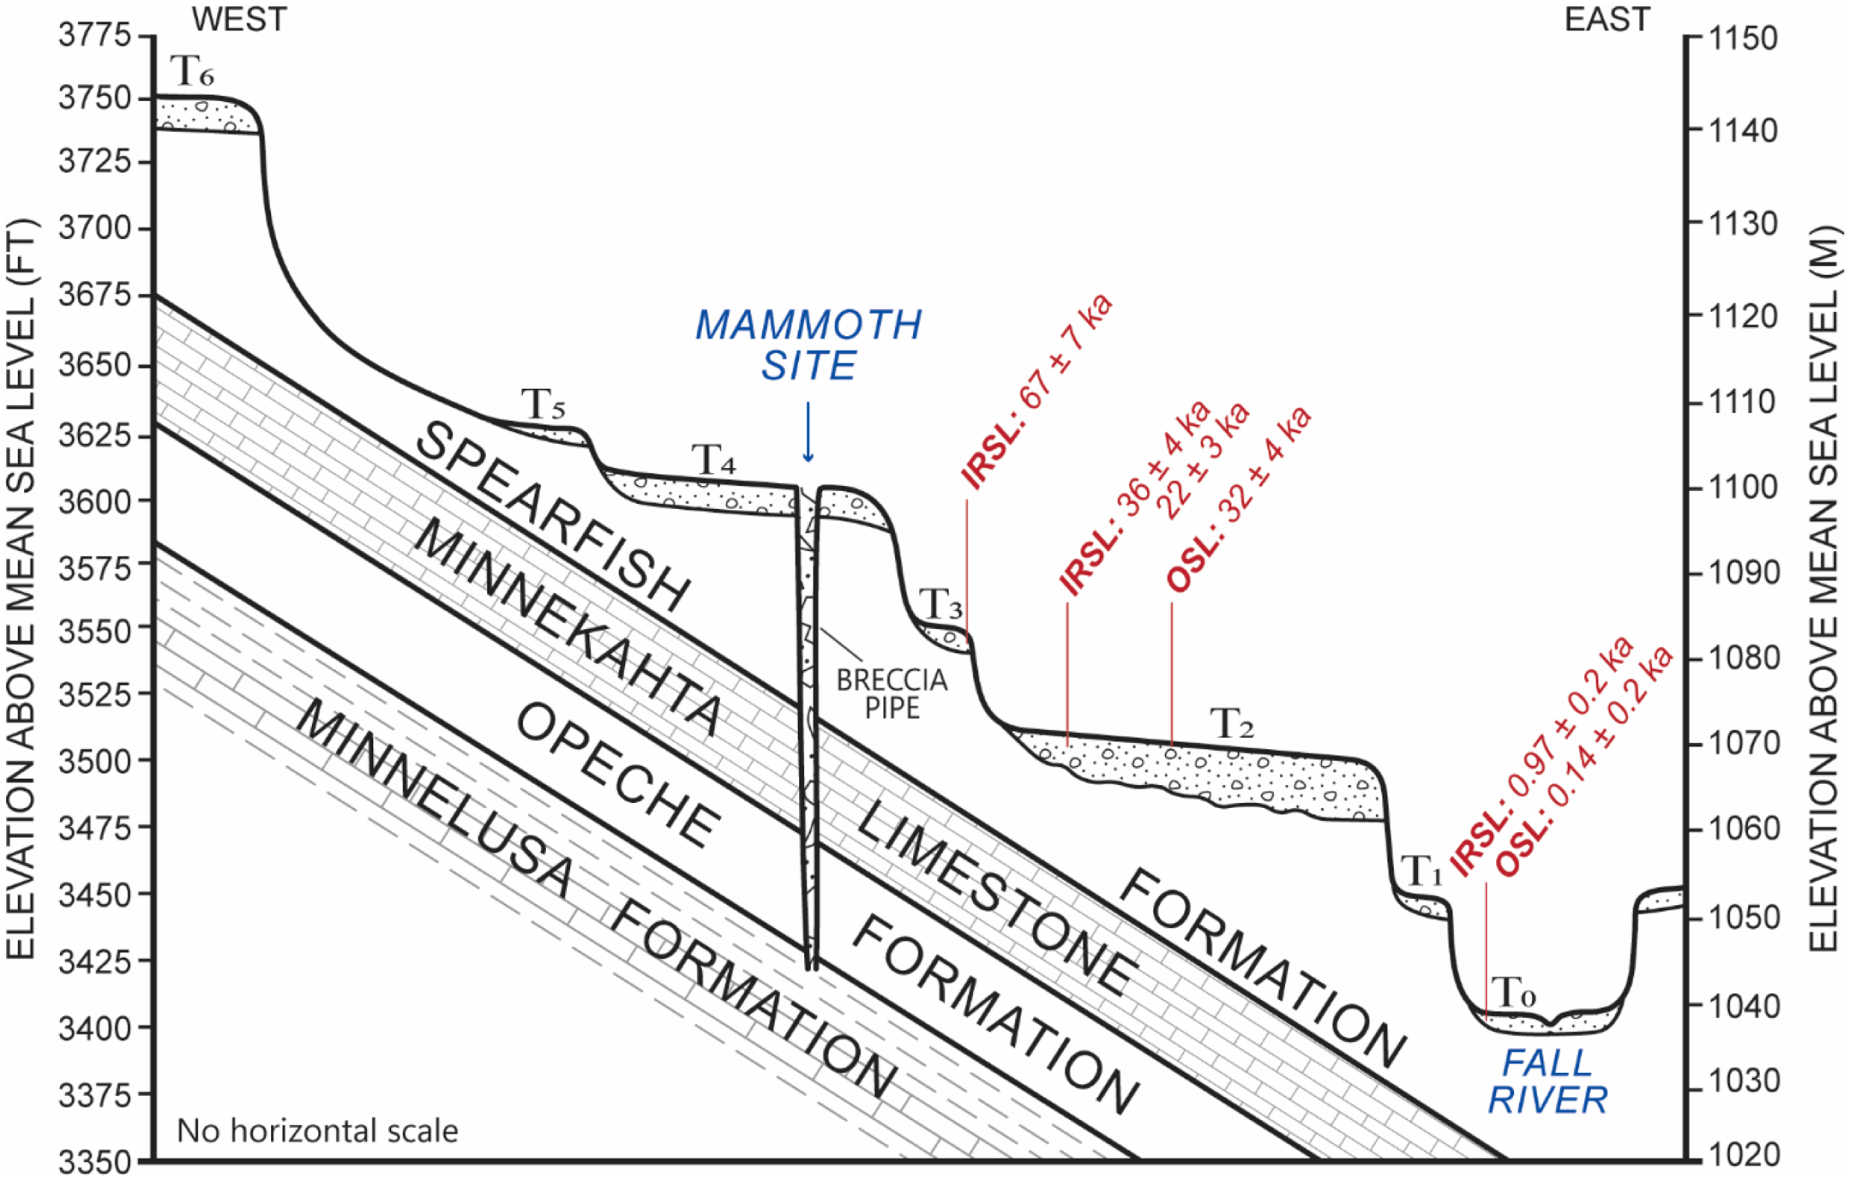


 Open access

