During emergencies and disasters, point-of-care testing (POCT) facilitates patient triage with rapid screening and monitoring tests at the site of care, such as the field, an alternate care facility, or an emergency department.Reference Kost, Tran, Tuntideelert, Kulrattanamaneeporn and Peungposop1 Emergency responders need to be prepared to manage acute diseases and injuries, such as infections and trauma, and provide care for displaced victims with chronic ailments, such as diabetes.
POCT devices, such as glucose meter systems (GMS), are found in caches of disaster response teams. During Hurricane Katrina, shortages of diabetes supplies (eg, medicine, glucose test strips and meters) have been reported.Reference Cefalu, Smith, Blonde and Fonseca2 Emergency responders are deployed to a variety of environments where conditions often may exceed the reagent and device storage and operating tolerance limits.
We hypothesize that dynamic temperature and humidity stresses affect the performance of glucose meter test strips. Therefore, the objective of this report is to characterize the performance of two commercial glucose test strips using a dynamic stress profile that models conditions in New Orleans during Hurricane Katrina.
METHODS
Point-of-Care Systems and Reagents
GMS1 is a glucose oxidase-based electrochemical meter system, and GMS2 is a glucose dehydrogenase-based meter system. Glucose meters and aqueous quality control solutions (QC) were stored and operated within manufacturer's specifications, at room temperature (19.7 ± 0.6°C, range 18.8 to 23.0°C) and at relative humidity (46.4 ± 12.8%, range 21% to 77%). A subset of single-use disposable reagent test strips from each GMS was stressed with an environmental testing chamber (Tenney T2RC, Thermal Products Solution) that was programmed to simulate conditions during Hurricane Katrina. Stressed strips were tested immediately after removal from the chamber in pairs with control (unstressed) strips. Control strips were stored at room temperature.
We used aqueous QC solutions supplied by the manufacturers to test performance. QC solutions are proprietary reagents manufactured by each company to allow the operator to check if the test strips and meter are working properly. The QC solutions typically are composed of glucose, buffer, dyes, salts, preservatives, and viscosity-adjusting agents. Three levels of QC were used for testing GMS1, and two levels of QC were used for testing GMS2.
Environmental Profile
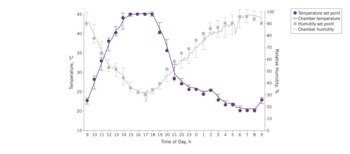
We modeled the dynamic thermal and humidity conditions of New Orleans, Louisiana, during Hurricane Katrina (Figure 1) with data collected over a 31-day period from the National Climatic Data Center (NCDC). Data were compiled from two weather stations, New Orleans/Moisant and Baton Rouge Metro. The Baton Rouge station supplied 1.5 days of missing values for the New Orleans/Moisant data set when the station was not operational. Temperature and humidity data were collected seven days before the Hurricane made landfall, the day of landfall, and the 23 days thereafter. The timeframe was selected to cover conditions during preparation, staging, rescue, and response phases of the disaster.
24-Hour Dynamic Thermal and Humidity Profile Modeling Conditions During Hurricane Katrina in New Orleans, Louisiana.

The highest temperature and corresponding humidity readings were collected for each hour per day. The median temperature and humidity were calculated for each hour from data collected over 31 days. The highest point of the profile was stretched to include temperature of 45°C (113°F) to simulate highs that may be encountered inside buildings, and at the lowest point down to 20°C (68°F) to simulate room temperature. Humidity oscillated from 31% to 96% within a 24-hour period. The profile was programmed and executed on the Tenney chamber.
Experimental Design
We performed three identical trials on each QC level for each GMS. Each trial consisted of a 24-hour profile (Figure 1), which is cycled 28 times, for a total duration of 680 hours. At the start of each experimental trial, a set of test strips were placed into the chamber at time 0 for stressing. At defined stress duration time points, five stressed strips for each meter system were removed for each QC level and tested in pairs with five control strips. The time points represent stress durations of 8, 24, 32, 72, 80, 168 hours (1 week), 176, 336 (2 weeks), 344, 672 (4 weeks), and 680 hours. For the three trials, a total of 15 pairs of measurements were collected for each QC level at each time point. The testing order was randomized for the pairs (control vs stress) and the QC level to minimize systematic bias.
Testing of the stressed strips occurred at two points in the profile, which allowed us to investigate whether differences in temperature (45°C [113°F] vs 23°C [73°F]) affected measurements. At stress duration 24, 72, 168, 336, and 672 hours, the conditions inside the chamber corresponded to 23°C (73°F), with a humidity of 90%. At stress duration 8, 32, 80, 176, 344, and 680 hours, the internal temperature of the chamber was 45°C (113°F) and a humidity of 31%.
Data Analysis
We pooled the data from the three trials and calculated the mean, standard deviation (SD), and median differences of the measurement pairs (stress minus control) for each QC level and time point. Results were reported in both Système International and conventional units. To convert mg/dL to mmol/L, mmol/L = mg/dL × 0.05551. Median-paired difference plots, and mean-paired difference plots were developed. The maximum absolute differences (MaxAD) were plotted to describe the magnitude of error observed. The MaxAD approach plots the largest bias observed within the data set for each QC level and time point regardless of whether the error is positively or negatively biased.
Wilcoxon signed rank test analyzed the differences between stressed and control measurement pairs. Both analysis of variance (ANOVA) and Kruskal-Wallis tests were performed to determine whether the differences observed vary with the duration of stress. Statistically significant ANOVA tests were followed with a Tukey HSD multiple pairwise comparison, and Kruskal-Wallis tests with post hoc multiple pairwise comparisons using a Mann-Whitney test coupled to a Holm-Bonferroni adjustment. In addition, a Mann-Whitney test was used to analyze differences between paired observations measured at two different temperature points on the profile, 45°C (113°F) vs 23°C (73°F).
RESULTS
QC Glucose Levels
The mean glucose concentration in the aqueous QC solutions was determined with unstressed strips. For GMS1, the concentration was 57.9 ± 6.4 mg/dL (median 61; range, 46 to 70 mg/dL; n = 179) with a coefficient of variation (CV) of 11.1% for QC level 1, 109.6 ± 8.5 (median 113; range, 91 to 124; n = 180) with CV of 7.8% for QC level 2, and 290.5 ± 18.6 (median 296.5; range, 240 to 330; n = 180) with CV of 6.4% for QC level 3. For GMS2, the mean glucose concentration was 41.0 ± 1.6 mg/dL (median 41; range, 35 to 44; n = 180) with CV of 3.8% for QC level 1, and 305.3 ± 7.5 mg/dL (median 306; range. 282 to 322; n = 180) with CV of 2.5% for QC level 2 on GMS2. QC testing at the beginning and end of each experimental day were within manufacturers’ expected ranges.
Effects of Dynamic Stress on GMS1
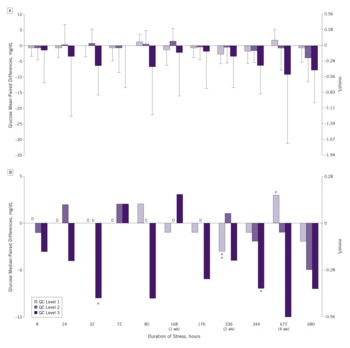
Measurements differed significantly with time between stressed and control strips for QC level 1 (P <. 01, Kruskal-Wallis; P <. 05, ANOVA). Tukey's multiple pairwise comparison showed that the mean-paired difference at 336 and 672 hours differed significantly from each other, while Mann-Whitney analysis with Bonferonni-Holm adjustment reported no significant comparisons. Figure 2A shows the glucose mean-paired differences by stress duration, and Figure 2B shows the glucose median-paired differences.
Effects of Dynamic Thermal Stress on GMS1 Glucose Test Strips.

Environmentally stressed test strips generated lower GMS1 results. The glucose median-paired difference was as much as −3 mg/dL (range, −10 to 4) for QC level 1, −5 mg/dL (range, −19 to 8) for QC level 2, and −10 mg/dL (range, −65 to 33) for QC level 3. Paired measurements between stressed and control test strips differed significantly after 32 hours (QC level 3, P <. 05), 336 (QC level 1, P <. 01), 344 (QC level 3, P <. 05), and 672 hours (QC level 1, P <. 05) of stress, with results lower than control in 3 of the 4 cases. Paired differences were not significantly different when testing occurred at the hottest point (45°C) in the profile vs at 23°C for both GMS1 and GMS2.
Effects of Dynamic Stress on GMS2
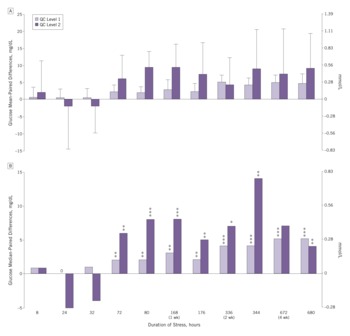
Figure 3A shows glucose mean-paired differences by stress duration, and Figure 3B shows glucose median-paired differences. Environmentally stressed test strips generated results that trended significantly higher compared to control after 72 hours in 15 of 16 cases (Figure 3B). Glucose median-paired difference was higher by as much as 5 mg/dL (range, −1 to 10) for QC level 1, and 14 mg/dL (range, −12 to 23) for QC level 2.
Effects of Dynamic Thermal Stress on GMS2 Glucose Test Strips.

Stress duration appears to significantly affect measurements in both QC test levels (P <. 001, Kruskal-Wallis; P <. 001, ANOVA). Multiple pairwise comparison showed that results differed between the subset of test strips stressed for a shorter duration (8, 24, and 32 hours) compared to those stressed for two weeks or longer (336, 344, 672, and 680 hours).
Median and Maximum Absolute Differences
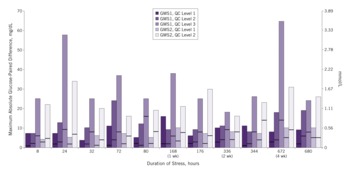
Figure 4 shows median and maximum absolute-paired differences for each GMS and QC level tested. For GMS1, the maximum absolute differences were 16 mg/dL for QC level 1 observed after 168 hours of stress, 24 mg/dL for QC level 2 after 72 hours, and 65 mg/dL for QC level 3 after 672 hours. These maximum absolute-paired differences reflect an error of 27.6% (16 mg/dL/57.9 mg/dL) when compared to the mean glucose concentration of 57.9 mg/dL for QC level 1, 21.9% (24/109.6) to mean glucose of 109.6 mg/dL for QC level 2, and 22.4% (65/290.5) to mean glucose of 290.5 mg/dL for QC level 3.
For GMS2, the maximum absolute-paired differences were 10 mg/dL for QC level 1 observed after stress duration of 168, 672, and 680 hours; and 34 mg/dL for QC level 2 after 24 hours. These differences reflect a 24.4% (10/41) error at baseline glucose of 41.0 mg/dL for QC level 1, and 11.1% (34/305.3) at baseline glucose of 305.3 mg/dL for QC level 2.
Maximum Absolute Glucose Differences Between Stressed and Control Test Strips.

DISCUSSION
To our knowledge, this study is the first to demonstrate the effects of dynamic stresses on the performance of POC glucose meter systems using weather profiles that model the austere conditions experienced in a disaster. Other studiesReference Haller, Shuster, Schatz and Melker3Reference King, Eigenmann and Colagiuri4Reference Louie, Sumner, Belcher, Mathew, Tran and Kost5Reference Bamberg, Schulman, MacKenzie, Moore and Olchesky6 confirmed the vulnerability of POC reagents, but did not model dynamic extremes in temperature and humidity. Our study showed that the duration of dynamic stress significantly affected the performance of both GMS systems. GMS2 stress strips produced elevated results compared to the unstressed strips after 72 hours. The pattern was reproduced in each of the experimental trials. Dynamic thermal and humidity exposure appears to have a cumulative effect on the test strips, whereby the effects become apparent after reaching a trigger point. If these observations suggest that damage to the strips result from cumulative thermal and humidity exposure, then emergency responders and medical response planners will need to carefully manage the exposure time of testing supplies in austere environments.
Erroneous results from compromised reagent test strips can cause serious harm and impact treatment decisions.Reference Haller, Shuster, Schatz and Melker3Reference King, Eigenmann and Colagiuri4 Measurement errors as much as 27.6% (16 mg/dL/57.9 mg/dL) were observed at a mean glucose concentration of 57.9 mg/dL on GMS1, and 21.9% (24/109.6) at a mean glucose concentration of 109.6 mg/dL. The magnitude of the errors at these levels could impact clinical actions. For example, an error of 16 mg/dL with a mean glucose of 57.9 mg/dL could possibly be reported as 16 mg/dL below (~ 42 mg/dL) or above (~ 74 mg/dL) the real glucose value. Falsely elevated results may give the impression of hyperglycemia and lead to unnecessary insulin dosing that could dangerously lower a patient's blood glucose level. Falsely lowered glucose results can give the impression of normoglycemia when insulin dosing may otherwise be warranted. To ensure delivery of quality test results, emergency responders need to be aware of temperature and humidity exposure limits of the medical supplies and take action to appropriately store and handle the supplies.
Management of chronic diseases such as diabetes is a challenge during crises. About 11% of the population living in the affected area of New Orleans and Jefferson parishes reportedly have diabetes.Reference Cefalu, Smith, Blonde and Fonseca2 Hurricane Katrina relief agencies were not prepared to mobilize diabetes care supplies (ie, glucose meters, test strips, insulin, and other medications) to meet the needs. Test reagents quickly were exhausted despite donations from manufacturers.Reference Cefalu, Smith, Blonde and Fonseca2 Cefalu et alReference Cefalu, Smith, Blonde and Fonseca2 recommend the stockpiling of diabetes-related or disease-focused supplies to enhance readiness for deployment after disaster or evacuation. However, stockpiling temperature-sensitive supplies can present a logistical challenge, particularly in how to ensure and maintain their integrity and stability during deployment.
Enzyme degradation of the test strips from thermal perturbation may explain the altered test performance. Commercial glucose test strips use glucose oxidase and glucose dehydrogenase enzymes. Studies have examined the thermal stability of these enzymes.Reference O’Malley and Ulmer7Reference Zoldák, Zubrik, Musatov, Stupák and Sedlák8Reference Gouda, Singh, Rao, Thakur and Karanth9Reference Ye and Combes10 Thermal perturbation inactivates glucose oxidase by causing the dissociation of the flavin adenine dinucleotide (FAD) cofactors and the subsequent loss of secondary and tertiary structures.Reference O’Malley and Ulmer7Reference Zoldák, Zubrik, Musatov, Stupák and Sedlák8Reference Gouda, Singh, Rao, Thakur and Karanth9 O’Malley and UlmerReference O’Malley and Ulmer7 reported observing a 60% reduction in enzyme activity after four hours at 45°C.Reference O’Malley and Ulmer7 This finding may explain the lowered results with GMS1. Likewise, thermodeactivation of glucose dehydrogenase has been attributed to the dissociation of pyrroloquinoline quinine cofactors.Reference Geiger and Görisch11 One would expect similar lowering of glucose measurement, but instead results were elevated with GMS2. We speculate that the elevated results could be attributed to humidity or a combination of factors.
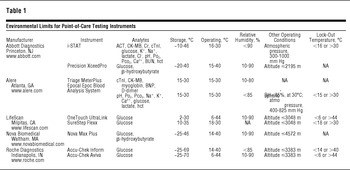
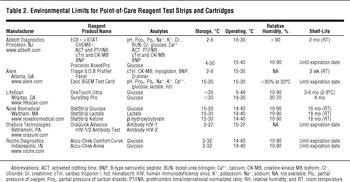
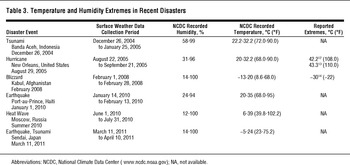
Manufacturers provide narrow temperature and humidity storage ranges for POCT reagents and instruments that often are exceeded by weather conditions during emergencies and disasters. Table 1 and Table 2 summarize the storage and operating specifications of a few POCT instruments and reagents. Table 3 summarizes the conditions observed during recent disaster events. The temperature and humidity may be much higher inside buildings, especially those with poor ventilation. During Hurricane Katrina, medical equipment failuresReference Barkemeyer15Reference Bernard and Mathews16 were documented due in part to damaged power infrastructure and the subsequent loss of temperature maintenance capabilities such as air conditioning.
Environmental Limits for Point-of-Care Testing Instruments

Environmental Limits for Point-of-Care Reagent Test Strips and Cartridges

Temperature and Humidity Extremes in Recent Disasters

In addition to careful monitoring of reagent supplies, immediate short- and long-term solutions are needed to better protect reagent test strips against austere environments. Long-term solutions may include re-engineering test strips with thermally-stable enzymes and materials appropriate for extreme hot and cold. Short-term solutions may include improved packaging such as moisture barriers, and incorporation of low conductance and high reflectance materials to reduce heat loading. In the recent disaster in Haiti, emergency responders reported failure of a POC whole blood analyzer (i-STAT, Abbott Diagnostics) to operate because of the high ambient temperature (35°C).Reference Vanholder, Borniche and Claus17 One of the response teams devised a cold box to keep the instrument cool so that it could be operated (Noel Gibney, MD, written communication).Reference Vanholder, Borniche and Claus17 Emergency responders also can immediately protect their supplies by carefully planning the mobilization and resupply schedule to limit reagent exposure time to the austere environments.
Study Limitations
In this study, the experimental test profile models the conditions of one specific natural disaster. Climate data from a single weather station can possibly lead to errors associated with microclimates and equipment bias. This study reports the combined effect of temperature and humidity and does not isolate the individual effects. In future studies, we will run other weather profiles, which now are available.Reference Ferguson, Louie, Yu, Sumner and Kost18
Conclusions and Recommendations
Dynamic stresses affected the performance of glucose test strips. Stressed test strips reported lower results on GMS1,and higher results with GMS2, compared to the control. The duration of stress is a confounding factor affecting the performance of both GMS1 and GMS2 glucose test strips, with elevated results after 72 hours on GMS2. Therefore, proper monitoring, handling, and storage of the reagents are needed to ensure the integrity of the test reagents and to assure the quality of results when operated in emergencies and disasters.
We recommend the following to ensure the quality of test results with POCT in disaster settings:
• Know the effects of environmental stresses on POCT reagents and understand how the duration of stress affects the performance.
• Establish standards for testing and validating the performance of the POCT reagents and devices using dynamic stresses encountered in field settings.
• Monitor reagents for exposure to high and low temperature or humidity while in storage or transit.
• Assure proper handling and storage of test reagents to preserve reagent integrity.
• Develop robust reagents and packaging to protect medical supplies from adverse environmental conditions.
• Plan deployment and resupply schedules for medical supplies, such as reagent test strips, to minimize the length of exposure to adverse conditions.
Funding: This research was supported by a grant from the National Institute of Biomedical Imaging and Bioengineering (NIBIB), National Institutes of Health (U54EB007959, Principal Investigator, Dr Kost). The content is solely the responsibility of the authors and does not necessarily represent the official views of NIBIB or the National Institutes of Health. Industry-donated reagents and instruments were used for the project. Tables and figures were provided with courtesy and permission of Knowledge Optimization®.
Acknowledgments: Members of the Meteorological Advisory Board: Uma Bhatt, PhD, University of Alaska Fairbanks; Vasu Misra, PhD, Florida State University; John Nielsen-Gammon, PhD, Texas A&M University; Kyaw Tha Paw U, PhD, University of California Davis; and Michael Richman, PhD, University of Oklahoma; provided critique on the dynamic profile used in this study. Professor Paw U contributed use of the profile stretching method.