1 Introduction
The statistics of velocity gradients in isotropic turbulence is of both practical and theoretical importance in the study of turbulent flows (Sreenivasan & Antonia Reference Sreenivasan and Antonia1997; Wallace Reference Wallace2009). The hypothesis of approximate local isotropy at sufficiently high Reynolds number (Kolmogorov Reference Kolmogorov1941) provides an important framework for exploring the universality of small-scale statistics, including velocity gradients, across a wide range of flows. It is well accepted that the dynamics of turbulence, including velocity gradients, can be better understood in a Lagrangian frame following the flow (Falkovich, Gawedski & Vergassola Reference Falkovich, Gawedski and Vergassola2001; Toschi & Bodenschatz Reference Toschi and Bodenschatz2009). Also, in many practical situations, the velocity gradient along Lagrangian or inertial particle paths determines the dynamics of sub-Kolmogorov-scale objects immersed in turbulent flows, such as the deformation and break-up of bubbles and immiscible drops (Biferale, Scagliarini & Toschi Reference Biferale, Scagliarini and Toschi2010; Maniero et al. Reference Maniero, Masbernat, Climent and Risso2012; Biferale, Meneveau & Verzicco Reference Biferale, Meneveau and Verzicco2014), the stretching of polymers (Balkovsky, Fouxon & Lebedev Reference Balkovsky, Fouxon and Lebedev2000; Chertkov Reference Chertkov2000; Bagheri et al. Reference Bagheri, Mitra, Perlekar and Brandt2012), the rotation rate and nutrient uptake of small swimming organisms (Batchelor Reference Batchelor1980; Pedley & Kessler Reference Pedley and Kessler1992; Karp-Boss, Boss & Jumars Reference Karp-Boss, Boss and Jumars1996; Parsa et al. Reference Parsa, Calzavarini, Toschi and Voth2012; Chevillard & Meneveau Reference Chevillard and Meneveau2013) and haemolysis in red blood cells (Arora, Behr & Pasquali Reference Arora, Behr and Pasquali2004; Behbahani et al. Reference Behbahani, Behr, Hormes, Steinseifer, Arora, Coronado and Pasquali2009; De Tullio et al. Reference De Tullio, Nam, Pascazio, Balaras and Verzicco2012), among other applications.
Meanwhile, from a theoretical perspective, the statistics of velocity gradients and increments in isotropic turbulence are key ingredients in exploring internal intermittency and multi-fractality (Kolmogorov Reference Kolmogorov1962; Oboukhov Reference Oboukhov1962; Parisi & Frisch Reference Parisi, Frisch, Ghil, Benzi and Parisi1985; Meneveau & Sreenivasan Reference Meneveau and Sreenivasan1991). In recent decades, the Lagrangian view of intermittency in turbulence has become a topic of increasing interest (Falkovich et al. Reference Falkovich, Gawedski and Vergassola2001; Toschi & Bodenschatz Reference Toschi and Bodenschatz2009). The energy cascade has been posed in the Lagrangian frame (Meneveau & Lund Reference Meneveau and Lund1994; Yu & Meneveau Reference Yu and Meneveau2010) and Lagrangian multi-fractality has been explored (Boffetta, De Lillo & Musacchio Reference Boffetta, De Lillo and Musacchio2002; Chevillard et al. Reference Chevillard, Roux, Leveque, Mordant, Pinton and Arneodo2003; Biferale et al. Reference Biferale, Boffetta, Celani, Devenish, Lanotte and Toschi2004, Reference Biferale, Bodenschatz, Cencini, Lanotte, Ouellette, Toschi and Xu2008; Arnèodo et al. Reference Arnèodo, Benzi, Berg, Biferale, Bodenschatz, Busse, Calzavarini, Castaing, Cencini and Chevillard2008). While analysis methods for dynamical systems are often impractical because of the high-dimensionality of turbulent flows (Frisch Reference Frisch1995), tools such as finite-time Lyapunov exponents are useful in the Lagrangian frame for studying chaotic advection (Ottino Reference Ottino1989) and coherent structures (Haller Reference Haller2000; Haller & Yuan Reference Haller and Yuan2000; Green, Rowley & Haller Reference Green, Rowley and Haller2007; Haller Reference Haller2015). In addition to the velocity gradient, the coarse-grained or perceived velocity gradient has been used to explore scale-dependent properties of small-scale turbulence (Chertkov, Pumir & Shraiman Reference Chertkov, Pumir and Shraiman1999; Pumir, Bodenschatz & Xu Reference Pumir, Bodenschatz and Xu2013).
The evolution of velocity gradients along Lagrangian paths contains two unclosed terms requiring models: the deviatoric part of the pressure Hessian and the viscous Laplacian. Removal of these two terms results in the restricted Euler equation, which has the unfortunate property of leading to a finite-time singularity (Vieillefosse Reference Vieillefosse1982, Reference Vieillefosse1984; Cantwell Reference Cantwell1992). The term driving the singularity is the quadratic self-amplification of velocity gradients that is kinematic in nature. The unclosed terms are evidently responsible for opposing the restricted Euler singularity. A number of studies have shed some light on the dynamics of velocity gradients along Lagrangian paths, exploring invariant spaces and the unclosed terms (Nomura & Post Reference Nomura and Post1998; Martin et al. Reference Martin, Ooi, Chong and Soria1998b ; Ooi et al. Reference Ooi, Martin, Soria and Chong1999; Lüthi, Holzner & Tsinober Reference Lüthi, Holzner and Tsinober2009; Lawson & Dawson Reference Lawson and Dawson2015).
Meanwhile, as reviewed in Meneveau (Reference Meneveau2011), attempts at closure models for the ordinary differential equation (ODE) governing the Lagrangian evolution of the velocity gradient tensor have enjoyed some success. The addition of a linear relaxation term eliminates the singularity for some initial conditions, but not for all (Martin, Dopazo & Valino Reference Martin, Dopazo and Valino1998a
). Girimaji & Pope (Reference Girimaji and Pope1990) introduced a model for the pressure Hessian and viscous Laplacian designed to reproduce log-normal statistics for the pseudo-dissipation by construction. Jeong & Girimaji (Reference Jeong and Girimaji2003) constructed a nonlinear relaxation model for the viscous Laplacian using the trace of the inverse Cauchy–Green tensor, neglecting the deviatoric part of the pressure Hessian. Chevillard & Meneveau (Reference Chevillard and Meneveau2006) and Chevillard et al. (Reference Chevillard, Meneveau, Biferale and Toschi2008) used the insight of Jeong and Girimaji’s viscous Laplacian and the tetrad model of Chertkov et al. (Reference Chertkov, Pumir and Shraiman1999) to introduce the recent fluid deformation (RFD) approximation, providing closure for both the viscous Laplacian and the deviatoric part of the pressure Hessian. The underlying concept in the RFD model is that the conditional pressure Hessian can be approximated by considering an initially isotropic tensor subjected to fluid deformation for a short time using a constant velocity gradient. It was demonstrated that the RFD closure was able to prevent the singularity and the resulting system could thus reproduce many well-known velocity gradient characteristics, including trends over a small range of moderate
 $Re_{\unicode[STIX]{x1D706}}$
(Chevillard & Meneveau Reference Chevillard and Meneveau2006; Chevillard et al.
Reference Chevillard, Meneveau, Biferale and Toschi2008; Chevillard & Meneveau Reference Chevillard and Meneveau2011). Increasing the Reynolds number further, however, led to unphysical results, which were studied in some detail (Martins-Afonso & Meneveau Reference Martins-Afonso and Meneveau2010). Meanwhile, Suman & Girimaji (Reference Suman and Girimaji2009, Reference Suman and Girimaji2011) have worked on a similar modelling approach for the Lagrangian velocity gradient evolution in compressible flows.
Wilczek & Meneveau (Reference Wilczek and Meneveau2014) took a different approach to closure, using a Gaussian fields (GF) assumption to compute directly the conditional averages of the deviatoric part of the pressure Hessian and viscous Laplacian in incompressible, isotropic turbulence. When using the resulting pressure Hessian from the GF model, however, Wilczek & Meneveau (Reference Wilczek and Meneveau2014) found that the model was too weak to prevent the singularity. To make the model work, the Gaussian-derived coefficients were tuned empirically using stochastic estimation based on DNS data. The resulting enhanced Gaussian fields (EGF) closure with the fitted parameters provided good predictions of velocity gradient statistics, rivalling those of the RFD model.
The GF closure thus elucidated an important point, that even in an isotropic Gaussian velocity field, the conditional pressure Hessian tensor is not an isotropic tensor. In this paper, we propose that the initial conditions for a recent-deformation closure are better represented by those of an isotropic Gaussian velocity field than by assuming an isotropic tensor, as in the RFD closure. With this insight, we develop a new pressure Hessian and viscous Laplacian model based on a recent-deformation mapping closure for incompressible turbulence that assumes the initial condition of the mapping to be an isotropic Gaussian velocity field.
More detailed background on the RFD and GF/EGF closures is presented briefly in § 2. Following that, the new model based on recent deformations of Gaussian fields is introduced and explained in § 3. After a brief explanation in § 4 of numerical methods for the stochastic ODEs and for the DNS data to which results are compared, an examination of results is given in § 5. The results of the new model are compared alongside RFD and EGF results with DNS data, and afterward appropriate conclusions are drawn.
2 Background
In this section, the equations for the Lagrangian evolution of the velocity gradient tensor are briefly summarized. After that, the closure approach based on the Fokker–Planck equation for the velocity gradient is reviewed. Within this paradigm, the prior RFD and GF closure models are explained.
2.1 Lagrangian velocity gradient evolution
In this paper, we consider incompressible, Newtonian fluids with arbitrary solenoidal forcing. The gradient of the incompressible Navier–Stokes equations gives the evolution equation for velocity gradient tensor,
 $\unicode[STIX]{x1D608}_{ij}=\unicode[STIX]{x2202}u_{i}/\unicode[STIX]{x2202}x_{j}$
,
 $$\begin{eqnarray}\frac{\text{d}\unicode[STIX]{x1D608}_{ij}}{\text{d}t}=-\unicode[STIX]{x1D608}_{ik}\unicode[STIX]{x1D608}_{kj}-\unicode[STIX]{x1D617}_{ij}+\unicode[STIX]{x1D708}\unicode[STIX]{x1D6FB}^{2}\unicode[STIX]{x1D608}_{ij}+f_{ij},\end{eqnarray}$$
where
 $\text{d}/\text{d}t=\unicode[STIX]{x2202}/\unicode[STIX]{x2202}t+u_{k}(\unicode[STIX]{x2202}/\unicode[STIX]{x2202}x_{k})$
represents the material derivative,
 $\unicode[STIX]{x1D617}_{ij}=\unicode[STIX]{x2202}^{2}p/\unicode[STIX]{x2202}x_{i}\unicode[STIX]{x2202}x_{j}$
is the symmetric pressure Hessian tensor and
 $f_{ij}$
is the trace-free gradient of the forcing. The first term on the right-hand side is the nonlinear self-amplification term, which leads to a finite time singularity in the restricted Euler dynamics (Vieillefosse Reference Vieillefosse1982, Reference Vieillefosse1984; Cantwell Reference Cantwell1992). While this self-amplification term is closed, the pressure Hessian and viscous Laplacian terms are unclosed, requiring information from neighbouring Lagrangian trajectories.
The incompressibility constraint, i.e. that the velocity gradient tensor should be trace free, can be incorporated by evaluating the trace of the velocity gradient evolution equation, which yields the pressure Poisson equation,
 $\unicode[STIX]{x1D617}_{kk}=2Q$
, where
 $Q\equiv -(1/2)\unicode[STIX]{x1D608}_{k\ell }\unicode[STIX]{x1D608}_{\ell k}$
. Solving the pressure Poisson equation and twice taking the gradient leads to (Ohkitani & Kishiba Reference Ohkitani and Kishiba1995)
 $$\begin{eqnarray}\unicode[STIX]{x1D617}_{ij}(\boldsymbol{x},t)=\frac{2}{3}Q(\boldsymbol{x},t)\unicode[STIX]{x1D6FF}_{ij}+\iiint _{P.V.}\frac{Q(\boldsymbol{x}+\boldsymbol{r})}{2\unicode[STIX]{x03C0}r^{3}}\left(\unicode[STIX]{x1D6FF}_{ij}-3\frac{r_{i}r_{j}}{r^{2}}\right)\text{d}\boldsymbol{r}.\end{eqnarray}$$
The isotropic part of the pressure Hessian is local and closed, while the deviatoric part of the pressure Hessian,
 $\unicode[STIX]{x1D617}_{ij}^{(d)}$
, is non-local and depends on the structure of the surrounding flow. Decomposition into isotropic and deviatoric parts gives
 $$\begin{eqnarray}\frac{\text{d}\unicode[STIX]{x1D608}_{ij}}{\text{d}t}=-\left(\unicode[STIX]{x1D608}_{ik}\unicode[STIX]{x1D608}_{kj}+\frac{2}{3}Q\unicode[STIX]{x1D6FF}_{ij}\right)-\unicode[STIX]{x1D617}_{ij}^{(d)}+\unicode[STIX]{x1D708}\unicode[STIX]{x1D6FB}^{2}\unicode[STIX]{x1D608}_{ij}+f_{ij}.\end{eqnarray}$$
This tensor equation represents 9 differential equations for the 9 components of the velocity gradient tensor, of which 8 are independent.
The velocity gradient tensor can be written as a sum of symmetric and anti-symmetric parts,
 $\unicode[STIX]{x1D608}_{ij}=\unicode[STIX]{x1D61A}_{ij}+\unicode[STIX]{x1D734}_{ij}$
, where
 $\unicode[STIX]{x1D61A}_{ij}=(\unicode[STIX]{x1D608}_{ij}+\unicode[STIX]{x1D608}_{ji})/2$
is the strain-rate tensor and
 $\unicode[STIX]{x1D734}_{ij}=(\unicode[STIX]{x1D608}_{ij}-\unicode[STIX]{x1D608}_{ji})/2$
is the rotation-rate tensor, which can be related to the vorticity,
 $\unicode[STIX]{x1D714}_{i}=-\unicode[STIX]{x1D716}_{ijk}\unicode[STIX]{x1D6FA}_{jk}$
. Using this decomposition on the Lagrangian evolution equation (Nomura & Post Reference Nomura and Post1998),
 $$\begin{eqnarray}\displaystyle \frac{\text{d}\unicode[STIX]{x1D61A}_{ij}}{\text{d}t} & = & \displaystyle -\left(\unicode[STIX]{x1D61A}_{ik}\unicode[STIX]{x1D61A}_{kj}-\frac{1}{3}\unicode[STIX]{x1D61A}_{k\ell }\unicode[STIX]{x1D61A}_{k\ell }\unicode[STIX]{x1D6FF}_{ij}\right)-\left(\unicode[STIX]{x1D6FA}_{ik}\unicode[STIX]{x1D6FA}_{kj}-\frac{1}{3}\unicode[STIX]{x1D6FA}_{ik}\unicode[STIX]{x1D6FA}_{kj}\unicode[STIX]{x1D6FF}_{ij}\right)\nonumber\\ \displaystyle & & \displaystyle -\,\unicode[STIX]{x1D617}_{ij}^{(d)}+\unicode[STIX]{x1D708}\unicode[STIX]{x1D6FB}^{2}\unicode[STIX]{x1D61A}_{ij}+f_{ij}^{(s)},\end{eqnarray}$$
 $$\begin{eqnarray}\frac{\text{d}\unicode[STIX]{x1D6FA}_{ij}}{\text{d}t}=-(\unicode[STIX]{x1D61A}_{ik}\unicode[STIX]{x1D6FA}_{kj}+\unicode[STIX]{x1D6FA}_{ik}\unicode[STIX]{x1D61A}_{kj})+\unicode[STIX]{x1D708}\unicode[STIX]{x1D6FB}^{2}\unicode[STIX]{x1D6FA}_{ij}+f_{ij}^{(a)},\end{eqnarray}$$
where
 $f_{ij}^{(s)}=(f_{ij}+f_{ji})/2$
and
 $f_{ij}^{(a)}=(f_{ij}-f_{ji})/2$
are the symmetric and anti-symmetric parts of the forcing, respectively. In this way, we can separately view the evolution of the vorticity and the strain rate, although the strong coupling in the nonlinear term is evident.
2.2 Stochastic model
In order to model the Lagrangian evolution of the velocity gradient, a stochastic representation is taken (Girimaji & Pope Reference Girimaji and Pope1990; Chevillard et al.
Reference Chevillard, Meneveau, Biferale and Toschi2008; Wilczek & Meneveau Reference Wilczek and Meneveau2014). The main idea is to split the unclosed terms into conditional means and fluctuations about these means, e.g.
 $\unicode[STIX]{x1D617}_{ij}=\langle \unicode[STIX]{x1D617}_{ij}|\boldsymbol{A}\rangle +\unicode[STIX]{x1D617}_{ij}^{\prime }$
. The conditional means can be closed through statistical approximations, while the fluctuations are modelled using Gaussian white noise. The resulting Langevin equation is
 $$\begin{eqnarray}\text{d}\unicode[STIX]{x1D608}_{ij}=\left[-(\unicode[STIX]{x1D608}_{ik}\unicode[STIX]{x1D608}_{kj}+{\textstyle \frac{2}{3}}Q\unicode[STIX]{x1D6FF}_{ij})-\langle \unicode[STIX]{x1D617}_{ij}^{(d)}\mid \boldsymbol{A}\rangle +\langle \unicode[STIX]{x1D708}\unicode[STIX]{x1D6FB}^{2}\unicode[STIX]{x1D608}_{ij}\mid \boldsymbol{A}\rangle \right]\text{d}t+\text{d}F_{ij},\end{eqnarray}$$
which provides a model for the Lagrangian velocity gradient dynamics provided the two conditional averages and the stochastic noise term can be specified. The stochastic forcing term,
 $\text{d}F_{ij}=\unicode[STIX]{x1D623}_{ijk\ell }\,\text{d}W_{kl}$
, is built on a tensorial Wiener process,
 $\langle \text{d}W_{ij}\rangle =0$
,
 $\langle \text{d}W_{ij}\,\text{d}W_{k\ell }\rangle =\unicode[STIX]{x1D6FF}_{ik}\unicode[STIX]{x1D6FF}_{j\ell }\,\text{d}t$
, with diffusion tensor
 $\unicode[STIX]{x1D60B}_{ijk\ell }=\unicode[STIX]{x1D623}_{ijmn}\unicode[STIX]{x1D623}_{k\ell mn}$
. This forcing term includes contributions both from large-scale forcing, i.e. for forced isotropic turbulence, and from fluctuations in the unclosed terms away from their conditional means, i.e. the ‘neighbouring eddy’ interpretation of Chevillard & Meneveau (Reference Chevillard and Meneveau2006), although the latter may be expected to be the dominant effect.
Furthermore, this tensorial stochastic ODE can be decomposed into symmetric and anti-symmetric components, as in (2.4) and (2.5),
 $$\begin{eqnarray}\displaystyle \text{d}\unicode[STIX]{x1D61A}_{ij}=\left[-(\unicode[STIX]{x1D61A}_{ik}\unicode[STIX]{x1D61A}_{kj}-{\textstyle \frac{1}{3}}\unicode[STIX]{x1D61A}_{k\ell }\unicode[STIX]{x1D61A}_{k\ell }\unicode[STIX]{x1D6FF}_{ij})-\left(\unicode[STIX]{x1D6FA}_{ik}\unicode[STIX]{x1D6FA}_{kj}-{\textstyle \frac{1}{3}}\unicode[STIX]{x1D6FA}_{ik}\unicode[STIX]{x1D6FA}_{kj}\unicode[STIX]{x1D6FF}_{ij}\right)\right. & & \displaystyle \nonumber\\ \displaystyle -\left.\langle \unicode[STIX]{x1D617}_{ij}^{(d)}|\unicode[STIX]{x1D64E},\unicode[STIX]{x1D734}\rangle +\langle \unicode[STIX]{x1D708}\unicode[STIX]{x1D6FB}^{2}\unicode[STIX]{x1D61A}_{ij}|\unicode[STIX]{x1D64E},\unicode[STIX]{x1D734}\rangle \right]\text{d}t+\text{d}F_{ij}^{(s)}, & & \displaystyle\end{eqnarray}$$
 $$\begin{eqnarray}\text{d}\unicode[STIX]{x1D6FA}_{ij}=[-(\unicode[STIX]{x1D61A}_{ik}\unicode[STIX]{x1D6FA}_{kj}+\unicode[STIX]{x1D6FA}_{ik}\unicode[STIX]{x1D61A}_{kj})+\langle \unicode[STIX]{x1D708}\unicode[STIX]{x1D6FB}^{2}\unicode[STIX]{x1D6FA}_{ij}|\unicode[STIX]{x1D64E},\unicode[STIX]{x1D734}\rangle ]\,\text{d}t+\text{d}F_{ij}^{(a)}.\end{eqnarray}$$
In this system,
 $\unicode[STIX]{x1D6FA}_{ij}$
has three independent variables with the requirement to remain anti-symmetric and
 $\unicode[STIX]{x1D61A}_{ij}$
has five independent variables with the requirement to remain symmetric and trace free. The symmetric and anti-symmetric stochastic forcing terms, in this view, can be chosen to be independent of each other and to obey these constraints. The details of the stochastic forcing term are given in appendix A.
The stochastic modelling approach produces the evolution equation for the single-time probability density function (PDF) for the velocity gradient tensor,
 $$\begin{eqnarray}\displaystyle \frac{\unicode[STIX]{x2202}f(\mathscr{A};t)}{\unicode[STIX]{x2202}t} & = & \displaystyle -\frac{\unicode[STIX]{x2202}}{\unicode[STIX]{x2202}\mathscr{A}_{ij}}\left(\left[-\left(\mathscr{A}_{ik}\mathscr{A}_{kj}+\frac{2}{3}\mathscr{Q}\unicode[STIX]{x1D6FF}_{ij}\right)-\langle \unicode[STIX]{x1D617}_{ij}^{(d)}|\mathscr{A}\rangle +\langle \unicode[STIX]{x1D708}\unicode[STIX]{x1D6FB}^{2}\unicode[STIX]{x1D608}_{ij}|\mathscr{A}\rangle \right]f(\mathscr{A};t)\right)\nonumber\\ \displaystyle & & \displaystyle +\,\frac{1}{2}\unicode[STIX]{x1D60B}_{ijk\ell }\frac{\unicode[STIX]{x2202}^{2}f(\mathscr{A};t)}{\unicode[STIX]{x2202}\mathscr{A}_{ij}\unicode[STIX]{x2202}\mathscr{A}_{k\ell }}.\end{eqnarray}$$
This Fokker–Planck equation for the PDF evolution matches that which can be constructed from (2.3), by adding stochastic forcing to represent the fluctuation of the unclosed terms.
2.3 Recent fluid deformation closure
The central idea in the RFD closure approach (Chevillard & Meneveau Reference Chevillard and Meneveau2006) is to introduce a coordinate mapping based on material volume deformation in the recent Lagrangian history. Defining a Lagrangian trajectory as a map,
 $\mathscr{T}_{t_{0},t}:\boldsymbol{X}\in \mathbb{R}^{3}\mapsto \boldsymbol{x}\in \mathbb{R}^{3}$
, from an initial condition
 $\boldsymbol{X}$
at time
 $t_{0}$
to a position
 $\boldsymbol{x}$
at a later time
 $t$
, then the Lagrangian trajectory evolves according to
 $\text{d}x_{i}/\text{d}t=u_{i}(\boldsymbol{x},t)$
, with initial condition
 $x_{i}(t_{0})=X_{i}$
, where the velocity field,
 $\boldsymbol{u}(\boldsymbol{x},t)$
, is a solution to the incompressible Navier–Stokes equations with appropriate boundary and initial conditions.
The evolution of an infinitesimal fluid volume in the vicinity of
 $\boldsymbol{x}$
can be described by the deformation tensor,
 $\unicode[STIX]{x1D60B}_{ij}=\unicode[STIX]{x2202}x_{i}/\unicode[STIX]{x2202}X_{j}$
, which is the sensitivity of the trajectory to initial position and evolves as
 $\text{d}\unicode[STIX]{x1D60B}_{ij}/\text{d}t=\unicode[STIX]{x1D608}_{ik}\unicode[STIX]{x1D60B}_{kj}$
with initial condition
 $\unicode[STIX]{x1D60B}_{ij}(\boldsymbol{X},t_{0})=\unicode[STIX]{x1D6FF}_{ij}$
. The general solution to this equation involves the time-ordered exponential, but with the approximation that the velocity gradient is constant for short time,
 $$\begin{eqnarray}\boldsymbol{D}(\boldsymbol{x},t;\boldsymbol{X},t_{0})\approx \exp [\boldsymbol{A}(\boldsymbol{x},t)(t-t_{0})].\end{eqnarray}$$
Instead of directly attempting to close the conditional averages in (2.6), first, the approximate fluid deformation tensor is used to strain the coordinate system,
 $$\begin{eqnarray}\langle \unicode[STIX]{x1D617}_{ij}\mid \boldsymbol{A}\rangle =\left\langle \left.\frac{\unicode[STIX]{x2202}^{2}p}{\unicode[STIX]{x2202}x_{i}\unicode[STIX]{x2202}x_{j}}\right|\boldsymbol{A}\right\rangle \approx \frac{\unicode[STIX]{x2202}X_{k}}{\unicode[STIX]{x2202}x_{i}}\left\langle \left.\frac{\unicode[STIX]{x2202}^{2}p}{\unicode[STIX]{x2202}X_{k}\unicode[STIX]{x2202}X_{\ell }}\right|\boldsymbol{A}\right\rangle \frac{\unicode[STIX]{x2202}X_{\ell }}{\unicode[STIX]{x2202}x_{j}}=\unicode[STIX]{x1D60B}_{ki}^{-1}\langle \widetilde{\unicode[STIX]{x1D617}}_{k\ell }|\boldsymbol{A}\rangle \unicode[STIX]{x1D60B}_{\ell j}^{-1},\end{eqnarray}$$
where
 $\widetilde{\unicode[STIX]{x1D617}}_{ij}$
represents an approximation for the pressure Hessian at a previous time along the Lagrangian path and
 $\unicode[STIX]{x1D60B}_{ij}^{-1}=\unicode[STIX]{x2202}X_{i}/\unicode[STIX]{x2202}x_{j}\approx (\exp [-\boldsymbol{A}(\boldsymbol{x},t)(t-t_{0})])_{ij}$
. This is akin to assuming the pressure to be approximately constant along pathlines for a short time (in the sense of conditional averages on
 $\boldsymbol{A}$
), so that the changes in the conditional pressure Hessian are due entirely to the relative movement of neighbouring fluid trajectories induced by the local velocity gradient. In this way, the closure of the conditional pressure Hessian requires the specification of initial conditions of the pressure Hessian upstream along the Lagrangian path.
The strongest assumption in the RFD model comes next, in assuming the initial condition for the mapping, i.e. the upstream conditional pressure Hessian, to be an isotropic tensor,
 $$\begin{eqnarray}\langle \widetilde{\unicode[STIX]{x1D617}}_{ij}\mid \boldsymbol{A}\rangle \approx {\textstyle \frac{1}{3}}\langle \widetilde{\unicode[STIX]{x1D617}}_{kk}|\boldsymbol{A}\rangle \unicode[STIX]{x1D6FF}_{ij},\end{eqnarray}$$
which gives
 $$\begin{eqnarray}\langle \unicode[STIX]{x1D617}_{ij}|\boldsymbol{A}\rangle \approx {\textstyle \frac{1}{3}}\unicode[STIX]{x1D60A}_{ij}^{-1}\langle \widetilde{\unicode[STIX]{x1D617}}_{kk}|\boldsymbol{A}\rangle .\end{eqnarray}$$
where
 $\unicode[STIX]{x1D60A}_{ij}^{-1}=\unicode[STIX]{x1D60B}_{ki}^{-1}\unicode[STIX]{x1D60B}_{kj}^{-1}$
is the inverse of the left Cauchy–Green tensor. The trace of (2.13),
 $$\begin{eqnarray}2Q=\langle \unicode[STIX]{x1D617}_{kk}|\boldsymbol{A}\rangle \approx {\textstyle \frac{1}{3}}\unicode[STIX]{x1D60A}_{kk}^{-1}\langle \widetilde{\unicode[STIX]{x1D617}}_{\ell \ell }|\boldsymbol{A}\rangle ,\end{eqnarray}$$
upon substitution, allows for the final form,
 $$\begin{eqnarray}\langle \unicode[STIX]{x1D617}_{ij}|\boldsymbol{A}\rangle \approx 2Q\frac{\unicode[STIX]{x1D60A}_{ij}^{-1}}{\unicode[STIX]{x1D60A}_{kk}^{-1}}.\end{eqnarray}$$
This form of the conditional pressure Hessian is appealing due to its simplicity and the intuition that the statistical bias of the pressure Hessian is related to the recent deformation of fluid particles by the velocity gradient tensor. However, as will be recalled later, even isotropic Gaussian velocity fields contain anisotropic contributions for the conditional pressure Hessian, casting some doubts regarding (2.12) above.
The RFD model treats the viscous Laplacian in the same way,
 $$\begin{eqnarray}\langle \unicode[STIX]{x1D708}\unicode[STIX]{x1D6FB}^{2}\unicode[STIX]{x1D608}_{ij}|\boldsymbol{A}\rangle \approx \unicode[STIX]{x1D708}\frac{\unicode[STIX]{x2202}X_{p}}{\unicode[STIX]{x2202}x_{k}}\left\langle \left.\frac{\unicode[STIX]{x2202}\unicode[STIX]{x1D608}_{ij}}{\unicode[STIX]{x2202}X_{p}\unicode[STIX]{x2202}X_{q}}\right|\boldsymbol{A}\right\rangle \frac{\unicode[STIX]{x2202}X_{q}}{\unicode[STIX]{x2202}x_{k}}=\unicode[STIX]{x1D708}\unicode[STIX]{x1D60B}_{pk}^{-1}\left\langle \left.\frac{\unicode[STIX]{x2202}\unicode[STIX]{x1D608}_{ij}}{\unicode[STIX]{x2202}X_{p}\unicode[STIX]{x2202}X_{q}}\right|\boldsymbol{A}\right\rangle \unicode[STIX]{x1D60B}_{qk}^{-1},\end{eqnarray}$$
and assumes that the conditional Hessian of the velocity gradient tensor is likewise an isotropic tensor,
 $$\begin{eqnarray}\left\langle \left.\frac{\unicode[STIX]{x2202}\unicode[STIX]{x1D608}_{ij}}{\unicode[STIX]{x2202}X_{k}\unicode[STIX]{x2202}X_{\ell }}\right|\boldsymbol{A}\right\rangle =\frac{1}{3}\langle \unicode[STIX]{x1D6FB}_{\boldsymbol{X}}^{2}\unicode[STIX]{x1D608}_{ij}|\boldsymbol{A}\rangle \unicode[STIX]{x1D6FF}_{k\ell },\end{eqnarray}$$
which yields
 $$\begin{eqnarray}\langle \unicode[STIX]{x1D708}\unicode[STIX]{x1D6FB}^{2}\unicode[STIX]{x1D608}_{ij}|\boldsymbol{A}\rangle \approx \frac{\unicode[STIX]{x1D60A}_{kk}^{-1}}{3}\unicode[STIX]{x1D708}\langle \unicode[STIX]{x1D6FB}_{\boldsymbol{X}}^{2}\unicode[STIX]{x1D608}_{ij}|\boldsymbol{A}\rangle .\end{eqnarray}$$
Then taking a linear relaxation model (Martin et al. Reference Martin, Dopazo and Valino1998a ) for the initial upstream conditions of the conditional viscous Laplacian,
 $$\begin{eqnarray}\langle \unicode[STIX]{x1D708}\unicode[STIX]{x1D6FB}^{2}\unicode[STIX]{x1D608}_{ij}|\boldsymbol{A}\rangle \approx -\frac{\unicode[STIX]{x1D60A}_{kk}^{-1}}{3}\frac{\unicode[STIX]{x1D608}_{ij}}{T}.\end{eqnarray}$$
In this way, the recent deformation provides a physically motivated mechanistic approach to introduce nonlinearity in the viscous Laplacian term, which is helpful in removing the finite-time singularity (the Cauchy–Green tensor is exponential rather than linear). Chevillard & Meneveau (Reference Chevillard and Meneveau2006) and Chevillard et al. (Reference Chevillard, Meneveau, Biferale and Toschi2008) argue that the proper relaxation time scale,
 $T$
, for the viscous Laplacian is the integral time scale, and that the proper time scale for the recent deformation is the Kolmogorov time scale,
 $t-t_{0}=\unicode[STIX]{x1D70F}_{\unicode[STIX]{x1D702}}$
. In this way, the model introduces
 $Re_{\unicode[STIX]{x1D706}}\sim (T/\unicode[STIX]{x1D70F}_{\unicode[STIX]{x1D702}})$
effects. Indeed, certain intermittency trends are reproduced by this model (Chevillard & Meneveau Reference Chevillard and Meneveau2006) at moderate
 $Re_{\unicode[STIX]{x1D706}}$
, but continuing to increase
 $Re_{\unicode[STIX]{x1D706}}$
beyond a certain threshold leads to increasingly unphysical results (Martins-Afonso & Meneveau Reference Martins-Afonso and Meneveau2010). Nonetheless, the RFD closure provides a model that reproduced many of the known trends of velocity gradient statistics at moderate
 $Re_{\unicode[STIX]{x1D706}}$
, and continues to be useful for studying velocity gradient statistics (Moriconi, Pereira & Grigorio Reference Moriconi, Pereira and Grigorio2014).
2.4 Gaussian fields closure
Wilczek & Meneveau (Reference Wilczek and Meneveau2014) took a different approach to closing the conditional averages. They assumed that the velocity field has joint-Gaussian N-point PDFs with prescribed spectral (two-point) statistics (the pressure field constructed from such a velocity field is not Gaussian). They computed the conditional averages using this approximation by employing the characteristic functional of a Gaussian velocity field and obtaining an exact analytical result for the conditional pressure Hessian for a Gaussian velocity field
 $$\begin{eqnarray}\displaystyle \langle \unicode[STIX]{x1D617}_{ij}^{(d)}|\boldsymbol{A}\rangle _{Gaussian} & = & \displaystyle \unicode[STIX]{x1D6FC}\left(\unicode[STIX]{x1D61A}_{ik}\unicode[STIX]{x1D61A}_{kj}-{\textstyle \frac{1}{3}}\unicode[STIX]{x1D61A}_{k\ell }\unicode[STIX]{x1D61A}_{\ell k}\unicode[STIX]{x1D6FF}_{ij}\right)+\unicode[STIX]{x1D6FD}\left(\unicode[STIX]{x1D6FA}_{ik}\unicode[STIX]{x1D6FA}_{kj}-{\textstyle \frac{1}{3}}\unicode[STIX]{x1D6FA}_{k\ell }\unicode[STIX]{x1D6FA}_{\ell k}\unicode[STIX]{x1D6FF}_{ij}\right)\nonumber\\ \displaystyle & & \displaystyle +\,\unicode[STIX]{x1D6FE}(\unicode[STIX]{x1D61A}_{ik}\unicode[STIX]{x1D6FA}_{kj}-\unicode[STIX]{x1D6FA}_{ik}\unicode[STIX]{x1D61A}_{kj}),\end{eqnarray}$$
where
 $$\begin{eqnarray}\unicode[STIX]{x1D6FC}=-\frac{2}{7},\quad \unicode[STIX]{x1D6FD}=-\frac{2}{5},\quad \unicode[STIX]{x1D6FE}=\frac{6}{25}+\frac{16}{75f^{\prime \prime }(0)^{2}}\int \frac{f^{\prime }(r)f^{\prime \prime \prime }(r)}{r}\,\text{d}r,\end{eqnarray}$$
with
 $f(r)$
specifying the longitudinal velocity correlation function in isotropic turbulence. In this expression,
 $\unicode[STIX]{x1D6FC}$
and
 $\unicode[STIX]{x1D6FD}$
are independent of
 $Re_{\unicode[STIX]{x1D706}}$
while
 $\unicode[STIX]{x1D6FE}$
is expected to have weak
 $Re_{\unicode[STIX]{x1D706}}$
dependence through the integral of the correlation function derivatives. Using a model spectrum at
 $Re_{\unicode[STIX]{x1D706}}=430$
, a numerical result of
 $\unicode[STIX]{x1D6FE}\approx 0.08$
was obtained (Wilczek & Meneveau Reference Wilczek and Meneveau2014).
Furthermore, the conditional viscous Laplacian could also be computed for Gaussian fields (Wilczek & Meneveau Reference Wilczek and Meneveau2014),
 $$\begin{eqnarray}\langle \unicode[STIX]{x1D708}\unicode[STIX]{x1D6FB}^{2}\unicode[STIX]{x1D608}_{ij}|\boldsymbol{A}\rangle _{Gaussian}=\unicode[STIX]{x1D6FF}\unicode[STIX]{x1D608}_{ij},\quad \text{where}~\unicode[STIX]{x1D6FF}=\unicode[STIX]{x1D708}\frac{7}{3}\frac{f^{(4)}(0)}{f^{\prime \prime }(0)}.\end{eqnarray}$$
Note that
 $\unicode[STIX]{x1D6FF}<0$
for realistic correlation functions, meaning that the Gaussian approximation leads to a linear damping model as in Martin et al. (Reference Martin, Dopazo and Valino1998a
) for the viscous Laplacian. Numerical evaluation using a model spectrum at
 $Re_{\unicode[STIX]{x1D706}}=430$
gave the result
 $\unicode[STIX]{x1D6FF}\approx -0.65/\unicode[STIX]{x1D70F}_{\unicode[STIX]{x1D702}}$
. Using the above Gaussian-derived functional form but invoking in addition the balance of enstrophy production and dissipation with its relationship to skewness, Wilczek & Meneveau (Reference Wilczek and Meneveau2014) related the coefficient
 $\unicode[STIX]{x1D6FF}$
to the velocity derivative skewness,
 $\mathscr{S}=\langle (\unicode[STIX]{x2202}u_{1}/\unicode[STIX]{x2202}x_{1})^{3}\rangle /\langle (\unicode[STIX]{x2202}u_{1}/\unicode[STIX]{x2202}x_{1})^{2}\rangle ^{3/2}$
,
 $$\begin{eqnarray}\unicode[STIX]{x1D6FF}=\frac{7}{6\sqrt{15}}\frac{\mathscr{S}}{\unicode[STIX]{x1D70F}_{\unicode[STIX]{x1D702}}},\end{eqnarray}$$
a result which gave much better agreement with values estimated from DNS at
 $Re_{\unicode[STIX]{x1D706}}=430$
, namely
 $\unicode[STIX]{x1D6FF}\approx -0.15/\unicode[STIX]{x1D70F}_{\unicode[STIX]{x1D702}}$
, when using realistic values for the skewness (non-zero, i.e. non-Gaussian). Because the original Gaussian closure led to a singularity when integrated numerically, the authors considered an alternative model in which the functional form of the Gaussian closure was retained but the coefficients were empirically obtained by estimating them from DNS results:
 $\unicode[STIX]{x1D6FC}=-0.61,\unicode[STIX]{x1D6FD}=-0.65,\unicode[STIX]{x1D6FE}=0.14,\unicode[STIX]{x1D6FF}=-0.15/\unicode[STIX]{x1D70F}_{\unicode[STIX]{x1D702}}$
.
With these empirically adjusted coefficients, statistical stationarity was achieved and many of the known trends for velocity gradient statistics were reproduced with this approach termed the enhanced Gaussian fields (EGF) closure.
3 Recent deformation of Gaussian fields mapping closure
This section introduces the RDGF closure for the pressure Hessian and viscous Laplacian terms in the Lagrangian stochastic evolution equation for the velocity gradient tensor.
3.1 Overview
As summarized before, a strong assumption underlying the RFD approximation was the assumption that the initial upstream condition of the conditional pressure Hessian (and viscous Laplacian) are isotropic tensors. Here we relax this strong assumption and instead assume that the upstream conditional pressure Hessian is that of an isotropic Gaussian velocity field. In this way, (2.12) is modified as follows
 $$\begin{eqnarray}\langle \widetilde{\unicode[STIX]{x1D617}}_{ij}|\boldsymbol{A}\rangle \approx {\textstyle \frac{1}{3}}\langle \widetilde{\unicode[STIX]{x1D617}}_{kk}|\boldsymbol{A}\rangle \unicode[STIX]{x1D6FF}_{ij}+\langle \widetilde{\unicode[STIX]{x1D617}}_{ij}^{(d)}|\boldsymbol{A}\rangle _{Gaussian}\end{eqnarray}$$
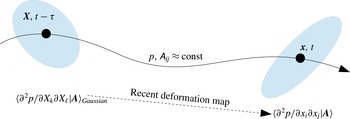
where the latter term is evaluated using (2.20). Similarly for the viscous term, the conditional Hessian of the upstream velocity gradient is no longer assumed isotropic, and (2.17) is modified to include the anisotropic contributions from the Gaussian closure. The same mapping as in the RFD model is applied to convert the upstream initial conditions to the resulting closure. Figure 1 illustrates the overall procedure for constructing the model for the pressure Hessian. A similar procedure is used for the viscous Laplacian.
Schematic illustrating the main elements of the RDGF model for the conditional pressure Hessian. The viscous Laplacian model is constructed analogously.

We name this approach the recent deformation of Gaussian fields (RDGF) model. In the sense of this nomenclature, the term ‘Gaussian fields’ is used to refer to the Gaussian velocity field along with its associated (non-Gaussian) pressure field. For the pressure Hessian, the recent deformation mapping is applied to the pressure field derived from Gaussian velocity field.
The underlying phenomenology of the RDGF model is that approximate turbulence statistics can be developed efficiently by a mapping of Gaussian statistics. This motivation is similar to the spatial distortion applied to Gaussian evaluations of conditional means for scalar Laplacian terms used in the mapping closures (Chen, Chen & Kraichnan Reference Chen, Chen and Kraichnan1989; Kraichnan Reference Kraichnan1990; Pope Reference Pope1991), as well as the multiscale turnover Lagrangian map procedure of Rosales & Meneveau (Reference Rosales and Meneveau2008) to generate non-Gaussian synthetic turbulence fields. It should be noted that, despite some similarity, many important and technical details differ between the present approach and these previous works.
The linear diffusion model of Martin et al. (Reference Martin, Dopazo and Valino1998a ) forms the basis for all three models considered in detail here: RFD, EGF and RDGF. The linear diffusion model follows the same assumptions as the restricted Euler model (i.e. ignoring the deviatoric part of the pressure Hessian), while adding a linear relaxation term to model the viscous damping of velocity gradients. The RFD model adds the additional effect of recent fluid deformation in biasing the statistics of the pressure Hessian and viscous Laplacian. On the other hand, the EGF model computes the deviatoric part of the pressure Hessian (and the linear viscous diffusion coefficient) by approximating the turbulent velocity field as a Gaussian velocity field, an approximation with well-known limitations. The RDGF model includes the Gaussian approximation but adds the additional influence of the recent fluid deformation.
3.2 Model details
The model for the unclosed terms along the Lagrangian path at point
 $\boldsymbol{x}$
(time
 $t$
) involves applying the Gaussian fields approximation at the upstream point
 $\boldsymbol{X}$
(time
 $t-\unicode[STIX]{x1D70F}$
). For the deviatoric part of the pressure Hessian, using (2.20),
 $$\begin{eqnarray}\displaystyle \langle \widetilde{\unicode[STIX]{x1D617}}_{ij}^{(d)}|\boldsymbol{A}\rangle _{Gaussian} & = & \displaystyle \unicode[STIX]{x1D6FC}\left(\unicode[STIX]{x1D61A}_{ik}\unicode[STIX]{x1D61A}_{kj}-{\textstyle \frac{1}{3}}\unicode[STIX]{x1D61A}_{k\ell }\unicode[STIX]{x1D61A}_{\ell k}\unicode[STIX]{x1D6FF}_{ij}\right)+\unicode[STIX]{x1D6FD}\left(\unicode[STIX]{x1D6FA}_{ik}\unicode[STIX]{x1D6FA}_{kj}-{\textstyle \frac{1}{3}}\unicode[STIX]{x1D6FA}_{k\ell }\unicode[STIX]{x1D6FA}_{\ell k}\unicode[STIX]{x1D6FF}_{ij}\right)\nonumber\\ \displaystyle & & \displaystyle +\,\unicode[STIX]{x1D6FE}(\unicode[STIX]{x1D61A}_{ik}\unicode[STIX]{x1D6FA}_{kj}-\unicode[STIX]{x1D6FA}_{ik}\unicode[STIX]{x1D61A}_{kj}),\end{eqnarray}$$
where (2.21) provides the numerical values of the parameters for Gaussian fields. In appendix B, an analytical evaluation of
 $\unicode[STIX]{x1D6FE}$
using Batchelor interpolation for the second-order structure function is presented (Batchelor Reference Batchelor1951). The result,
 $\unicode[STIX]{x1D6FE}=86/1365\approx 0.063$
, does not deviate much from the previous numerical result (Wilczek & Meneveau Reference Wilczek and Meneveau2014).
Similarly, the Gaussian fields approximation for the upstream Hessian of the velocity gradient uses the results of appendix C,
 $$\begin{eqnarray}\displaystyle \left\langle \left.\unicode[STIX]{x1D708}\frac{\unicode[STIX]{x2202}^{2}\unicode[STIX]{x1D608}_{ij}}{\unicode[STIX]{x2202}X_{p}\unicode[STIX]{x2202}X_{q}}\right|\boldsymbol{A}\right\rangle _{Gaussian} & = & \displaystyle \unicode[STIX]{x1D6FF}\left[\unicode[STIX]{x1D61B}_{ij}\unicode[STIX]{x1D6FF}_{pq}+\unicode[STIX]{x1D61B}_{iq}\unicode[STIX]{x1D6FF}_{jp}+\unicode[STIX]{x1D61B}_{ip}\unicode[STIX]{x1D6FF}_{jq}\right.\nonumber\\ \displaystyle & & \displaystyle \left.-\,\frac{2}{21}(\unicode[STIX]{x1D61A}_{jq}\unicode[STIX]{x1D6FF}_{ip}+\unicode[STIX]{x1D61A}_{jp}\unicode[STIX]{x1D6FF}_{iq}+\unicode[STIX]{x1D61A}_{pq}\unicode[STIX]{x1D6FF}_{ij})\right],\end{eqnarray}$$
where
 $$\begin{eqnarray}\unicode[STIX]{x1D6FF}=\unicode[STIX]{x1D708}\frac{7}{3}\frac{f^{(4)}(0)}{f^{\prime \prime }(0)},\quad \unicode[STIX]{x1D61B}_{ij}=\frac{23}{105}\unicode[STIX]{x1D608}_{ij}+\frac{2}{105}\unicode[STIX]{x1D608}_{ji},\quad \unicode[STIX]{x1D61A}_{ij}=\frac{1}{2}(\unicode[STIX]{x1D608}_{ij}+\unicode[STIX]{x1D608}_{ji}).\end{eqnarray}$$
It can be easily shown that contraction with
 $\unicode[STIX]{x1D6FF}_{pq}$
recovers (2.22) and contraction with
 $\unicode[STIX]{x1D6FF}_{ij}$
,
 $\unicode[STIX]{x1D6FF}_{ip}$
, or
 $\unicode[STIX]{x1D6FF}_{iq}$
causes the term to vanish in accordance with incompressibility. Following Wilczek & Meneveau (Reference Wilczek and Meneveau2014), i.e. (2.23), the enstrophy balance is used to determine
 $\unicode[STIX]{x1D6FF}$
in appendix D,
 $$\begin{eqnarray}\unicode[STIX]{x1D6FF}=\frac{\unicode[STIX]{x1D60A}_{kk}}{3}\frac{7}{6\sqrt{15}}\frac{\mathscr{S}}{\unicode[STIX]{x1D70F}_{\unicode[STIX]{x1D702}}},\end{eqnarray}$$
where the typical value of
 $\mathscr{S}=-0.6$
can be used.
Then, the conditional pressure Hessian and velocity gradient Hessian are mapped from
 $\boldsymbol{X}$
to
 $\boldsymbol{x}$
along the trajectory. The deformation tensor used for the mapping,
 $\unicode[STIX]{x1D60B}_{ij}=\unicode[STIX]{x2202}x_{i}/\unicode[STIX]{x2202}X_{j}$
, is approximated by assuming that the velocity gradient is constant for the short time span
 $\unicode[STIX]{x1D70F}$
, i.e. (2.10). Using (2.11) with the new upstream conditional pressure Hessian in (3.1),
 $$\begin{eqnarray}\langle \unicode[STIX]{x1D617}_{ij}|\boldsymbol{A}\rangle ={\textstyle \frac{1}{3}}\langle \widetilde{\unicode[STIX]{x1D617}}_{\ell \ell }|\boldsymbol{A}\rangle \unicode[STIX]{x1D60A}_{ij}^{-1}+\unicode[STIX]{x1D60B}_{mi}^{-1}\langle \widetilde{\unicode[STIX]{x1D617}}_{mn}^{(d)}|\boldsymbol{A}\rangle _{Gaussian}\unicode[STIX]{x1D60B}_{nj}^{-1},\end{eqnarray}$$
where (3.2) is substituted for the deviatoric part of the pressure Hessian. The trace of this equation gives
 $$\begin{eqnarray}2Q=\langle \unicode[STIX]{x1D617}_{kk}|\boldsymbol{A}\rangle =\unicode[STIX]{x1D60B}_{mk}^{-1}\langle \widetilde{\unicode[STIX]{x1D617}}_{mn}^{(d)}|\boldsymbol{A}\rangle \unicode[STIX]{x1D60B}_{nk}^{-1}+{\textstyle \frac{1}{3}}\langle \widetilde{\unicode[STIX]{x1D617}}_{\ell \ell }|\boldsymbol{A}\rangle \unicode[STIX]{x1D60A}_{kk}^{-1}.\end{eqnarray}$$
Solving (3.7) for
 $\langle \widetilde{\unicode[STIX]{x1D617}}_{kk}|\boldsymbol{A}\rangle$
, and substituting into (3.6), the resulting closure is
 $$\begin{eqnarray}\langle \unicode[STIX]{x1D617}_{ij}|\boldsymbol{A}\rangle =2Q\frac{\unicode[STIX]{x1D60A}_{ij}^{-1}}{\unicode[STIX]{x1D60A}_{kk}^{-1}}+G_{ij}-\frac{\unicode[STIX]{x1D60A}_{ij}^{-1}}{\unicode[STIX]{x1D60A}_{kk}^{-1}}G_{\ell \ell },\end{eqnarray}$$
where
 $$\begin{eqnarray}G_{ij}=\unicode[STIX]{x1D60B}_{mi}^{-1}\langle \widetilde{\unicode[STIX]{x1D617}}_{mn}^{(d)}|\boldsymbol{A}\rangle _{Gaussian}\unicode[STIX]{x1D60B}_{nj}^{-1},\end{eqnarray}$$
using (3.2) with (2.21). Similarly for the viscous Laplacian, using (2.16) with the new upstream conditional viscous Hessian (3.3) leads to
 $$\begin{eqnarray}\langle \unicode[STIX]{x1D708}\unicode[STIX]{x1D6FB}^{2}\unicode[STIX]{x1D608}_{ij}|\boldsymbol{A}\rangle =\unicode[STIX]{x1D6FF}\left(\unicode[STIX]{x1D61B}_{ij}\unicode[STIX]{x1D60A}_{kk}^{-1}+2\unicode[STIX]{x1D61B}_{ik}\unicode[STIX]{x1D609}_{kj}^{-1}-{\textstyle \frac{4}{21}}\unicode[STIX]{x1D609}_{ik}^{-1}\unicode[STIX]{x1D61A}_{kj}-{\textstyle \frac{2}{21}}\unicode[STIX]{x1D609}_{k\ell }^{-1}\unicode[STIX]{x1D61A}_{k\ell }\unicode[STIX]{x1D6FF}_{ij}\right),\end{eqnarray}$$
where
 $\unicode[STIX]{x1D609}_{ij}^{-1}=\unicode[STIX]{x1D60B}_{ik}^{-1}\unicode[STIX]{x1D60B}_{jk}^{-1}$
is the inverse of the right Cauchy–Green tensor and
 $\unicode[STIX]{x1D64F}$
and
 $\unicode[STIX]{x1D64E}$
are given in (3.4).
3.3 The resulting model
The resulting stochastic ODE model for the Lagrangian velocity gradient dynamics is
 $$\begin{eqnarray}\text{d}\unicode[STIX]{x1D608}_{ij}=\left[-\left(\unicode[STIX]{x1D608}_{ik}\unicode[STIX]{x1D608}_{kj}-\frac{\unicode[STIX]{x1D60A}_{ij}^{-1}}{\unicode[STIX]{x1D60A}_{kk}^{-1}}\,\text{tr}(\boldsymbol{A}^{2})\right)-\left(G_{ij}-\frac{\unicode[STIX]{x1D60A}_{ij}^{-1}}{\unicode[STIX]{x1D60A}_{kk}^{-1}}\,\text{tr}(\boldsymbol{G})\right)+V_{ij}\right]\text{d}t+\unicode[STIX]{x1D623}_{ijk\ell }\,\text{d}W_{k\ell },\end{eqnarray}$$
where the contribution of the deviatoric part of the back-in-time pressure Hessian is
 $$\begin{eqnarray}\displaystyle G_{ij} & = & \displaystyle \unicode[STIX]{x1D60B}_{mi}^{-1}\left[-{\textstyle \frac{2}{7}}\left(\unicode[STIX]{x1D61A}_{mk}\unicode[STIX]{x1D61A}_{kn}-{\textstyle \frac{1}{3}}\unicode[STIX]{x1D61A}_{k\ell }\unicode[STIX]{x1D61A}_{\ell k}\unicode[STIX]{x1D6FF}_{mn}\right)-{\textstyle \frac{2}{5}}\left(\unicode[STIX]{x1D6FA}_{mk}\unicode[STIX]{x1D6FA}_{kn}-{\textstyle \frac{1}{3}}\unicode[STIX]{x1D6FA}_{k\ell }\unicode[STIX]{x1D6FA}_{\ell k}\unicode[STIX]{x1D6FF}_{mn}\right)\right.\nonumber\\ \displaystyle & & \displaystyle \left.+\,{\textstyle \frac{86}{1365}}(\unicode[STIX]{x1D61A}_{mk}\unicode[STIX]{x1D6FA}_{kn}-\unicode[STIX]{x1D6FA}_{mk}\unicode[STIX]{x1D61A}_{kn})\right]\unicode[STIX]{x1D60B}_{nj}^{-1},\end{eqnarray}$$
and the contribution of the viscous Laplacian is
 $$\begin{eqnarray}V_{ij}=\frac{7}{6\sqrt{15}}\frac{\unicode[STIX]{x1D60A}_{kk}}{3}\frac{\mathscr{S}}{\unicode[STIX]{x1D70F}_{\unicode[STIX]{x1D702}}}\left(\unicode[STIX]{x1D61B}_{ij}\unicode[STIX]{x1D60A}_{kk}^{-1}+2\unicode[STIX]{x1D61B}_{ik}\unicode[STIX]{x1D609}_{kj}^{-1}-\frac{4}{21}\unicode[STIX]{x1D609}_{ik}^{-1}\unicode[STIX]{x1D61A}_{kj}-\frac{2}{21}\unicode[STIX]{x1D609}_{k\ell }^{-1}\unicode[STIX]{x1D61A}_{k\ell }\unicode[STIX]{x1D6FF}_{ij}\right),\end{eqnarray}$$
with
 $\mathscr{S}=-0.6$
and
 $$\begin{eqnarray}\unicode[STIX]{x1D61A}_{ij}={\textstyle \frac{1}{2}}(\unicode[STIX]{x1D608}_{ij}+\unicode[STIX]{x1D608}_{ji}),\quad \unicode[STIX]{x1D6FA}_{ij}={\textstyle \frac{1}{2}}(\unicode[STIX]{x1D608}_{ij}-\unicode[STIX]{x1D608}_{ji}),\quad \unicode[STIX]{x1D61B}_{ij}={\textstyle \frac{23}{105}}\unicode[STIX]{x1D608}_{ij}+{\textstyle \frac{2}{105}}\unicode[STIX]{x1D608}_{ji}.\end{eqnarray}$$
The recent deformation is described by
 $$\begin{eqnarray}\unicode[STIX]{x1D60B}_{ij}^{-1}=[\exp (-\boldsymbol{A}\unicode[STIX]{x1D70F})]_{ij},\quad \unicode[STIX]{x1D60A}_{ij}^{-1}=\unicode[STIX]{x1D60B}_{ki}^{-1}\unicode[STIX]{x1D60B}_{kj}^{-1},\quad \unicode[STIX]{x1D609}_{ij}^{-1}=\unicode[STIX]{x1D60B}_{ik}^{-1}\unicode[STIX]{x1D60B}_{jk}^{-1},\end{eqnarray}$$
and the diffusion coefficient tensor of the stochastic forcing term is
 $$\begin{eqnarray}\unicode[STIX]{x1D623}_{ijk\ell }=-\frac{1}{3}\sqrt{\frac{D_{s}}{5}}\unicode[STIX]{x1D6FF}_{ij}\unicode[STIX]{x1D6FF}_{k\ell }+\frac{1}{2}\left(\sqrt{\frac{D_{s}}{5}}+\sqrt{\frac{D_{a}}{3}}\right)\unicode[STIX]{x1D6FF}_{ik}\unicode[STIX]{x1D6FF}_{j\ell }+\frac{1}{2}\left(\sqrt{\frac{D_{s}}{5}}-\sqrt{\frac{D_{a}}{3}}\right)\unicode[STIX]{x1D6FF}_{i\ell }\unicode[STIX]{x1D6FF}_{jk}.\end{eqnarray}$$
Note that the present model does not use the coefficients estimated from DNS. Instead, the coefficients are used as derived from the Gaussian field statistics.
In some sense, this model can be seen as a generalization of both RFD and GF closures. To recover the RFD model, first the back-in-time deviatoric component of the pressure Hessian should be removed,
 $G_{ij}=0$
, i.e.
 $\unicode[STIX]{x1D6FC}=\unicode[STIX]{x1D6FD}=\unicode[STIX]{x1D6FE}=0$
. Then, including only the isotropic part of (3.3), gives
 $\unicode[STIX]{x1D708}\unicode[STIX]{x1D6FB}^{2}\unicode[STIX]{x1D608}_{ij}=\unicode[STIX]{x1D6FF}(\unicode[STIX]{x1D60A}_{kk}^{-1}/3)\unicode[STIX]{x1D608}_{ij}$
, and the coefficient should be set to
 $\unicode[STIX]{x1D6FF}=-1/T$
, where
 $T$
is the integral time scale. This approximately corresponds to the RFD model at
 $\unicode[STIX]{x1D70F}_{K}/T=-7\mathscr{S}/6\sqrt{15}\approx 0.18$
. To recover the GF model, the deformation tensor should be set to identity,
 $\unicode[STIX]{x1D60B}_{ij}=\unicode[STIX]{x1D6FF}_{ij}$
.
3.4 Parameters and constraints
The model now contains three parameters that have yet to be determined:
 $D_{s}$
,
 $D_{a}$
and
 $\unicode[STIX]{x1D70F}$
. As discussed in more detail in appendix A, the stochastic forcing term,
 $\text{d}F_{ij}=\unicode[STIX]{x1D623}_{ijk\ell }\,\text{d}W_{k\ell }$
, can be split into symmetric and anti-symmetric parts, each with its own amplitude. This can be thought of as separately forcing (2.7) and (2.8). The amplitudes of the symmetric and anti-symmetric stochastic forcing tensors,
 $D_{s}$
and
 $D_{a}$
, are two parameters that must be set to fully specify the model.
Additionally, the time interval of the mapping,
 $\unicode[STIX]{x1D70F}$
, must be set. In keeping with the RFD phenomenology, it is expected that this should be
 $\unicode[STIX]{x1D70F}\sim O(\unicode[STIX]{x1D70F}_{\unicode[STIX]{x1D702}})$
. The RFD model used
 $\unicode[STIX]{x1D70F}=\unicode[STIX]{x1D70F}_{K}$
, where
 $\unicode[STIX]{x1D70F}_{K}$
is an input Kolmogorov time scale, but a posteriori evaluation at
 $\unicode[STIX]{x1D70F}_{K}/T=0.1$
reveals that the actual Kolmogorov time scale produced by the model is
 $\unicode[STIX]{x1D70F}_{\unicode[STIX]{x1D702}}\approx 2.0\unicode[STIX]{x1D70F}_{K}$
. Therefore, the effective time interval was
 $\unicode[STIX]{x1D70F}\approx 0.5\unicode[STIX]{x1D70F}_{\unicode[STIX]{x1D702}}$
, based on the actual velocity gradient statistics produced by the model.
The three free parameters can be set by a choice of three constraints. First, without loss of generality, considering the evolution of the dimensionless velocity gradient tensor,
 $\langle \unicode[STIX]{x1D61A}_{ij}\unicode[STIX]{x1D61A}_{ij}\rangle \unicode[STIX]{x1D70F}_{\unicode[STIX]{x1D702}}^{2}=1/2$
. This constraint effectively guarantees that the definition of
 $\unicode[STIX]{x1D6FF}$
in terms of
 $\unicode[STIX]{x1D70F}_{\unicode[STIX]{x1D702}}$
is consistent. For the other two constraints, it is desirable to pick relationships for isotropic turbulence with analytical derivation, which can be considered a priori constraints. It is natural, then, to pick the two Betchov relations (Betchov Reference Betchov1956),
 $\langle Q\rangle =\langle R\rangle =0$
where
 $R=(-1/3)A_{ij}A_{jk}A_{ki}$
. In light of the aforementioned dimensionless form of the equation, the former can be rephrased as
 $\langle \unicode[STIX]{x1D6FA}_{ij}\unicode[STIX]{x1D6FA}_{ij}\rangle \unicode[STIX]{x1D70F}_{\unicode[STIX]{x1D702}}^{2}=1/2$
.
The determination of the three parameters using the three constraints can be posed as a three-dimensional root-finding problem. The appropriate values for the parameters were found empirically by numerical solutions of the model (see § 4.1 below for details) using Broyden’s method (Press et al.
Reference Press, Teukolsky, Vetterling and Flannery1992). The procedure involved iteratively adjusting
 $D_{s}$
,
 $D_{a}$
, and
 $\unicode[STIX]{x1D70F}$
and evaluating sufficiently converged statistics of
 $\langle \unicode[STIX]{x1D61A}_{ij}\unicode[STIX]{x1D61A}_{ij}\rangle$
,
 $\langle \unicode[STIX]{x1D6FA}_{ij}\unicode[STIX]{x1D6FA}_{ij}\rangle$
and
 $\langle R\rangle$
from the numerical solutions of the model until the constraints were satisfied with the desired accuracy (four decimal places). The iterative method for determining the correct model parameters converges toward
 $$\begin{eqnarray}D_{s}=0.1014/\unicode[STIX]{x1D70F}_{\unicode[STIX]{x1D702}}^{3},\quad D_{a}=0.0505/\unicode[STIX]{x1D70F}_{\unicode[STIX]{x1D702}}^{3},\quad \unicode[STIX]{x1D70F}=0.1302\unicode[STIX]{x1D70F}_{\unicode[STIX]{x1D702}}.\end{eqnarray}$$
The mapping time is considerably shorter than that of RFD closure because the additional deviatoric part of the pressure Hessian was added to the RFD model, which was by itself already strong enough to counter the singularity with
 $\unicode[STIX]{x1D70F}\approx 0.5\unicode[STIX]{x1D70F}_{\unicode[STIX]{x1D702}}$
.
4 Numerical methods
4.1 Stochastic differential equation solver
The three models introduced in the previous sections (RFD, EGF and RDGF) can be advanced numerically as a system of stochastic ODEs. A second-order predictor–corrector method is used for time advancement. Time steps of size
 $dt/\unicode[STIX]{x1D70F}_{\unicode[STIX]{x1D702}}=0.04$
, 0.02 and 0.01 are compared to verify discretization convergence. Ensembles of
 $2^{16}$
trajectories are advanced for
 $1000\unicode[STIX]{x1D70F}_{\unicode[STIX]{x1D702}}$
to achieve convergence of desired statistical quantities (up to fourth-order moments). Without loss of generality,
 $\unicode[STIX]{x1D70F}_{\unicode[STIX]{x1D702}}=1$
was used for all runs. The Fortran simulations were performed in serial and run on a desktop machine, taking a few hours to complete.
4.2 Direct numerical simulation database
The Johns Hopkins Turbulence Databases isotropic dataset (Li et al.
Reference Li, Perlman, Wan, Yang, Meneveau, Burns, Chen, Szalay and Eyink2008; Perlman et al.
Reference Perlman, Burns, Li and Meneveau2007) provided the DNS statistics used for most of the comparisons in this paper. The dataset contains the simulation results from a
 $Re_{\unicode[STIX]{x1D706}}=430$
simulation of Navier–Stokes with forcing at the two lowest wavenumbers. The pseudo-spectral simulation provided a
 $1024^{3}$
resolution on a
 $(2\unicode[STIX]{x03C0})^{3}$
cubic domain. Time advancement was accomplished via the second-order Adams–Bashforth scheme and de-aliasing was done with
 $2\sqrt{2}/3$
truncation and random phase shift. In a few cases, the comparisons are supplemented with another DNS at
 $Re_{\unicode[STIX]{x1D706}}=160$
using the same simulation code. Important parameters for the simulations are given in table 1. It is worth noting that RFD model with
 $\unicode[STIX]{x1D70F}_{K}/T=0.1$
has been equated with
 $Re_{\unicode[STIX]{x1D706}}=150$
(Chevillard et al.
Reference Chevillard, Meneveau, Biferale and Toschi2008). Reaching
 $Re_{\unicode[STIX]{x1D706}}=430$
requires
 $\unicode[STIX]{x1D70F}_{K}/T\approx 0.035$
, which is outside the range for which RFD model produces results with reasonable accuracy. Therefore, in this paper, we use
 $\unicode[STIX]{x1D70F}_{K}/T=0.1$
for the RFD simulations, the value at which the RFD model seems to perform the best.
5 Results
5.1 Longitudinal and transverse components
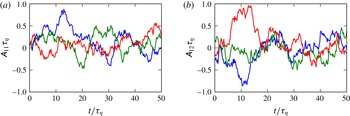
Figure 2 illustrates the output of the RDGF mapping closure by plotting sample trajectories of longitudinal and transverse velocity components over an interval of
 $20\unicode[STIX]{x1D70F}_{\unicode[STIX]{x1D702}}$
. Because of the stochastic forcing, the paths appear rough, even at the scale of the Kolmogorov time scale. Nonetheless, such stochastic models can be useful when their statistical behaviour provides a good model for Lagrangian velocity gradient statistics in isotropic turbulence.
Sample trajectories of (a) longitudinal and (b) transverse velocity gradient components from the RDGF mapping closure. Three different trajectories are shown, represented by three different colours.

Numerical details for simulations used in this paper.

The probability density functions for the longitudinal velocity derivative,
 $\unicode[STIX]{x1D608}_{11}$
, and transverse velocity derivative,
 $\unicode[STIX]{x1D608}_{12}$
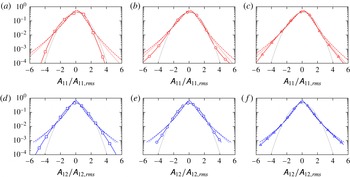
, are shown in figure 3. The RFD, EGF and RDGF closures are compared with DNS results at the two different Reynolds numbers. The negative skewness expected for
 $\unicode[STIX]{x1D608}_{11}$
and the symmetry expected for
 $\unicode[STIX]{x1D608}_{12}$
are reflected by all three models. The RFD results appear much too close to Gaussian when compared with DNS results. The longitudinal velocity gradient distributions (top row of figure) from the EGF and RDGF models are better than that of RFD in terms of deviation from Gaussian behaviour. For the transverse component, the RFD and EGF results appear similar, being between Gaussian and the DNS results. The RDGF mapping closure provides a much better match for the
 $\unicode[STIX]{x1D608}_{12}$
PDF. The trends suggest that the RDGF model may provide an even better fit for DNS data at slightly lower
 $Re_{\unicode[STIX]{x1D706}}$
, but we refrain from any iterative matching with any particular precise value of
 $Re_{\unicode[STIX]{x1D706}}$
as we are mostly interested in overall trends.
Single component PDFs for longitudinal (a–c) and transverse (d–f) velocity components. Three models are compared: (a,d) RFD, (b,e) EGF, (c,f) RDGF mapping closure. Solid grey line denotes Gaussian, dashed line shows DNS results at
 $Re_{\unicode[STIX]{x1D706}}=430$
, dotted line shows DNS at
 $Re_{\unicode[STIX]{x1D706}}=160$
and solid line with markers shows the model result.

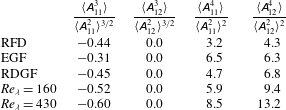
As a compact comparison, table 2 records the skewness and flatness factors of the above PDFs. All three models significantly underpredict the magnitude of the negative skewness for
 $\unicode[STIX]{x1D608}_{11}$
, although the RFD and RDGF mapping closures are much closer than the EGF closure. The flatness factors for the longitudinal and transverse components help quantify the tendency of the model to reproduce the fattened tails of the PDFs in figure 3. For the longitudinal component, the EGF model appears to give the closest match, while RDGF is slightly closer for the transverse component. In each case, the flatness factors are too low, as was probably already evident in the above figures. It appears that the trend produced by the RFD and RDGF mapping closures, namely, that the longitudinal component has lower flatness than the transverse component, reflects the DNS trend. Indeed, as was discussed above, these results for RDGF could be seen as somewhat more appropriate for matching the DNS results at even lower Reynolds number.
Skewness and kurtosis values for longitudinal and transverse velocity gradient components from each model compared with DNS.

5.2 Isotropic relations
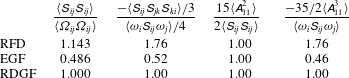
Table 3 compares the extent to which each of the models is able to reproduce important isotropy relations. Each ratio is equal to unity for isotropic turbulence. The first ratio,
 $\langle \unicode[STIX]{x1D61A}_{ij}\unicode[STIX]{x1D61A}_{ij}\rangle /\langle \unicode[STIX]{x1D6FA}_{ij}\unicode[STIX]{x1D6FA}_{ij}\rangle$
, represents the ratio of strain-rate magnitude to vorticity magnitude produced by the model and is equal to unity since by construction (adjustment of forcing parameters),
 $\langle Q\rangle =0$
. The second ratio,
 $(-\langle \unicode[STIX]{x1D61A}_{ij}\unicode[STIX]{x1D61A}_{jk}\unicode[STIX]{x1D61A}_{ki}\rangle /3)/(\langle \unicode[STIX]{x1D714}_{i}\unicode[STIX]{x1D61A}_{ij}\unicode[STIX]{x1D714}_{j}\rangle /4)$
, represents the balance between strain production and vorticity production and is equal to unity if
 $\langle R\rangle =0$
, also expected due to the adjustment of forcing parameters. The identities are all satisfied within numerical error showing that the numerical tuning of the three parameters (
 $D_{s}$
,
 $D_{a}$
and
 $\unicode[STIX]{x1D70F}$
) is very accurate. This represents a significant advantage of the RDGF mapping closure, seeing that the earlier RFD model slightly overemphasizes strain-dominant and strain-production-dominant regions while the EGF model significantly overemphasizes rotation-dominant and rotation-production-dominant regions. All three models satisfy the relation between dissipation and the longitudinal velocity derivative variance. It should be noted that the values in table 3 from the RFD and EGF models could be improved if their
 $D_{s}=D_{a}$
constraint was removed and the two forcing coefficients tuned separately. This would allow one extra degree of freedom in tuning, which could be used to satisfy one, but not both, of the Betchov relations.
Results for competing models in terms of reproducing known isotropic relations.

5.3 Enstrophy and dissipation
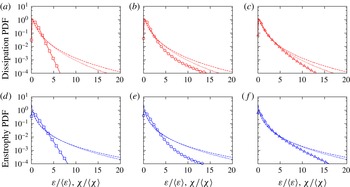
The probability density distributions (PDFs) of enstrophy and dissipation in isotropic turbulence (Meneveau & Sreenivasan Reference Meneveau and Sreenivasan1991; Bershadskii, Kit & Tsinober Reference Bershadskii, Kit and Tsinober1993; Donzis, Yeung & Sreenivasan Reference Donzis, Yeung and Sreenivasan2008) provide another useful test for comparing Lagrangian velocity gradient models. Figure 4 compares the dissipation (a–c) and enstrophy (d–f) PDFs of the RFD (a,d), EGF (b,e) and RDGF (c,f) models with the DNS results at two
 $Re_{\unicode[STIX]{x1D706}}$
values. The RFD model appears to produce exponential tails (straight lines on the log-linear plot) rather than stretched exponential. The EGF model is much improved for the dissipation and enstrophy PDF, appearing somewhat closer to the characteristic stretched-exponential shape. The RDGF model provides the best agreement with both dissipation and enstrophy distributions, displaying the stretched-exponential shape for both. It should be kept in mind that the EGF and RDGF do not have explicit Reynolds number dependence. Again, as a qualitative observation, the RDGF model gives results that may appear even more realistic for lower
 $Re_{\unicode[STIX]{x1D706}}$
.
PDFs of dissipation (a–c) and enstrophy (d–f) normalized by their mean values for RFD (a,d), EGF (b,e), RDGF (c,f). Solid lines with symbols indicate model results and DNS results are shown with dashed (
 $Re_{\unicode[STIX]{x1D706}}=430$
) and dotted (
 $Re_{\unicode[STIX]{x1D706}}=160$
) lines.

5.4 Vorticity and strain rate
One of the well-known features of velocity gradient statistics in turbulent flows is the non-trivial alignment of the vorticity vector with respect to the three eigenvectors of the strain-rate tensor (Ashurst et al. Reference Ashurst, Kerstein, Kerr and Gibson1987). The vorticity tends to align more closely with the strain-rate eigenvector associated with the intermediate eigenvalue. Meanwhile, the vorticity tends to be more perpendicular with respect to the strain-rate eigenvector of the smallest eigenvalue. The alignment distribution between the vorticity and the eigenvector of the largest strain-rate eigenvalue tends to be fairly uniform in comparison.
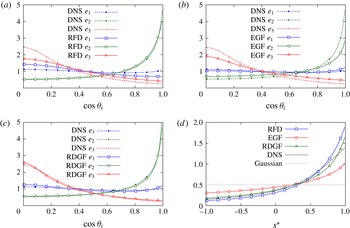
Figure 5(a–c) show the PDFs for the cosines of the angles between vorticity and strain-rate eigenvectors. The DNS results at
 $Re_{\unicode[STIX]{x1D706}}=430$
are used for comparison here; these statistics show virtually no dependence on
 $Re_{\unicode[STIX]{x1D706}}$
. All three models mimic the well-known trend outlined above. The RFD model slightly underpredicts the anti-alignment of vorticity with the smallest strain-rate eigenvalue, while displaying a slight preference toward anti-alignment for the largest eigenvalue. The EGF consistently underpredicts the alignment biases seen in the DNS results. It appears that the RDGF model obtains the best agreement overall.
Probability distribution functions for the cosine of the angle between vorticity and the strain-rate eigenvectors: (a) RFD, (b) EGF, (c) RDGF. (d) Probability density functions for
 $s^{\ast }$
, as defined in (5.1), for the three models compared with DNS results and Gaussian field statistics.

Lund & Rogers (Reference Lund and Rogers1994) introduced the measure
 $-1\leqslant s^{\ast }\leqslant 1$
using the eigenvalues of the strain-rate tensor,
 $$\begin{eqnarray}s^{\ast }=-\frac{3\sqrt{6}\unicode[STIX]{x1D6EC}_{1}\unicode[STIX]{x1D6EC}_{2}\unicode[STIX]{x1D6EC}_{3}}{(\unicode[STIX]{x1D6EC}_{1}^{2}+\unicode[STIX]{x1D6EC}_{2}^{2}+\unicode[STIX]{x1D6EC}_{3}^{2})^{3/2}},\end{eqnarray}$$
which compares the relative magnitudes of each of the three strain-rate eigenvalues taking into account that they must add up to zero. Figure 5(d) reports the PDFs for the three models considered here, shown in comparison to DNS results (
 $Re_{\unicode[STIX]{x1D706}}=430$
). It is well known that turbulent velocity gradients are biased toward
 $s^{\ast }>0$
, i.e. more distortion toward disk-like fluid elements (Lund & Rogers Reference Lund and Rogers1994; Meneveau Reference Meneveau2011). All three models reflect this trend. The RFD model overpredicts the bias toward positive
 $s^{\ast }$
, while the EGF model underpredicts it. The RDGF model appears to produce results in closest comparison with DNS.
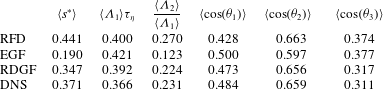
Table 4 compares ensemble averages for some of these vorticity and strain-rate statistics, helping quantify the above discussion. Additionally available from this table is the ratio of average strain-rate eigenvalues, for which the RDGF models also provides good predictions.
Various mean values for strain-rate and vorticity measures.

5.5 Dynamics in the
 $Q$
–
$R$
plane


Another salient feature of turbulent velocity gradient statistics is the teardrop-shaped contours of the joint-probability density function for the
 $Q$
and
 $R$
invariants (Soria et al.
Reference Soria, Sondergaard, Cantwell, Chong and Perry1994; Blackburn, Mansour & Cantwell Reference Blackburn, Mansour and Cantwell1996; Chong et al.
Reference Chong, Soria, Perry, Chacin, Cantwell and Na1998; Ooi et al.
Reference Ooi, Martin, Soria and Chong1999). Figure 6 compares such joint PDFs from the three models with DNS results (
 $Re_{\unicode[STIX]{x1D706}}=430$
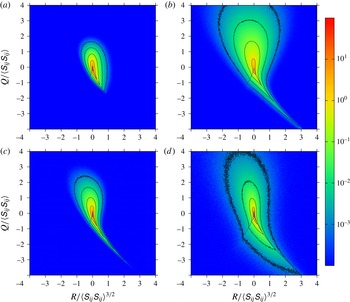
). Each model reproduces to some extent the features in the DNS results, most notably the teardrop shape.
Logarithmically scaled joint-probability density function for the invariants
 $Q$
and
 $R$
as given by (a) RFD, (b) EGF, (c) RDGF and (d) DNS.

The RFD results are too compact, lacking sufficient excursions far from the mean, as also seen previously for the single component PDFs in figure 3. One also observes a less prominent high-probability filament descending down the positive
 $R$
branch of the Vieillefosse line. The EGF model results are more accurate in their depiction of the high-probability region along the Vieillefosse line but a less realistic aspect of the EGF results is the exaggerated higher probability in the positive
 $Q$
region compared to the negative
 $Q$
region. This feature is evidently responsible for the EGF model’s departure from
 $\langle Q\rangle =0$
(the EGF also does not reproduce
 $\langle R\rangle =0$
). As mentioned previously, adapting the RDGF forcing scheme (tuning
 $D_{s}$
and
 $D_{a}$
separately) to the EGF could be used to satisfy one, but not both, of the Betchov relations.
The results from the RDGF mapping closure share some of these strengths and weaknesses. For the RDGF, the low-probability contours remain too compact, although less so than in the case of the RFD model. The shape of the high-probability regions closely mirror those for the DNS. In addition, there is some promising spread for the low-probability contours into the high positive
 $Q$
regions. However, overall, the details of the low-probability contours (the tails of the joint distribution) still represent a challenge for all three models.
Neglecting the stochastic forcing for the moment, the dynamical equations for
 $Q$
and
 $R$
are (Ooi et al.
Reference Ooi, Martin, Soria and Chong1999)
 $$\begin{eqnarray}\frac{\text{d}Q}{\text{d}t}=-3R+\unicode[STIX]{x1D608}_{ij}\unicode[STIX]{x1D617}_{ji}^{(d)}-\unicode[STIX]{x1D708}\unicode[STIX]{x1D608}_{ij}\unicode[STIX]{x1D6FB}^{2}\unicode[STIX]{x1D608}_{ji},\quad \frac{\text{d}R}{\text{d}t}=\frac{2}{3}Q^{2}+\unicode[STIX]{x1D608}_{ij}\unicode[STIX]{x1D608}_{jk}\unicode[STIX]{x1D617}_{ki}^{(d)}-\unicode[STIX]{x1D708}\unicode[STIX]{x1D608}_{ij}\unicode[STIX]{x1D608}_{jk}\unicode[STIX]{x1D6FB}^{2}\unicode[STIX]{x1D608}_{ki}.\end{eqnarray}$$
The dynamics in probability space can be recovered thus from conditional averaging,
 $$\begin{eqnarray}\displaystyle & \displaystyle \left\langle \left.\frac{\text{d}Q}{\text{d}t}\right|Q,R\right\rangle =-3R+\langle \unicode[STIX]{x1D608}_{ij}\unicode[STIX]{x1D617}_{ji}^{(d)}|Q,R\rangle -\unicode[STIX]{x1D708}\langle \unicode[STIX]{x1D608}_{ij}\unicode[STIX]{x1D6FB}^{2}\unicode[STIX]{x1D608}_{ji}|Q,R\rangle , & \displaystyle\end{eqnarray}$$
 $$\begin{eqnarray}\displaystyle & \displaystyle \left\langle \left.\frac{\text{d}R}{\text{d}t}\right|Q,R\right\rangle =\frac{2}{3}Q^{2}+\langle \unicode[STIX]{x1D608}_{ij}\unicode[STIX]{x1D608}_{jk}\unicode[STIX]{x1D617}_{ki}^{(d)}|Q,R\rangle -\unicode[STIX]{x1D708}\langle \unicode[STIX]{x1D608}_{ij}\unicode[STIX]{x1D608}_{jk}\unicode[STIX]{x1D6FB}^{2}\unicode[STIX]{x1D608}_{ki}|Q,R\rangle . & \displaystyle\end{eqnarray}$$
 $Q$
–
 $R$
probability space which, when multiplied with the local probability density, represent fluxes in probability space. They are evaluated based on DNS as well as from the three models. In order to compare them under similar conditions, averages are evaluated as an a priori test, by evaluating the model results from an ensemble of DNS trajectories. In practice, we found that the most significant effect of this approach (as opposed to sample the statistics along model evaluations) was to increase the domain in
 $Q{-}R$
space where the average velocities could be obtained.
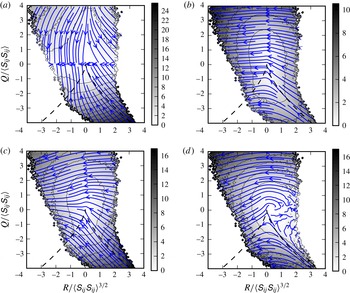
Thick lines with arrows represent ‘streamlines’ in the
 $Q{-}R$
plane due to the deviatoric part of the pressure Hessian. Thin lines represent contours for the velocity magnitude in the
 $Q{-}R$
plane. Results are as given by (a) RFD, (b) EGF, (c) RDGF mapping closure and (d) DNS.

Figure 7 shows the
 $Q{-}R$
-space velocities attributed to the pressure Hessian term for the three models compared with DNS results (
 $Re_{\unicode[STIX]{x1D706}}=430$
). The primary action of the RFD pressure Hessian is to oppose the restricted Euler motion along the Vieillefosse tail. In fact, the magnitude of the pressure Hessian opposing the restricted Euler singularity along the Vieillefosse tail is too strong in comparison with the DNS data. As previously noted (Chevillard et al.
Reference Chevillard, Meneveau, Biferale and Toschi2008), the RFD pressure Hessian lacks the right-to-left motion seen in the DNS and the other two models. This elucidates the shortcoming of the upstream isotropic assumption for the pressure Hessian tensor. In fact, it is a significant contribution of the Gaussian form of the pressure Hessian that it adds this right-to-left tendency due to the deviatoric component of the tensor.
The EGF pressure Hessian tends to oppose the singularity with smaller magnitude than the DNS results indicate, while the RDGF opposes with slightly larger magnitude than DNS. While the right-to-left motion is captured by the EGF and RDGF closures, a few more subtle features of the DNS results are not. First, the relatively ambient region of positive
 $R$
near
 $Q=0$
has an unphysically active right-to-left motion in the EGF and RDGF closures. Secondly, the DNS results indicate opposition to restricted Euler along the left side of the Vieillefosse line, which is not replicated by the EGF or RDGF closures. Other subtle differences and similarities may be noted, but the above discussion summarizes the most important trends noticeable.
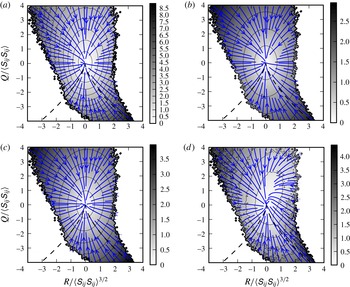
Thick lines with arrows represent streamlines in the
 $Q{-}R$
plane due to the viscous Laplacian. Thin lines represent contours for the velocity magnitude in the
 $Q{-}R$
plane, non-dimensionalized by powers of
 $\langle \unicode[STIX]{x1D61A}_{ij}\unicode[STIX]{x1D61A}_{ij}\rangle$
. Results are as given by (a) RFD, (b) EGF, (c) RDGF and (d) DNS.

The velocities in
 $Q{-}R$
space from the viscous Laplacian are shown in figure 8 for each of the models compared with DNS. All the models produce the same structure: the viscous Laplacian damps the velocity gradient, thus trajectories are pushed toward the origin in
 $Q{-}R$
space. Note that the DNS results show some slight deviation from pure damping structure. For example, near
 $Q=0$
for
 $R>0$
, there is an upward trend in the streamlines instead of proceeding straight toward the origin. Each of the models fail to capture this effect. Thus, updating the upstream conditions of the conditional viscous Hessian produces minimal changes in the behaviour of the closure. It appears that the upstream isotropic assumption of RFD model for the viscous term produces relatively more accurate results than was the case for the pressure Hessian.
In terms of magnitude, the RFD model is too strong. The EGF model produces good agreement with DNS in magnitude for the
 $Q<0$
,
 $R>0$
region near the Vieillefosse tail, while it is too weak in the
 $Q>0$
,
 $R<0$
region. The RDGF model has magnitudes in good agreement with DNS for
 $Q>0$
,
 $R<0$
but is too strong in the
 $Q<0$
,
 $R>0$
along the Vieillefosse tail.
The above
 $Q{-}R$
-space analysis shows advantages of the EGF and RDGF closures over the RFD closure. Of particular importance is that the RFD pressure Hessian does not have a strong tendency to decrease
 $R$
. The structure of the deviatoric pressure Hessian from the Gaussian fields provides this effect. Furthermore, the RFD model’s overprediction of magnitude for both of the unclosed terms results in the overly compact joint-PDF contours seen in figure 6.
5.6 Correlation coefficients
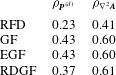
It is interesting to compare the a priori success of each model in terms of correlation coefficients for the deviatoric part of the pressure Hessian and the viscous Laplacian. For the deviatoric part of the pressure Hessian, the correlation coefficient is defined as
 $$\begin{eqnarray}\unicode[STIX]{x1D70C}_{\boldsymbol{P}^{(d)}}=\frac{\langle \unicode[STIX]{x1D617}_{ij}^{(d),DNS}\unicode[STIX]{x1D617}_{ij}^{(d),model}\rangle }{\sqrt{\langle \unicode[STIX]{x1D617}_{mn}^{(d),DNS}\unicode[STIX]{x1D617}_{mn}^{(d),DNS}\rangle \langle \unicode[STIX]{x1D617}_{pq}^{(d),model}\unicode[STIX]{x1D617}_{pq}^{(d),model}\rangle }}.\end{eqnarray}$$
A similar correlation coefficient is also defined for the viscous Laplacian. These are computed using eighth-order finite differencing from an ensemble of 10 million points in the DNS results.
Table 5 shows the resulting correlation coefficients. Included also is the original GF closure of Wilczek & Meneveau (Reference Wilczek and Meneveau2014), which did not provide a statistically stationary solution but rather succumbs to the finite-time singularity similar to the restricted Euler model. Overall, the viscous Laplacian models are more successful than the pressure Hessian models. The RFD model has the lowest a priori correlation coefficients for both closures. The difference between the GF and EGF model in table 5 is minimal.
The RDGF model actually shows slightly lower correlation for its pressure Hessian model, indicating that the effect of the recent deformation on the Gaussian structure is perhaps not as helpful as one might have hoped. Perhaps the real advantage of the recent deformation is that the magnitude is increased without abandoning the analytical coefficients (i.e.
 $\unicode[STIX]{x1D6FC}=-2/7$
,
 $\unicode[STIX]{x1D6FD}=-2/5$
). The effect is that the singularity is avoided without recourse to DNS-tuned coefficients.
Correlation coefficients for three models with DNS results at
 $Re_{\unicode[STIX]{x1D706}}=430$
.

5.7 Computational cost
It is useful to mention that these three models are not equal in terms of computational cost. The above results were computed using a Fortran 90 code executed on a single processor. A minimal code involving only time advancement of the velocity gradient tensor without any statistical calculations was timed for the three models. It was found that, per time step, the RFD model requires approximately 1.5 times longer than the EGF model, while the RDGF model takes approximately 2.5 times longer. It is worth noting, however, that the RFD and RDGF models were found to run smoothly and accurately with a time step of
 $\text{d}t=0.04\unicode[STIX]{x1D70F}_{\unicode[STIX]{x1D702}}$
, while the EGF model required a time step of
 $\text{d}t=0.01\unicode[STIX]{x1D70F}_{\unicode[STIX]{x1D702}}$
to avoid a singularity. Even with such a small time step, the stochastic system exhibited rare rogue trajectories that had an overwhelming effect on the flatness factors, preventing convergence in a reasonable amount of time (e.g. trajectories advanced for
 $1000\unicode[STIX]{x1D70F}_{\unicode[STIX]{x1D702}}$
). We note that Wilczek & Meneveau (Reference Wilczek and Meneveau2014) used an even smaller time step of
 $\text{d}t=0.001\unicode[STIX]{x1D70F}_{\unicode[STIX]{x1D702}}$
. Therefore, the computational cost advantage of EGF model is not realized. The RFD model does have a computation cost per time step approximately 40 % smaller than that of the RDGF model.
6 Conclusions
In this paper, a new closure, the recent deformation of Gaussian fields (RDGF) mapping closure, for the pressure Hessian and viscous Laplacian along Lagrangian trajectories in turbulent flow is introduced. The new closure benefits from the insights of both the RFD and GF closures. The GF closure calculations are applied for the initial upstream conditions of the conditional pressure Hessian and viscous Laplacian, before performing a recent fluid deformation mapping to complete the closure. The coefficients for Gaussian fields can be used and three remaining free parameters related to forcing and time scale are constrained so that the model reproduces known exact statistical relations. The stochastic forcing for this model is also generalized from that used for the previous models so that the magnitude of the symmetric and anti-symmetric forcings can be applied independently.
A priori evaluation of the models in terms of correlation coefficients and
 $Q{-}R$
-space velocities reveals the shortcomings of RFD closure: the magnitudes of the unclosed terms are significantly overestimated and the role of the pressure Hessian in decreasing the
 $R$
invariant is absent. These shortcomings are much improved using the conditional pressure Hessian from Gaussian fields. On the other hand, the exponential nonlinearity of the recent-deformation tensor allows for more effective prevention of singularities. As a result, the RDGF model does not require DNS-tuned coefficients in order to prevent the singularity. In this way, the RDGF model has the robustness and analytical closedness of the RFD model while providing a more realistic structure of the pressure Hessian from the GF closure.
A comparison of various single-time statistics suggests that the RDGF model can provide excellent results in comparison to the two previous models. However, by comparison with DNS at
 $Re_{\unicode[STIX]{x1D706}}=430$
, the quantitative results reveal remaining shortcomings such as lack of increasing long tails and intermittency. The RDGF results seem more consistent with lower Reynolds number DNS results. This highlights one of the major limitations of the current model, that it does not include a robust way of changing the Reynolds number whereas velocity gradient statistics are known to depend strongly on Reynolds number. The RFD model does include a mechanism for increasing the Reynolds number, but only in a very limited range. In fact, RFD applied for
 $Re_{\unicode[STIX]{x1D706}}\approx 430$
is already outside the range where it performs well. The RDGF mapping closure suffers these same drawbacks as RFD, even if the skewness factor is adjusted to reflect its (weak) dependence on Reynolds number.
In summary, this paper builds a new closure framework for the conditional pressure Hessian and viscous Laplacian which leverages insights of previous approaches. It provides, therefore, a promising direction for future investigations of velocity gradient statistics in isotropic turbulence. At sufficiently high Reynolds numbers, where approximate isotropy of small scales is a safe assumption, models for isotropic turbulence can be applicable for a more general class of turbulent flows, for which some applications may find efficient access to velocity gradient statistics useful.
Acknowledgements
P.L.J. was supported by a National Science Foundation Graduate Research Fellowship under grant no. DGE-1232825, and C.M. by a grant from the NSF CBET-1507469. P.L.J. thanks M. Wilczek for many insightful discussions during his time at John Hopkins University.
Appendix A. Isotropic tensorial stochastic forcing for symmetric and anti-symmetric components
In this appendix, the form of the stochastic forcing in (2.6) is established. As identified in the text, the forcing should have the form
 $\text{d}F_{ij}=\unicode[STIX]{x1D623}_{ijk\ell }\,\text{d}W_{k\ell }$
, and can be thought of as a sum of symmetric and anti-symmetric forcing,
 $\text{d}F_{ij}=\text{d}F_{ij}^{(s)}+\text{d}F_{ij}^{(a)}$
, where
 $\text{d}F_{ij}^{(s)}=(\text{d}F_{ij}+\text{d}F_{ji})/2$
and
 $\text{d}F_{ij}^{(a)}=(\text{d}F_{ij}-\text{d}F_{ji})/2$
. Since
 $\text{d}W_{ij}$
represents a tensorial Wiener process, i.e.
 $\langle W_{ij}\rangle =0$
and
 $\langle \text{d}W_{ij}\,\text{d}W_{k\ell }\rangle =\unicode[STIX]{x1D6FF}_{ik}\unicode[STIX]{x1D6FF}_{j\ell }\,\text{d}t$
, then
 $$\begin{eqnarray}\langle \text{d}F_{ij}\,\text{d}F_{k\ell }\rangle =\unicode[STIX]{x1D623}_{ijmn}\unicode[STIX]{x1D623}_{k\ell mn}\,\text{d}t=\unicode[STIX]{x1D60B}_{ijk\ell }\,\text{d}t.\end{eqnarray}$$
Therefore, the forcing contributes a variance growth rate of
 $$\begin{eqnarray}\text{d}\langle F_{ij}F_{ij}\rangle =\langle \text{d}F_{ij}\,\text{d}F_{ij}\rangle =\unicode[STIX]{x1D60B}_{ijij}\,\text{d}t\end{eqnarray}$$
and furthermore, the symmetric and anti-symmetric variance growth rates are
 $$\begin{eqnarray}\displaystyle & \displaystyle \text{d}\langle F_{ij}^{(s)}F_{ij}^{(s)}\rangle =\langle \text{d}F_{ij}^{(s)}\,\text{d}F_{ij}^{(s)}\rangle ={\textstyle \frac{1}{2}}(\unicode[STIX]{x1D60B}_{ijij}+\unicode[STIX]{x1D60B}_{ijji})\,\text{d}t\equiv D_{s}\,\text{d}t. & \displaystyle\end{eqnarray}$$
 $$\begin{eqnarray}\displaystyle & \displaystyle \text{d}\langle F_{ij}^{(a)}F_{ij}^{(a)}\rangle =\langle \text{d}F_{ij}^{(a)}\,\text{d}F_{ij}^{(a)}\rangle ={\textstyle \frac{1}{2}}(\unicode[STIX]{x1D60B}_{ijij}-\unicode[STIX]{x1D60B}_{ijji})\,\text{d}t=D_{a}\,\text{d}t. & \displaystyle\end{eqnarray}$$
 $D_{s}$
and
 $D_{a}$
represent the growth rate of the variance of symmetric and anti-symmetric parts of the forcing.
To model isotropic turbulence, the stochastic forcing should be statistically isotropic. The most general isotropic form for the diffusion tensor is
 $$\begin{eqnarray}\unicode[STIX]{x1D60B}_{ijk\ell }=d_{1}\unicode[STIX]{x1D6FF}_{ij}\unicode[STIX]{x1D6FF}_{k\ell }+d_{2}\unicode[STIX]{x1D6FF}_{ik}\unicode[STIX]{x1D6FF}_{j\ell }+d_{3}\unicode[STIX]{x1D6FF}_{i\ell }\unicode[STIX]{x1D6FF}_{jk}.\end{eqnarray}$$
Requiring also that the forcing be trace free (incompressibility), then
 $$\begin{eqnarray}\unicode[STIX]{x1D60B}_{iik\ell }=(3d_{1}+d_{2}+d_{3})\unicode[STIX]{x1D6FF}_{k\ell }=0.\end{eqnarray}$$
Combining this constraint with the two definitions of
 $D_{s}$
and
 $D_{a}$
given above,
 $$\begin{eqnarray}\displaystyle & \displaystyle D_{s}={\textstyle \frac{1}{2}}(\unicode[STIX]{x1D60B}_{ijij}+\unicode[STIX]{x1D60B}_{ijji})=3d_{1}+6d_{2}+6d_{3}, & \displaystyle\end{eqnarray}$$
 $$\begin{eqnarray}\displaystyle & \displaystyle D_{a}={\textstyle \frac{1}{2}}(\unicode[STIX]{x1D60B}_{ijij}-\unicode[STIX]{x1D60B}_{ijji})=3d_{2}-3d_{3}, & \displaystyle\end{eqnarray}$$
 $$\begin{eqnarray}\unicode[STIX]{x1D60B}_{ijk\ell }=-\frac{D_{s}}{15}\unicode[STIX]{x1D6FF}_{ij}\unicode[STIX]{x1D6FF}_{k\ell }+\left(\frac{D_{s}}{10}+\frac{D_{a}}{6}\right)\unicode[STIX]{x1D6FF}_{ik}\unicode[STIX]{x1D6FF}_{j\ell }+\left(\frac{D_{s}}{10}-\frac{D_{a}}{6}\right)\unicode[STIX]{x1D6FF}_{i\ell }\unicode[STIX]{x1D6FF}_{jk}.\end{eqnarray}$$
The choice of
 $D_{s}=D_{a}=15$
reduces to the form of Chevillard and Meneveau (Chevillard et al.
Reference Chevillard, Meneveau, Biferale and Toschi2008) used for the RFD model,
 $$\begin{eqnarray}\unicode[STIX]{x1D60B}_{ijk\ell }=-\unicode[STIX]{x1D6FF}_{ij}\unicode[STIX]{x1D6FF}_{k\ell }+4\unicode[STIX]{x1D6FF}_{ik}\unicode[STIX]{x1D6FF}_{j\ell }-\unicode[STIX]{x1D6FF}_{i\ell }\unicode[STIX]{x1D6FF}_{jk}.\end{eqnarray}$$
To implement this forcing, however, the tensor
 $\unicode[STIX]{x1D623}_{ijk\ell }$
is necessary, thus the equation
 $\unicode[STIX]{x1D623}_{ijmn}\unicode[STIX]{x1D623}_{k\ell mn}=\unicode[STIX]{x1D60B}_{ijk\ell }$
must be solved. Using the general isotropic form
 $$\begin{eqnarray}\unicode[STIX]{x1D623}_{ijk\ell }=\unicode[STIX]{x1D623}_{1}\unicode[STIX]{x1D6FF}_{ij}\unicode[STIX]{x1D6FF}_{k\ell }+\unicode[STIX]{x1D623}_{2}\unicode[STIX]{x1D6FF}_{ik}\unicode[STIX]{x1D6FF}_{j\ell }+\unicode[STIX]{x1D623}_{3}\unicode[STIX]{x1D6FF}_{i\ell }\unicode[STIX]{x1D6FF}_{jk},\end{eqnarray}$$
the tensor contractions yield the following system of equations,
 $$\begin{eqnarray}\displaystyle & \displaystyle d_{1}=3\unicode[STIX]{x1D623}_{1}^{2}+2\unicode[STIX]{x1D623}_{1}\unicode[STIX]{x1D623}_{2}+2\unicode[STIX]{x1D623}_{1}\unicode[STIX]{x1D623}_{3}=-\frac{D_{s}}{15}, & \displaystyle\end{eqnarray}$$
 $$\begin{eqnarray}\displaystyle & \displaystyle d_{2}=\unicode[STIX]{x1D623}_{2}^{2}+\unicode[STIX]{x1D623}_{3}^{2}=\frac{D_{s}}{10}+\frac{D_{a}}{6}, & \displaystyle\end{eqnarray}$$
 $$\begin{eqnarray}\displaystyle & \displaystyle d_{3}=2\unicode[STIX]{x1D623}_{2}\unicode[STIX]{x1D623}_{3}=\frac{D_{s}}{10}-\frac{D_{a}}{6}. & \displaystyle\end{eqnarray}$$
 $$\begin{eqnarray}\unicode[STIX]{x1D623}_{ijk\ell }=-\frac{1}{3}\sqrt{\frac{D_{s}}{5}}\unicode[STIX]{x1D6FF}_{ij}\unicode[STIX]{x1D6FF}_{k\ell }+\frac{1}{2}\left(\sqrt{\frac{D_{s}}{5}}+\sqrt{\frac{D_{a}}{3}}\right)\unicode[STIX]{x1D6FF}_{ik}\unicode[STIX]{x1D6FF}_{j\ell }+\frac{1}{2}\left(\sqrt{\frac{D_{s}}{5}}-\sqrt{\frac{D_{a}}{3}}\right)\unicode[STIX]{x1D6FF}_{i\ell }\unicode[STIX]{x1D6FF}_{jk},\end{eqnarray}$$
which reduces to the form of Chevillard et al. (Reference Chevillard, Meneveau, Biferale and Toschi2008) with the choice
 $D_{s}=D_{a}=15$
. Meanwhile, Wilczek & Meneveau (Reference Wilczek and Meneveau2014) tuned
 $D_{s}=D_{a}$
such that the definition of
 $\unicode[STIX]{x1D70F}_{\unicode[STIX]{x1D702}}$
was consistent between model and numerics.
As shown by Wilczek & Meneveau (Reference Wilczek and Meneveau2014), the
 $D_{s}=D_{a}$
constraint can be derived by considering the gradient of homogeneous forcing. However, as pointed out in § 2.2, this stochastic forcing term must represent both the gradient of the large-scale forcing and the fluctuations of the unclosed terms about their conditional means, the latter of which is not subject to the above constraint. In the authors’ current view, e.g. considering (2.7) and (2.8), there is no a priori reason that the strain rate and vorticity should be forced stochastically with the same amplitude, therefore, the present model considers
 $D_{s}$
and
 $D_{a}$
to be two independent tuning parameters. In fact, given that the fluctuations of the pressure Hessian about its conditional mean,
 $\unicode[STIX]{x1D617}_{ij}^{\prime }$
, must be a symmetric tensor, it is somewhat realistic to expect
 $D_{s}>D_{a}$
.
Appendix B. Analytical calculation of
$\unicode[STIX]{x1D6FE}$
for the Gaussian fields representation of the conditional pressure Hessian

A key component to both the enhanced Gaussian closure and the recent deformation of Gaussian fields mapping closure is the representation of a conditional pressure Hessian using (2.20). While the coefficients
 $\unicode[STIX]{x1D6FC}$
and
 $\unicode[STIX]{x1D6FD}$
were directly evaluated from the Gaussian fields closure, the last coefficient is determined by the details of the longitudinal correlation function, (2.21). Calculations are easier using the longitudinal structure function
 $D_{LL}(r)=2\overline{u^{2}}(1-f(r))$
,
 $$\begin{eqnarray}\unicode[STIX]{x1D6FE}=\frac{6}{25}+\frac{16}{75D_{LL}^{\prime \prime }(0)^{2}}\int _{0}^{\infty }\frac{D_{LL}^{\prime }(r)D_{LL}^{\prime \prime \prime }(r)}{r}\,\text{d}r,\end{eqnarray}$$
where
 $D_{LL}^{\prime \prime }(0)=2\unicode[STIX]{x1D716}/15\unicode[STIX]{x1D708}$
according to the proper viscous range behaviour. Using the approach of Batchelor (Reference Batchelor1951), the viscous and inertial range behaviour of the structure function can be preserved using a blending function,
 $$\begin{eqnarray}D_{LL}(r)=\unicode[STIX]{x1D60A}_{2}\unicode[STIX]{x1D716}^{2/3}r^{2/3}F\left(\frac{r}{\unicode[STIX]{x1D6FE}_{2}\unicode[STIX]{x1D702}}\right).\end{eqnarray}$$
Here, we assume K41 scaling for the inertial range with Kolmogorov coefficient
 $\unicode[STIX]{x1D60A}_{2}\approx 2.0$
(Pope Reference Pope2000). The blending function of Batchelor (Reference Batchelor1951) is
 $$\begin{eqnarray}F\left(\frac{r}{\unicode[STIX]{x1D6FE}_{2}\unicode[STIX]{x1D702}}\right)=\left[1+\left(\frac{r}{\unicode[STIX]{x1D6FE}_{2}\unicode[STIX]{x1D702}}\right)^{-2}\right]^{-2/3},\end{eqnarray}$$
where
 $\unicode[STIX]{x1D6FE}_{2}=(15\unicode[STIX]{x1D60A}_{2})^{3/4}\approx 13$
sets the cross-over point between viscous and inertial behaviour, recovering the correct viscous range behaviour. With the application of product rule differentiation, we can write
 $$\begin{eqnarray}\displaystyle & \displaystyle D_{LL}^{\prime }(r)=\unicode[STIX]{x1D60A}_{2}\unicode[STIX]{x1D716}^{2/3}r^{-1/3}F_{1}\left(\frac{r}{\unicode[STIX]{x1D6FE}_{2}\unicode[STIX]{x1D702}}\right), & \displaystyle\end{eqnarray}$$
 $$\begin{eqnarray}\displaystyle & \displaystyle D_{LL}^{\prime \prime \prime }(r)=\unicode[STIX]{x1D60A}_{2}\unicode[STIX]{x1D716}^{2/3}r^{-7/3}F_{3}\left(\frac{r}{\unicode[STIX]{x1D6FE}_{2}\unicode[STIX]{x1D702}}\right), & \displaystyle\end{eqnarray}$$
 $\hat{r}=r/\unicode[STIX]{x1D6FE}_{2}\unicode[STIX]{x1D702}$
,
 $$\begin{eqnarray}\unicode[STIX]{x1D6FE}={\textstyle \frac{6}{25}}+{\textstyle \frac{12}{225}}I,\end{eqnarray}$$
where
 $$\begin{eqnarray}I=\int _{0}^{\infty }\hat{r}^{-11/3}F_{1}(\hat{r})F_{3}(\hat{r})\,\text{d}\hat{r},\end{eqnarray}$$
with the derivative functions
 $$\begin{eqnarray}\displaystyle & \displaystyle & \displaystyle \displaystyle F_{1}(\hat{r})={\textstyle \frac{2}{3}}F(\hat{r})+\hat{r}F^{\prime }(\hat{r}),\end{eqnarray}$$
 $$\begin{eqnarray}\displaystyle & \displaystyle & \displaystyle \displaystyle F_{3}(\hat{r})={\textstyle \frac{8}{27}}F(\hat{r})-{\textstyle \frac{2}{3}}\hat{r}F^{\prime }(\hat{r})+2\hat{r}^{2}F^{\prime \prime }(\hat{r})+\hat{r}^{3}F^{\prime \prime \prime }(\hat{r}).\end{eqnarray}$$
 $r<13\unicode[STIX]{x1D702}$
. Without considering the details of the integration, the manipulation so far shows that
 $\unicode[STIX]{x1D6FE}$
is (approximately) independent of
 $Re_{\unicode[STIX]{x1D706}}$
(neglecting weak
 $Re_{\unicode[STIX]{x1D706}}$
effects on the cutoff scale), and its precise value is difficult to determine because it will depend heavily on the details of the blending function used.
Integrand in (B 7) plotted in normalized variables
 $\hat{r}=r/\unicode[STIX]{x1D6FE}_{2}\unicode[STIX]{x1D702}$
with
 $\unicode[STIX]{x1D6FE}_{2}\approx 13$
.

The integral can be written fully as
 $$\begin{eqnarray}\displaystyle I & = & \displaystyle \int _{0}^{\infty }\left[\frac{16}{81}(1+\hat{r}^{2})^{-4/3}+\frac{416}{81}(1+\hat{r}^{2})^{-7/3}-\frac{304}{27}(1+\hat{r}^{2})^{-10/3}\right.\nonumber\\ \displaystyle & & \displaystyle -\left.\frac{2080}{81}(1+\hat{r}^{2})^{-13/3}+\frac{2560}{81}(1+\hat{r}^{2})^{-16/3}\right]\frac{\text{d}\hat{r}}{\hat{r}}.\end{eqnarray}$$
To integrate, add
 $$\begin{eqnarray}\left(\frac{16}{81}+\frac{416}{81}-\frac{304}{27}-\frac{2080}{81}+\frac{2560}{81}\right)\frac{(1+\hat{r}^{2})^{-1/3}}{\hat{r}}=0,\end{eqnarray}$$
to the integrand and use the change of variables,
 $$\begin{eqnarray}\unicode[STIX]{x1D701}=1+\hat{r}^{2},\quad \frac{\text{d}\unicode[STIX]{x1D701}}{2(\unicode[STIX]{x1D701}-1)}=\frac{\text{d}\hat{r}}{\hat{r}}.\end{eqnarray}$$
As a result, the integral becomes
 $$\begin{eqnarray}\displaystyle I & = & \displaystyle \frac{1}{2}\int _{1}^{\infty }\left[-\frac{16}{81}\unicode[STIX]{x1D701}^{-4/3}-\frac{416}{81}\unicode[STIX]{x1D701}^{-7/3}(\unicode[STIX]{x1D701}+1)+\frac{304}{27}\unicode[STIX]{x1D701}^{-10/3}(\unicode[STIX]{x1D701}^{2}+\unicode[STIX]{x1D701}+1)\right.\nonumber\\ \displaystyle & & \displaystyle +\left.\frac{2080}{81}\unicode[STIX]{x1D701}^{-13/3}(\unicode[STIX]{x1D701}^{3}+\unicode[STIX]{x1D701}^{2}+\unicode[STIX]{x1D701}+1)-\frac{2560}{81}\unicode[STIX]{x1D701}^{-16/3}(\unicode[STIX]{x1D701}^{4}+\unicode[STIX]{x1D701}^{3}+\unicode[STIX]{x1D701}^{2}+\unicode[STIX]{x1D701}+1)\right]\text{d}\unicode[STIX]{x1D701}.\end{eqnarray}$$
Then algebraic simplification
 $$\begin{eqnarray}I=\frac{1}{2}\int _{1}^{\infty }\left[\frac{16}{81}\unicode[STIX]{x1D701}^{-7/3}+\frac{432}{81}\unicode[STIX]{x1D701}^{-10/3}-\frac{480}{81}\unicode[STIX]{x1D701}^{-13/3}-\frac{2560}{81}\unicode[STIX]{x1D701}^{-16/3}\right]\text{d}\unicode[STIX]{x1D701},\end{eqnarray}$$
and completing the power-law integrations results in
 $$\begin{eqnarray}I=-{\textstyle \frac{302}{91}}.\end{eqnarray}$$
Substitution of this results leads to
 $$\begin{eqnarray}\unicode[STIX]{x1D6FE}={\textstyle \frac{86}{1365}}\approx 0.063.\end{eqnarray}$$
Appendix C. Gaussian fields approximation for the conditional Hessian of the velocity gradient
This appendix details the derivation of (3.3) in the main text, following the method outlined in Wilczek & Meneveau (Reference Wilczek and Meneveau2014). The characteristic functional of the turbulent velocity field,
 $$\begin{eqnarray}\unicode[STIX]{x1D719}^{u}[\unicode[STIX]{x1D740}(\boldsymbol{x})]=\left\langle \exp \left(\text{i}\int \unicode[STIX]{x1D706}_{i}(\boldsymbol{x})u_{i}(\boldsymbol{x})\,\text{d}\boldsymbol{x}\right)\right\rangle ,\end{eqnarray}$$
contains all the statistical information necessary to compute the desired conditional mean, namely
 $\langle \unicode[STIX]{x2202}^{2}\unicode[STIX]{x1D608}_{ij}/\unicode[STIX]{x2202}x_{p}\unicode[STIX]{x2202}x_{q}|\mathbf{\mathscr{A}}\rangle$
. To make progress analytically, the turbulent velocity field is taken to be Gaussian, meaning that all
 $n$
-point PDFs are joint Gaussian,
 $$\begin{eqnarray}\unicode[STIX]{x1D719}^{u}[\unicode[STIX]{x1D740}(\boldsymbol{x})]=\exp \left(-\frac{1}{2}\int \int \unicode[STIX]{x1D706}_{i}(\boldsymbol{x})\unicode[STIX]{x1D609}_{ij}(\boldsymbol{x},\boldsymbol{x}^{\prime })\unicode[STIX]{x1D706}_{j}(\boldsymbol{x}^{\prime })\text{d}\boldsymbol{x}\,\text{d}\boldsymbol{x}^{\prime }\right),\end{eqnarray}$$
where
 $\unicode[STIX]{x1D609}_{ij}$
is the two-point covariance tensor, which for homogeneous isotropic turbulence depends only on the separation vector,
 $\boldsymbol{r}=\boldsymbol{x}-\boldsymbol{x}^{\prime }$
, and has the form
 $$\begin{eqnarray}\unicode[STIX]{x1D609}_{ij}(\boldsymbol{x},\boldsymbol{x}^{\prime })=\unicode[STIX]{x1D609}_{ij}(\boldsymbol{r})=\langle u_{1}^{2}\rangle \left[f(r)\unicode[STIX]{x1D6FF}_{ij}+{\textstyle \frac{1}{2}}rf^{\prime }(r)(\unicode[STIX]{x1D6FF}_{ij}-\hat{r}_{i}\hat{r}_{j})\right],\end{eqnarray}$$
where
 $r=|\boldsymbol{r}|$
and
 $\hat{r}_{i}=r_{i}/r$
. In this way the characteristic functional, when assumed Gaussian for isotropic turbulence, is uniquely specified by the longitudinal velocity correlation function,
 $$\begin{eqnarray}f(r)=\frac{\langle u_{1}(\boldsymbol{x})u_{1}(\boldsymbol{x}+r\boldsymbol{e}_{1})\rangle }{\langle u_{1}^{2}\rangle }.\end{eqnarray}$$
With integration by parts, the relationship between the characteristic functional for the velocity field and that of the velocity gradient field can be shown to be
 $$\begin{eqnarray}\unicode[STIX]{x1D719}^{A}[\unicode[STIX]{x1D726}]=\unicode[STIX]{x1D719}^{u}[-\unicode[STIX]{x1D735}\boldsymbol{\cdot }\unicode[STIX]{x1D726}].\end{eqnarray}$$
Again, with integration by parts, substituting this relationship into the Gaussian characteristic functional for the velocity field,
 $$\begin{eqnarray}\unicode[STIX]{x1D719}^{A}[\unicode[STIX]{x1D726}(\boldsymbol{x})]=\exp \left(-\frac{1}{2}\int \int \unicode[STIX]{x1D6EC}_{ik}(\boldsymbol{x})\unicode[STIX]{x1D60A}_{ijk\ell }(\boldsymbol{x},\boldsymbol{x}^{\prime })\unicode[STIX]{x1D6EC}_{j\ell }(\boldsymbol{x}^{\prime })\,\text{d}\boldsymbol{x}\,\text{d}\boldsymbol{x}^{\prime }\right),\end{eqnarray}$$
where
 $$\begin{eqnarray}\unicode[STIX]{x1D60A}_{ijk\ell }(\boldsymbol{x},\boldsymbol{x}^{\prime })=\frac{\unicode[STIX]{x2202}^{2}\unicode[STIX]{x1D609}_{ij}}{\unicode[STIX]{x2202}x_{k}\unicode[STIX]{x2202}x_{\ell }^{\prime }}(\boldsymbol{x},\boldsymbol{x}^{\prime })=\langle \unicode[STIX]{x1D608}_{ik}(\boldsymbol{x})\unicode[STIX]{x1D608}_{j\ell }(\boldsymbol{x}^{\prime })\rangle ,\end{eqnarray}$$
is the covariance tensor for the velocity gradient, which only depends on
 $\boldsymbol{r}=\boldsymbol{x}-\boldsymbol{x}^{\prime }$
. It is computed from the Hessian of the velocity covariance tensor,
 $$\begin{eqnarray}\displaystyle \unicode[STIX]{x1D60A}_{ijk\ell }(\boldsymbol{r}) & = & \displaystyle -\frac{\unicode[STIX]{x2202}^{2}\unicode[STIX]{x1D609}_{ij}}{\unicode[STIX]{x2202}r_{k}\unicode[STIX]{x2202}r_{\ell }}=\langle u_{1}^{2}\rangle \left[\left(-\frac{3}{2}\frac{f^{\prime }(r)}{r}-\frac{1}{2}f^{\prime \prime }(r)\right)(\unicode[STIX]{x1D6FF}_{ij}\unicode[STIX]{x1D6FF}_{k\ell })+\left(\frac{1}{2}\frac{f^{\prime }(r)}{r}\right)(\unicode[STIX]{x1D6FF}_{ik}\unicode[STIX]{x1D6FF}_{j\ell }+\unicode[STIX]{x1D6FF}_{i\ell }\unicode[STIX]{x1D6FF}_{jk})\right.\nonumber\\ \displaystyle & & \displaystyle +\left(\frac{3}{2}\frac{f^{\prime }(r)}{r}-\frac{3}{2}f^{\prime \prime }(r)-\frac{1}{2}rf^{\prime \prime \prime }(r)\right)(\unicode[STIX]{x1D6FF}_{ij}\hat{r}_{k}\hat{r}_{\ell })\nonumber\\ \displaystyle & & \displaystyle +\left(-\frac{1}{2}\frac{f^{\prime }(r)}{r}+\frac{1}{2}f^{\prime \prime }(r)\right)(\unicode[STIX]{x1D6FF}_{i\ell }\hat{r}_{j}\hat{r}_{k}+\unicode[STIX]{x1D6FF}_{k\ell }\hat{r}_{i}\hat{r}_{j}+\unicode[STIX]{x1D6FF}_{j\ell }\hat{r}_{i}\hat{r}_{k}+\unicode[STIX]{x1D6FF}_{ik}\hat{r}_{j}\hat{r}_{\ell }+\unicode[STIX]{x1D6FF}_{jk}\hat{r}_{i}\hat{r}_{\ell })\nonumber\\ \displaystyle & & \displaystyle \times \left.\left(\frac{3}{2}\frac{f^{\prime }(r)}{r}-\frac{3}{2}f^{\prime \prime }(r)+\frac{1}{2}rf^{\prime \prime \prime }(r)\right)(\hat{r}_{i}\hat{r}_{j}\hat{r}_{k}\hat{r}_{\ell })\right].\end{eqnarray}$$
The desired statistical quantity in this exercise is
 $$\begin{eqnarray}\unicode[STIX]{x1D708}\left\langle \left.\frac{\unicode[STIX]{x2202}^{2}\unicode[STIX]{x1D608}_{ij}}{\unicode[STIX]{x2202}x_{k}\unicode[STIX]{x2202}x_{\ell }}\right|\mathbf{\mathscr{A}}\right\rangle =\unicode[STIX]{x1D708}\lim _{r\rightarrow 0}\frac{\unicode[STIX]{x2202}^{2}}{\unicode[STIX]{x2202}r_{k}\unicode[STIX]{x2202}r_{\ell }}\langle \unicode[STIX]{x1D608}_{ij}(\boldsymbol{x}+\boldsymbol{r})|\mathbf{\mathscr{A}}(\boldsymbol{x})\rangle .\end{eqnarray}$$
Following exactly the steps outlined in Appendix B 2 of Wilczek & Meneveau (Reference Wilczek and Meneveau2014),
 $$\begin{eqnarray}\langle \unicode[STIX]{x1D608}_{ij}(\boldsymbol{x}+\boldsymbol{r})|\mathbf{\mathscr{A}}(\boldsymbol{x})\rangle =\unicode[STIX]{x1D60A}_{ikj\ell }(\boldsymbol{r})\unicode[STIX]{x1D60A}_{km\ell n}^{-1}(\mathbf{0})\mathscr{A}_{mn},\end{eqnarray}$$
where equality at the origin means
 $$\begin{eqnarray}\unicode[STIX]{x1D60A}_{km\ell n}^{-1}(\mathbf{0})=\frac{2}{15\langle u_{1}^{2}\rangle f^{\prime \prime }(0)}(-4\unicode[STIX]{x1D6FF}_{km}\unicode[STIX]{x1D6FF}_{\ell n}-\unicode[STIX]{x1D6FF}_{kn}\unicode[STIX]{x1D6FF}_{m\ell }),\end{eqnarray}$$
see Appendix B 1 of Wilczek & Meneveau (Reference Wilczek and Meneveau2014) for details. Combining expressions,
 $$\begin{eqnarray}\unicode[STIX]{x1D708}\left\langle \left.\frac{\unicode[STIX]{x2202}^{2}\unicode[STIX]{x1D608}_{ij}}{\unicode[STIX]{x2202}x_{p}\unicode[STIX]{x2202}x_{q}}\right|\mathbf{\mathscr{A}}\right\rangle =\unicode[STIX]{x1D708}\lim _{r\rightarrow 0}\frac{\unicode[STIX]{x2202}^{2}\unicode[STIX]{x1D60A}_{ikj\ell }}{\unicode[STIX]{x2202}r_{p}\unicode[STIX]{x2202}r_{q}}\unicode[STIX]{x1D60A}_{km\ell n}^{-1}(\mathbf{0})\mathscr{A}_{mn}.\end{eqnarray}$$
A tedious calculation by twice taking the gradient of (C 8) results in
 $$\begin{eqnarray}\displaystyle \lim _{r\rightarrow 0}\frac{\unicode[STIX]{x2202}^{2}\unicode[STIX]{x1D60A}_{ikj\ell }}{\unicode[STIX]{x2202}r_{p}\unicode[STIX]{x2202}r_{q}} & = & \displaystyle \langle u_{1}^{2}\rangle f^{(4)}(0)\left[-(\unicode[STIX]{x1D6FF}_{ik}\unicode[STIX]{x1D6FF}_{j\ell }\unicode[STIX]{x1D6FF}_{pq}+\unicode[STIX]{x1D6FF}_{ik}\unicode[STIX]{x1D6FF}_{jp}\unicode[STIX]{x1D6FF}_{\ell q}+\unicode[STIX]{x1D6FF}_{ik}\unicode[STIX]{x1D6FF}_{jq}\unicode[STIX]{x1D6FF}_{\ell p})\right.\nonumber\\ \displaystyle & & \displaystyle +\,\frac{1}{6}\! (\unicode[STIX]{x1D6FF}_{ij}\unicode[STIX]{x1D6FF}_{k\ell }\unicode[STIX]{x1D6FF}_{pq}\!+\unicode[STIX]{x1D6FF}_{i\ell }\unicode[STIX]{x1D6FF}_{kj}\unicode[STIX]{x1D6FF}_{pq}+\unicode[STIX]{x1D6FF}_{i\ell }\unicode[STIX]{x1D6FF}_{kp}\unicode[STIX]{x1D6FF}_{jq}+\unicode[STIX]{x1D6FF}_{i\ell }\unicode[STIX]{x1D6FF}_{jp}\unicode[STIX]{x1D6FF}_{kq}+\unicode[STIX]{x1D6FF}_{ip}\unicode[STIX]{x1D6FF}_{k\ell }\unicode[STIX]{x1D6FF}_{jq}+\unicode[STIX]{x1D6FF}_{iq}\unicode[STIX]{x1D6FF}_{k\ell }\unicode[STIX]{x1D6FF}_{jp}\nonumber\\ \displaystyle & & \displaystyle +\left.\unicode[STIX]{x1D6FF}_{j\ell }\unicode[STIX]{x1D6FF}_{kp}\unicode[STIX]{x1D6FF}_{iq}+\unicode[STIX]{x1D6FF}_{j\ell }\unicode[STIX]{x1D6FF}_{ip}\unicode[STIX]{x1D6FF}_{kq}+\unicode[STIX]{x1D6FF}_{ij}\unicode[STIX]{x1D6FF}_{kp}\unicode[STIX]{x1D6FF}_{\ell q}+\unicode[STIX]{x1D6FF}_{ij}\unicode[STIX]{x1D6FF}_{\ell p}\unicode[STIX]{x1D6FF}_{kq}+\unicode[STIX]{x1D6FF}_{kj}\unicode[STIX]{x1D6FF}_{ip}\unicode[STIX]{x1D6FF}_{\ell q}+\unicode[STIX]{x1D6FF}_{kj}\unicode[STIX]{x1D6FF}_{\ell p}\unicode[STIX]{x1D6FF}_{iq} )\right].\end{eqnarray}$$
Substitution of (C 11) and (C 13) into (C 12), followed by a calculation of tensor contractions, yields
 $$\begin{eqnarray}\displaystyle \unicode[STIX]{x1D708}\left\langle \left.\frac{\unicode[STIX]{x2202}^{2}\unicode[STIX]{x1D608}_{ij}}{\unicode[STIX]{x2202}x_{p}\unicode[STIX]{x2202}x_{q}}\right|\mathbf{\mathscr{A}}\right\rangle & = & \displaystyle \frac{2\unicode[STIX]{x1D708}f^{(4)}(0)}{15f^{\prime \prime }(0)}\left[\left(\frac{23}{6}\mathscr{A}_{ij}+\frac{1}{3}\mathscr{A}_{ji}\right)\unicode[STIX]{x1D6FF}_{pq}+\left(\frac{23}{6}\mathscr{A}_{iq}+\frac{1}{3}\mathscr{A}_{qi}\right)\unicode[STIX]{x1D6FF}_{jp}\right.\nonumber\\ \displaystyle & & \displaystyle +\left(\frac{23}{6}\mathscr{A}_{ip}+\frac{1}{3}\mathscr{A}_{pi}\right)\unicode[STIX]{x1D6FF}_{jq}-\left(\frac{5}{6}\mathscr{A}_{jq}+\frac{5}{6}\mathscr{A}_{qj}\right)\unicode[STIX]{x1D6FF}_{ip}\nonumber\\ \displaystyle & & \displaystyle \left.-\left(\frac{5}{6}\mathscr{A}_{jp}+\frac{5}{6}\mathscr{A}_{pj}\right)\unicode[STIX]{x1D6FF}_{iq}-\left(\frac{5}{6}\mathscr{A}_{pq}+\frac{5}{6}\mathscr{A}_{qp}\right)\unicode[STIX]{x1D6FF}_{ij}\right],\end{eqnarray}$$
Appendix D. Determination of
$\unicode[STIX]{x1D6FF}$
Using the enstrophy balance

Using the result of appendix C, the back-in-time velocity gradient Hessian is given by
 $$\begin{eqnarray}\unicode[STIX]{x1D708}\left\langle \left.\frac{\unicode[STIX]{x2202}^{2}\unicode[STIX]{x1D608}_{ij}}{\unicode[STIX]{x2202}X_{p}\unicode[STIX]{x2202}X_{q}}\right|\mathscr{A}\right\rangle =\unicode[STIX]{x1D6FF}\left(\unicode[STIX]{x1D61B}_{ij}\unicode[STIX]{x1D6FF}_{pq}+\unicode[STIX]{x1D61B}_{iq}\unicode[STIX]{x1D6FF}_{jp}+\unicode[STIX]{x1D61B}_{ip}\unicode[STIX]{x1D6FF}_{jq}-\frac{2}{21}\unicode[STIX]{x1D61A}_{jq}\unicode[STIX]{x1D6FF}_{ip}-\frac{2}{21}\unicode[STIX]{x1D61A}_{jp}\unicode[STIX]{x1D6FF}_{iq}-\frac{2}{21}\unicode[STIX]{x1D61A}_{pq}\unicode[STIX]{x1D6FF}_{ij}\right),\end{eqnarray}$$
where the coefficient
 $\unicode[STIX]{x1D6FF}$
can be written in terms of the enstrophy dissipation,
 $$\begin{eqnarray}\unicode[STIX]{x1D6FF}=\unicode[STIX]{x1D708}\frac{7}{3}\frac{f^{(4)}(0)}{f^{\prime \prime }(0)}=-\unicode[STIX]{x1D70F}_{\unicode[STIX]{x1D702}}^{2}\unicode[STIX]{x1D708}\left\langle \frac{\unicode[STIX]{x2202}\unicode[STIX]{x1D714}_{i}}{\unicode[STIX]{x2202}X_{j}}\frac{\unicode[STIX]{x2202}\unicode[STIX]{x1D714}_{i}}{\unicode[STIX]{x2202}X_{j}}\right\rangle .\end{eqnarray}$$
Note that since the Gaussian fields evaluation is back-in-time, this can be interpreted as the back-in-time enstrophy dissipation. By definition, the RFD-style mapping used to generate the approximate back-in-time values keeps velocity gradients constant, but not velocity Hessians. Therefore, the enstrophy production
 $\langle \unicode[STIX]{x1D714}_{i}\unicode[STIX]{x1D61A}_{ij}\unicode[STIX]{x1D714}_{j}\rangle$
is constant under the mapping but the enstrophy dissipation is not constant. Two choices are thus available: apply the enstrophy balance for the back-in-time enstrophy dissipation or try to invert the mapping effect on the enstrophy dissipation to apply the balance at the present time. It is the opinion of the authors that the second option is desirable, since it leads to the application of the enstrophy balance at the present time rather than back-in-time.
Thus, by modelling choice, the relevant enstrophy balance is
 $$\begin{eqnarray}\langle \unicode[STIX]{x1D714}_{i}\unicode[STIX]{x1D61A}_{ij}\unicode[STIX]{x1D714}_{j}\rangle =\unicode[STIX]{x1D708}\left\langle \frac{\unicode[STIX]{x2202}\unicode[STIX]{x1D714}_{i}}{\unicode[STIX]{x2202}x_{j}}\frac{\unicode[STIX]{x2202}\unicode[STIX]{x1D714}_{i}}{\unicode[STIX]{x2202}x_{j}}\right\rangle .\end{eqnarray}$$
To map the enstrophy dissipation forward in time,
 $$\begin{eqnarray}\left\langle \frac{\unicode[STIX]{x2202}\unicode[STIX]{x1D714}_{i}}{\unicode[STIX]{x2202}X_{j}}\frac{\unicode[STIX]{x2202}\unicode[STIX]{x1D714}_{i}}{\unicode[STIX]{x2202}X_{j}}\right\rangle =\left\langle \frac{\unicode[STIX]{x2202}x_{k}}{\unicode[STIX]{x2202}X_{j}}\frac{\unicode[STIX]{x2202}\unicode[STIX]{x1D714}_{i}}{\unicode[STIX]{x2202}x_{k}}\frac{\unicode[STIX]{x2202}\unicode[STIX]{x1D714}_{i}}{\unicode[STIX]{x2202}x_{\ell }}\frac{\unicode[STIX]{x2202}x_{\ell }}{\unicode[STIX]{x2202}X_{j}}\right\rangle =\left\langle \unicode[STIX]{x1D60A}_{k\ell }\frac{\unicode[STIX]{x2202}\unicode[STIX]{x1D714}_{i}}{\unicode[STIX]{x2202}x_{k}}\frac{\unicode[STIX]{x2202}\unicode[STIX]{x1D714}_{i}}{\unicode[STIX]{x2202}x_{\ell }}\right\rangle \approx \unicode[STIX]{x1D60A}_{k\ell }\left\langle \frac{\unicode[STIX]{x2202}\unicode[STIX]{x1D714}_{i}}{\unicode[STIX]{x2202}x_{k}}\frac{\unicode[STIX]{x2202}\unicode[STIX]{x1D714}_{i}}{\unicode[STIX]{x2202}x_{\ell }}\right\rangle .\end{eqnarray}$$
In the last step, the value of
 $\unicode[STIX]{x1D60A}_{k\ell }$
is localized by approximation, so that no ensemble averages are needed to advance the model stochastic equations. Finally, the enstrophy dissipation tensor is assumed isotropic,
 $$\begin{eqnarray}\left\langle \frac{\unicode[STIX]{x2202}\unicode[STIX]{x1D714}_{i}}{\unicode[STIX]{x2202}x_{k}}\frac{\unicode[STIX]{x2202}\unicode[STIX]{x1D714}_{i}}{\unicode[STIX]{x2202}x_{\ell }}\right\rangle \approx \frac{1}{3}\left\langle \frac{\unicode[STIX]{x2202}\unicode[STIX]{x1D714}_{i}}{\unicode[STIX]{x2202}x_{j}}\frac{\unicode[STIX]{x2202}\unicode[STIX]{x1D714}_{i}}{\unicode[STIX]{x2202}x_{j}}\right\rangle \unicode[STIX]{x1D6FF}_{k\ell }.\end{eqnarray}$$
Substituting, the resulting enstrophy balance is
 $$\begin{eqnarray}\langle \unicode[STIX]{x1D714}_{i}\unicode[STIX]{x1D61A}_{ij}\unicode[STIX]{x1D714}_{j}\rangle =\frac{3\unicode[STIX]{x1D708}}{\unicode[STIX]{x1D60A}_{kk}}\left\langle \frac{\unicode[STIX]{x2202}\unicode[STIX]{x1D714}_{i}}{\unicode[STIX]{x2202}X_{j}}\frac{\unicode[STIX]{x2202}\unicode[STIX]{x1D714}_{i}}{\unicode[STIX]{x2202}X_{j}}\right\rangle .\end{eqnarray}$$
Using the isotropic relation
 $\langle \unicode[STIX]{x1D714}_{i}\unicode[STIX]{x1D61A}_{ij}\unicode[STIX]{x1D714}_{j}\rangle =-7\mathscr{S}/6\sqrt{15}\unicode[STIX]{x1D70F}_{\unicode[STIX]{x1D702}}^{3}$
on the left-hand side and the definition of
 $\unicode[STIX]{x1D6FF}$
in terms of enstrophy dissipation on the right-hand side, the result is
 $$\begin{eqnarray}\unicode[STIX]{x1D6FF}=\frac{\unicode[STIX]{x1D60A}_{kk}}{3}\frac{7}{6\sqrt{15}}\frac{\mathscr{S}}{\unicode[STIX]{x1D70F}_{\unicode[STIX]{x1D702}}}.\end{eqnarray}$$
The result given by Wilczek & Meneveau (Reference Wilczek and Meneveau2014) is recovered when the mapping is removed,
 $\unicode[STIX]{x1D60B}_{ij}=\unicode[STIX]{x1D6FF}_{ij}$
, so that
 $\unicode[STIX]{x1D60A}_{kk}=3$
. In this way, the
 $\unicode[STIX]{x1D6FF}$
coefficient itself depends on the recent deformation. This provides the convenience of an additional nonlinearity in the viscous term to prevent unwanted singularities while advancing the stochastic differential equation.
As a final note, the scaling of
 $\unicode[STIX]{x1D6FF}\sim \unicode[STIX]{x1D70F}_{\unicode[STIX]{x1D702}}^{-1}$
contradicts the RFD model for the viscous Laplacian, which used the integral time scale and thus introduced a
 $Re_{\unicode[STIX]{x1D706}}^{-1}$
scaling for the viscous term. While
 $Re_{\unicode[STIX]{x1D706}}$
dependence can be introduced in the present model through the skewness coefficient, the similar difficulties as encountered by the RFD model are seen when going to large Reynolds numbers. It is the authors’ view that a fixed skewness coefficient,
 $\mathscr{S}=-0.6$
, is appropriate for the present model’s the level of fidelity.