1. INTRODUCCIÓN
En este trabajo nos proponemos estudiar la evolución de la desigualdad en la provincia de Buenos Aires desde finales del período colonial hasta los albores de la belle époque, cuando la región comenzaba la etapa de mayor crecimiento e integración en la economía mundial como exportadora de alimentos, alcanzando niveles de renta per cápita que la aproximaban a las naciones más ricas. Sin embargo, la forma en que se distribuía esa renta está mal estudiada y los trabajos disponibles, en general, arrancan a finales del siglo XIXFootnote 1 .
De manera que, en dichos estudios, se propone el inicio de una serie de fenómenos económicos que, al menos para la región del litoral, se pueden observar ya en la primera mitad del siglo de la independencia. Aunque en la segunda mitad del siglo XIX se impondría el modelo agroexportador en casi todo el territorio de la nación favorecido por varios factores como la constitución de la República unificada en 1862, la expansión de los ferrocarriles, la derrota de los indígenas en la llamada «conquista del desierto», la importación masiva de capitales y la inmigración, durante el medio siglo previo la región de Buenos Aires y del litoral conocen un proceso de características similares, que condicionaría lo que siguió y nos ayuda a entender muchos de sus rasgos.
En este proceso nos interesará estudiar cómo evolucionó la desigualdad, tema del mayor interés; no sólo porque permite observar los efectos del proceso económico en distintos sectores sociales sino también porque permite discutir desde este caso los modelos sobre la evolución de la desigualdad y su relación con el desempeño económico que propusieron diversos autores que son referencia mundial para pensarlos. En este sentido, resulta una referencia ineludible la propuesta de autores como J. Williamson, retomando el modelo Heckscher-Ohlin, quien postula que la globalización, al reforzar la utilización de los factores abundantes, produce un aumento relativo de su precio en relación al resto de los factores. De esta manera, la integración de Buenos Aires a la nueva economía atlántica de inicios del siglo XIX debería promover un deterioro de la relación entre el trabajo (escaso) y la tierra (abundante), dada la explotación extensiva del factor tierra. Si además se tiene en cuenta que la tierra se encuentra especialmente mal distribuida en América Latina, dicho modelo postula una etapa de creciente desigualdad en esta región (Williamson, Reference Williamson1998; O’Rourke y Williamson, Reference O’Rourke and Williamson2006 y O’Rourke, Taylor, y Williamson, Reference O’rourke, Taylor and Williamson1996).
En este trabajo, intentamos aproximarnos a la distribución del ingreso, ampliando trabajos anteriores sobre la distribución de la riqueza (Gelman y Santilli, Reference Gelman and Santilli2006 y Reference Gelman and Santilli2011). Como carecemos de estadísticas que permitan calcular los ingresos reales de las personas y los grupos, construimos indicadores para acercarnos a la «distribución funcional del ingreso», teniendo en cuenta los ingresos que corresponden a cada factor de producción. En la actualidad, se parte del cálculo del PBI y, a través del salario promedio y de la cantidad de asalariados, se establece la cuota que obtiene el trabajo. El resto, por diferencia, se atribuye al capital bajo la forma de renta de la tierra o de retribución al capital propiamente dichoFootnote 2 .
Pero en sociedades como la que nos ocupa, los datos no permiten realizar ese cálculo, sin incluir una gran cantidad de supuestos que debilitarían mucho los resultados obtenidosFootnote 3 . No sólo falta el monto del PBI sino que, muchas veces, carecemos de otros datos necesarios para descomponerlo, como la proporción de la población que obtiene sus recursos a través del salario, de la renta de la tierra o de la inversión de capital. Aun cuando sabemos que cuanto más retrocedamos en la historia y más nos concentremos en sociedades agrarias, más importancia pierde el salario entre los ingresos de los pobladores más humildes, no disponemos de datos que nos permitan cuantificar esta evoluciónFootnote 4 .
Por eso, aquí sólo buscamos acercarnos a esa distribución a través de la relación del salario con la renta de la tierra, como aproximación al ingreso relativo del trabajador y el propietario. Dado que no contamos con buenas series de renta, utilizamos el precio promedio de la hectárea como una aproximación a la misma, suponiendo que dicho precio expresa el anticipo de las ganancias que se esperan obtener de la tierraFootnote 5 .
De modo que, al observar la evolución de los precios de estos factores, se puede inferir que aquellos cuyos precios suben más se quedan con una porción mayor del ingreso. En otras palabras, si los salarios subieran más que la tierra se podría suponer que los trabajadores estaban recibiendo una porción creciente del ingreso en relación con los terratenientes y viceversa. Claro que estudiar esto se complica por el hecho de que la composición de estos factores en el proceso productivo de la región es cambiante y, por lo tanto, necesitaríamos saber el peso relativo del trabajo, de la tierra o del capital, para poder medir más finamente la evolución de la desigualdad. Esto es, obviamente, más difícil de estudiar con las fuentes disponibles, aunque podremos avanzar algunas «conjeturas informadas» al respecto.
Antes de seguir, es necesario hacer un breve racconto de la economía de Buenos Aires en el período.
Nuestro punto de partida es la creación del virreinato del Río de la Plata en 1776. Pese a los cambios introducidos en esta etapa, los estudios son contestes en afirmar que se trata de un período de «crecimiento y continuidad». Si bien es una época de cierto esplendor económico, Buenos Aires mantiene los principales rasgos de la etapa anterior: la ciudad, más poblada que la campaña, se ocupa de la intermediación entre la economía atlántica y el espacio virreinal, movilizando «efectos de Castilla» y esclavos contra la plata producida en la zona andina. Por su parte, el sector rural se dedicaba a la producción de alimentos para la ciudad, así como a la cría de ganados destinados a mercados regionales y sólo parcialmente a la exportación de derivados pecuarios por el puerto.
Tras la revolución de 1810, esto se modifica de manera radical al cortarse las posibilidades del tráfico que habían enriquecido a las elites y aparecer la posibilidad del crecimiento ganadero exportador que la revolución industrial impulsaba mediante un cambio fuerte en los términos de intercambio (Newland, Reference Newland1998). La revolución en los transportes marítimos y la liberalización comercial lo facilitaban al abaratar el intercambio entre los puertos atlánticos (O’Rourke y Williamson, Reference O’Rourke and Williamson2006). De esta manera, se inicia en Buenos Aires la «expansión ganadera», con una fuerte extensión de la frontera, un importante crecimiento demográfico natural y por migraciones, y un patrón económico en el que la clave era el acceso a tierra barata ante el encarecimiento del trabajo y del capital, algo característico de la región pero agravado por las guerras. Se ha podido observar que dicho crecimiento, pese a la legislación y las políticas sobre tierras que permitían una cierta concentración de este medio de producción, no provocó un proceso de concentración de la riqueza durante las primeras décadas que siguieron a la revolución. Recién hacia 1850-1860 se verifica una creciente desigualdad en la distribución de la propiedad que, sobre todo, resulta del fabuloso incremento demográfico, que no se acompaña de un aumento equivalente del número de propietarios. Igualmente, pueden haber influido un cambio en el patrón económico, más capital intensivo y, como veremos, el encarecimiento desproporcionado de la tierra (Gelman y Santilli, Reference Gelman and Santilli2006 y Reference Gelman and Santilli2011).
Hacia mediados de siglo, se introducen algunos cambios en la economía porteña que influyen en el patrón distributivo: en los 40, comienza el crecimiento de la producción ovina, que tendrá su apogeo en las décadas siguientes (Sábato, Reference Sábato1989), al igual que el desarrollo incipiente de un nuevo sector agrícola, limitado a algunas regiones y para abastecer el mercado interno (Djenderedjian, Reference Djenderedjian2008). Ambas actividades, más el desarrollo del sector artesanal y terciario, marcan el inicio de una economía con uso más intensivo de los factores productivos y con algunos cambios tecnológicos importantes (Míguez, Reference Míguez2008). En los años que siguen a la caída del gobierno de Rosas en 1852 hay una retracción de la frontera y su posterior crecimiento será lento hasta los años 70, pero se acelera a partir de 1879. De manera que ingresamos en una etapa (1850-1870) de una economía más capital intensiva, que busca aprovechar mejor una tierra que empieza a ser relativamente escasa para una población y una economía que han crecido de manera exponencial.
Es conveniente recordar la evolución demográfica entre esos años, así como el peso relativo de los propietarios de tierra. Mientras la población creció entre 1838 y 1869 a razón de un 4,3% anual, los propietarios lo hicieron en una escala menor: el 2,8% (Gelman y Santilli, Reference Gelman and Santilli2011). Sin embargo, no estamos en condiciones de dar cifras precisas sobre el tamaño de la población que, sin ser propietaria de tierra, tenía acceso a ella por otras vías. Esto nos permitiría medir el quántum de los asalariados (o, al menos, la cantidad potencial de trabajadores dependientes) por carecer de ninguna forma de acceso a los medios de producción. Con todo, los padrones de la época indican que en 1815 se podían contar 1,2 asalariados por cada productor independiente; en 1855, esa proporción había llegado a 1,9 y, en 1869, se registraron 3,6 trabajadores por cada productorFootnote 6 . Si bien no se trata de datos seguros, sí que permiten observar un movimiento creciente de salarización. Ello parece congruente con el dato señalado previamente sobre la reducción progresiva del porcentaje de propietarios en la población rural de la época a partir de 1840-1850.
Esto igual no resuelve un tema central para medir la distribución del ingreso: muchos de los que aparecen en estos censos como «estancieros», «labradores», etc. combinaban esa actividad con el trabajo asalariado eventual. De la misma manera, una parte de los asalariados tenía un terrenito en que cultivar o producir ganado en tierras de su patrón, de manera que sus ingresos escasamente se reflejaban en los salarios.
Ante las dificultades para resolver estos temas, nos concentraremos en estudiar la evolución comparada de salarios y precio de la tierra, para aproximarnos a la distribución funcional del ingreso de forma indirecta. Incluiremos en el análisis los precios del ganado, capital principal de la mayoría de las explotaciones agrarias de Buenos Aires, para sumar dicho insumo en la evolución de los ingresos relativos. Dado el peso que tuvieron los productores agrarios no propietarios de tierra, podemos considerar que la evolución comparada de los precios de la tierra (como proxi de sus costos de arrendamiento) y del ganado (como el de su capital e ingresos) nos puede indicar mejor cómo evoluciona la distribución de los ingresos entre estos dos sectores.
2. LA DISTRIBUCIÓN FUNCIONAL EN BUENOS AIRES: UNA APROXIMACIÓN
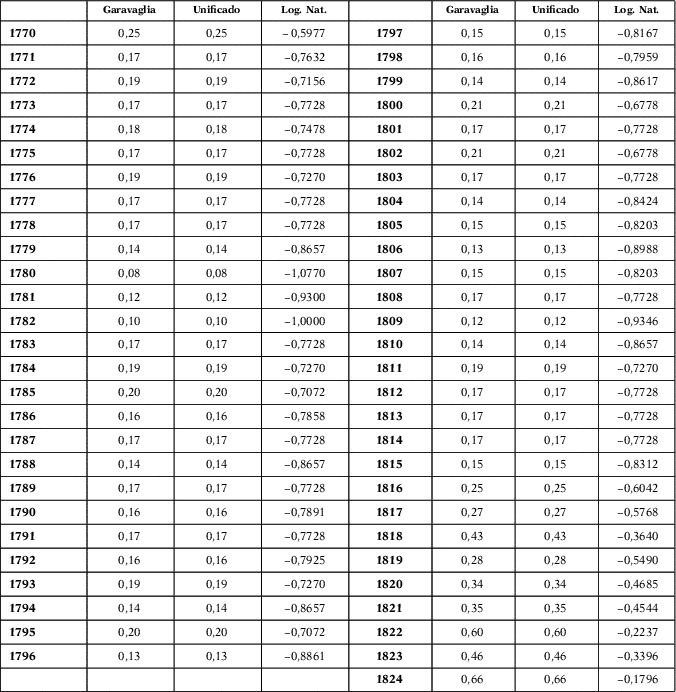
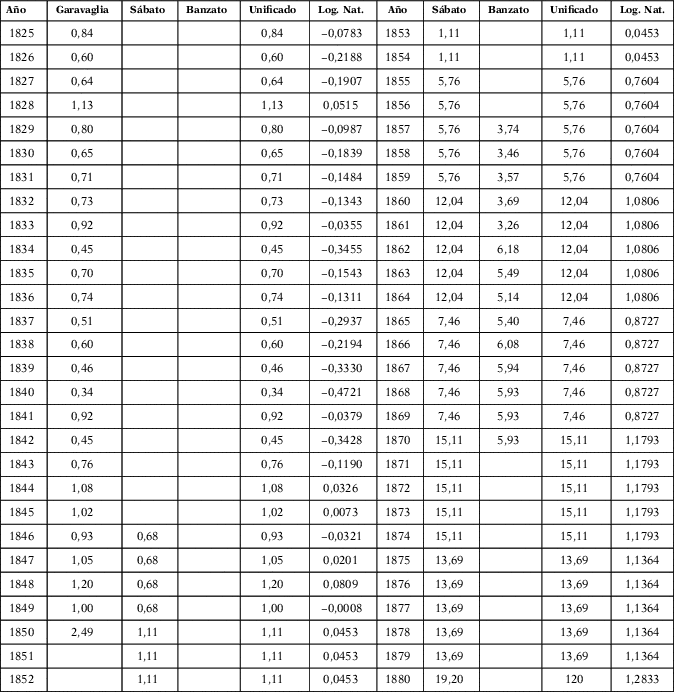
Para calcular la distribución funcional como la definimos, utilizaremos una serie de precios de tierra que construyó Garavaglia con los inventarios postmortem realizados para la partición hereditaria de bienes. Lamentablemente, esa serie llega hasta 1850 (Garavaglia, Reference Garavaglia2004), así que la completamos con los datos que proporcionan otros autores (Banzato, Barcos, y D’Agostino, 2013, p. 58) para la tierra pública entre 1857 y 1870, y Hilda Sábato (Sábato, Reference Sábato1989) para la privada del período 1850-1880. En el Apéndice (Cuadro A-1) se puede consultar la serie completa. Se puede apreciar que, para los momentos en que las series sobre tierras privadas se superponen, la coincidencia es notableFootnote 7 . Asimismo, los que corresponden a tierra pública están por debajo de los privados, pero mantienen la misma tendencia, otorgando credibilidad a los datos anteriores.
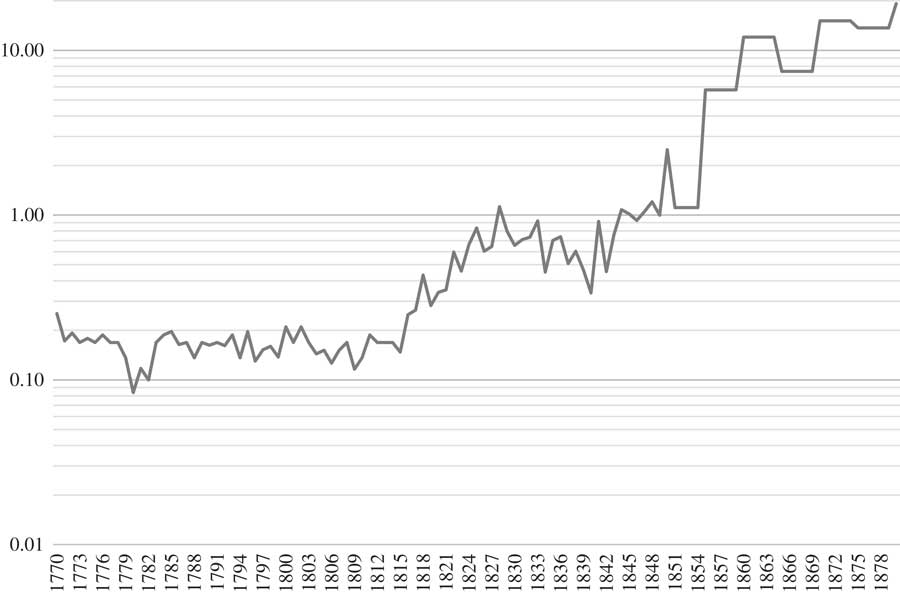
También hay homogeneidad en las zonas valuadas, así como en la calidad de las tierrasFootnote 8 . Se puede observar que los precios por hectárea crecieron desde $F 0,25 en 1770 hasta $F 19,20 en 1880, ¡casi 80 veces en moneda fuerte!Footnote 9 Por tal razón, hemos graficado ese movimiento en una escala logarítmica, que permite una mejor visualización.
PRECIO DE LA TIERRA (En hectáreas. Escala semilogarítmica)
Fuentes: Garavaglia (Reference Garavaglia2004) y Sábato (Reference Sábato1989).

Según la publicación de Garavaglia, el precio de la tierra se mantuvo más o menos estable hasta finales de la primera década revolucionaria, cuando se inicia el proceso de expansión ganadera (Halperín Donghi, Reference Halperín Donghi1963). A partir de ese momento aumenta constantemente y de manera pronunciada hasta 1828, luego disminuye hasta finales de la década de 1830, para luego volver a ascender. Esta tendencia se interrumpe durante un par de años a inicios de la década de 1850, para retomar su impulso alcista pronunciado hasta comienzos de la década de 1860, cuando el movimiento se modera y complica nuevamente hasta finales de la etapa aquí analizada.
Estas curvas permiten observar los avatares de la economía porteña. En primer lugar durante casi todo el período virreinal e incluso hasta mediados de la década revolucionaria los precios de la tierra son muy bajos y estables, lo que indica el escaso peso de la economía agraria en la sociedad porteña cuyo eje era el comercio de larga distancia de mercancías provenientes de otros lugares. Pero, desde mediados de la década de 1810, las cosas cambian y, mientras entra en crisis el carácter de la ciudad como intermediaria del comercio de efectos de Castilla, se inicia la «expansión ganadera» que lleva a una rápida valorización de la tierra. Podemos señalar una etapa inicial hasta 1825-1828 que muestra el primer empuje de la economía exportadora del cuero, con una valorización incipiente de la tierraFootnote 10 . Este movimiento se interrumpe de forma abrupta por la emisión masiva de pesos papelFootnote 11 , que desencadenó su desvalorización a partir del bloqueo brasileño al puerto de Buenos Aires desde 1826, lo que interrumpió las exportaciones por tres años; esto se repetiría entre 1838 y 1840 a causa del bloqueo francés. Se suman así dos factores que deben haber afectado a la baja los precios de la tierra: uno monetario y otro comercial. Entre ambos bloqueos hay una leve recuperación económica a mediados de la década de 1830, pero será recién en la de 1840 cuando se produce un franco crecimiento de las exportaciones ganaderasFootnote 12 que parecen reflejarse en los precios de la tierra. Asimismo, en 1836 el gobierno decide poner en venta una gran cantidad de tierra entregada en enfiteusis diez años antes, lo que seguramente frenó el incremento de su precio (Garavaglia, Reference Garavaglia2004). En la etapa siguiente podemos percibir el proceso de valorización de la tierra; el precio se multiplicó casi por 20 entre 1850 y 1880. Sin embargo, este incremento se produjo principalmente en los años que siguieron a la caída de Rosas, mientras que en la década de 1860 dicho incremento fue errático y moderado. El impulso de la economía agroexportadora de la segunda mitad del siglo es la principal razón del incremento. La «fiebre del lanar» y los inicios de una agricultura en mayor escala en algunas zonas de la campaña inciden en ello, junto con el cierre temporario de la frontera justo cuando se incrementa la demanda de tierras por las migraciones y por la intensificación de su explotación. Este freno, incluso con un leve retroceso en la frontera luego de la caída del gobernador Rosas, explica en buena parte el fuerte salto del precio de la tierra en la década de 1850 y, quizás también, la percepción de los dueños de títulos de propiedad de las tierras, del inicio de una etapa, tras la caída de Rosas, de mayor seguridad en el disfrute de dichos títulos y de la pronta eliminación de ciertos derechos de uso de la tierra que hasta aquí los limitaban (Fradkin, 1999 y Gelman, Reference Gelman2005).
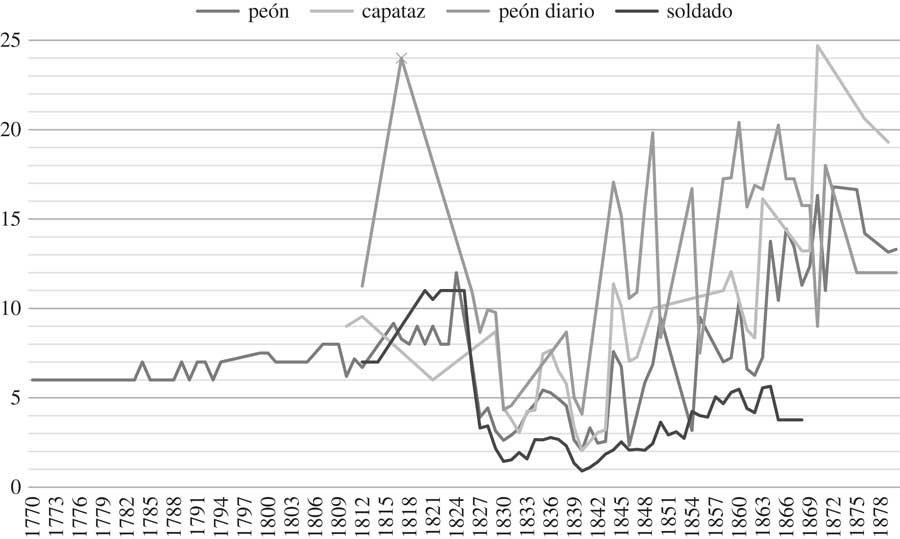
Veamos los datos de salarios. Utilizaremos, básicamente, salarios de trabajadores rurales que se han logrado reconstruir para el período 1810-1860 (Gelman y Santilli, Reference Gelman and Santilli2014a), reteniendo el del peón rural mensual que es el mismo que tomamos de Johnson para el período colonial (Johnson, Reference Johnson1990, pp. 138-139) y de Sábato hasta 1880 (Sábato, Reference Sábato1989, p. 112). Dada la alta movilidad de los trabajadores en la campaña de Buenos Aires, dichas series expresan el promedio salarial de esta categoría de trabajador en las distintas zonas rurales.
Hemos trabajado con tres categorías de sueldos rurales: peones mensuales, peones diarios y capataces. Estas dos últimas categorías funcionan básicamente como mano de obra especializada; los contratados diarios, en muchos casos, se hacen cargo de tareas especiales para las que están capacitados, como la doma, la yerra, la esquila, etc. A efectos comparativos con las otras categorías consideramos que trabajan 15 días al mes, (Gelman y Santilli, Reference Gelman and Santilli2014a). Hemos incorporado también los datos que tenemos de salarios para los soldados, datos que sirven de control sobre la evolución de los otros salarios, aunque los pague el estado. Al mismo tiempo, no dejan de presentar una información relevante en tanto se trataba de un salario bastante difundido en la economía de Buenos Aires durante una etapa en la que la militarización implicaba que una parte significativa de la población masculina se encontraba de manera casi permanente reclutada en las filas del ejército o de la milicia.
El gráfico 2 muestra esos datos.
Al carecer de un buen índice de precios para el período completoFootnote 13 , es poco lo que podemos decir aquí sobre la capacidad de compra de estos salariosFootnote 14 ; por lo tanto, las reflexiones que siguen son especulativas. Los movimientos que observamos en las curvas de salarios en pesos fuertes expresan, en parte, los cambios en los salarios reales resultado de las variaciones en los precios relativos (incluyendo los aumentos nominales de los propios salarios); pero, sobre todo, los cambios en el valor de la moneda en la que estaban expresados dichos salarios, los pesos «corrientes» (en papel) en relación con el peso «fuerte» (de plata). Esto sólo afecta a los salarios a partir de la emisión de billetes inconvertibles en 1826, ya que hasta entonces sólo había moneda denominada en plata.
En primer lugar, hay que hacer notar la tendencia al aumento a finales de la colonia, desde 1790, que se agudiza en la primera década revolucionaria, aunque con mayor inestabilidad. Esta tendencia se complica en la década de 1820 y se revierte abruptamente en la segunda mitad de esa década, en coincidencia con la desvalorización del papel monedaFootnote 15 . En ese entorno se produce la caída del sueldo de los soldados, por debajo de los rurales, lo que evidencia por dónde pasaba la dinámica de la economía. Los soldados nunca recuperarían el nivel salarial de la década revolucionaria. Se observa una tímida recuperación en la década de 1830, interrumpida bruscamente en 1838-1840. Desde 1840 se vislumbra una tendencia al aumento, con pocas interrupciones cortas, que se prolonga hasta mediados de la década de 1870, cuando parece iniciarse una retracción que debe estudiarse con datos para los años que le siguen. A grandes rasgos, este proceso coincide con el descripto anteriormente respecto a los movimientos de la economía y podría relacionarse con el peso de la demanda laboral, que a la vista de estos datos podría estar deteniéndose hacia la segunda mitad de la década de 1870 o llegando a un nuevo punto de equilibrio dada la mayor oferta relativa de trabajoFootnote 16 .
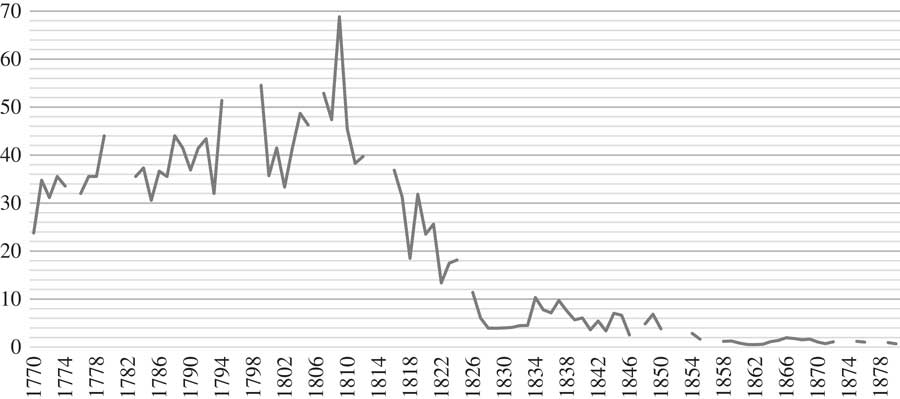
Veamos entonces en el gráfico 3 qué pasa cuando ponemos las dos variables, tierra y salarios, en juego. Tomaremos el salario del peón mensual como más representativo, para el que tenemos una serie más larga con datos consistentes y que, como se puede ver en el gráfico anterior, tiene una tendencia que, en su mayor parte, comparten los otros salarios, especialmente los privados.
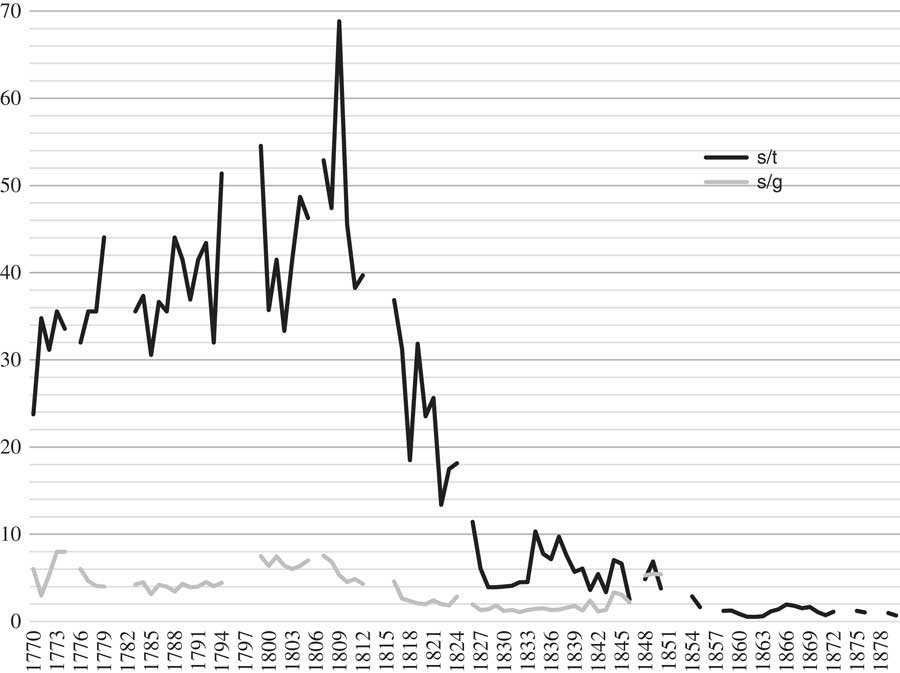
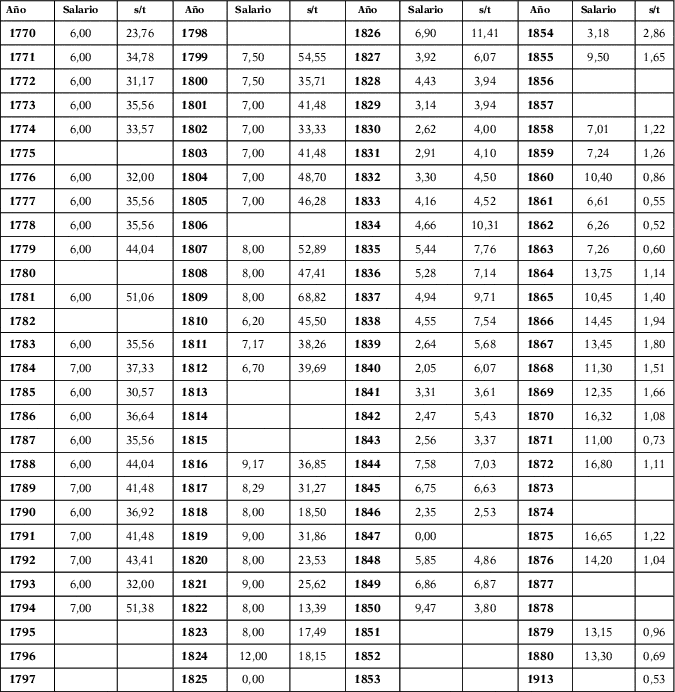
La tendencia levemente ascendente del salario que percibíamos en el gráfico 2 se acentúa al comparar con la estabilidad del precio de la tierra rural, bien abundante y relativamente poco demandado en propiedad durante la coloniaFootnote 17 . Sabemos que su explotación crece, ya que la zona cercana era la principal abastecedora de alimentos de la ciudad; sin embargo, es cierto que la propiedad no era imprescindible para dicha explotación. De ahí también, seguramente, la demanda de mano de obra que empuja hacia arriba los salarios. La relación, según se puede ver en el Apéndice (Cuadro A-2), alcanza su punto máximo en 1809, cuando el sueldo significaba más de 68 veces el valor de una hectárea de tierra, una situación, desde todo punto de vista, excepcional. Es necesario insistir en que esta enorme baratura de la tierra rural frente al salario en el período colonial no implicaba necesariamente que todo trabajador estuviera en condiciones de acceder a ella o que quisiera hacerlo. Por un lado, había una serie de costos fijos adicionales para acceder al trámite de compra que la encarecían mucho para propiedades de tamaño modesto. Pero además, y sobre todo, lo que ponen de manifiesto esos valores es el escaso interés en comprar, cuando el acceso a la tierra era muy fluido por otras vías como el simple poblamiento a título gratuito o casi. Y, por eso mismo, era más difícil el acceso a la mano de obra —y más caro el salario— cuando casi todos podían establecerse por cuenta propia. Hay diversos testimonios que hablan de la carestía de los salariosFootnote 18 , la capacidad de los peones de juntar rápidamente un capital e independizarse, aunque sea de forma modesta en comparación con las elites locales. La tierra no era muy codiciada todavía y abundaban las oportunidades de establecerse, por lo que puede considerarse innecesario inmovilizar capital para convertirse en propietario.
SALARIOS RURALES NOMINALES (En pesos fuertes)
Fuentes: Gelman y Santilli (Reference Gelman and Santilli2014a).

A partir de ese momento, la situación cambia radicalmente y la relación comienza a precipitarse rápida y profundamente hasta 1828. Estos años coinciden con los inicios de la expansión ganadera y, en la segunda mitad de la década de 1820, con la desvalorización de la moneda, que alcanza sus máximos durante los tres bloqueos del puerto de Buenos Aires, en 1825-1828, 1838-1840 y 1845-1848. Luego de una cierta recuperación de los salarios a mediados de la década de 1830, se continúa la tendencia secular que, con pocas y cortas interrupciones, muestra una pérdida constante de los salarios en relación con los valores de la tierra rural. Claro que poco nos indican estos valores sobre las condiciones de vida de los trabajadores, que deben ser medidos con otras variables.
3. LA DIFERENCIACIÓN POR PERÍODOS
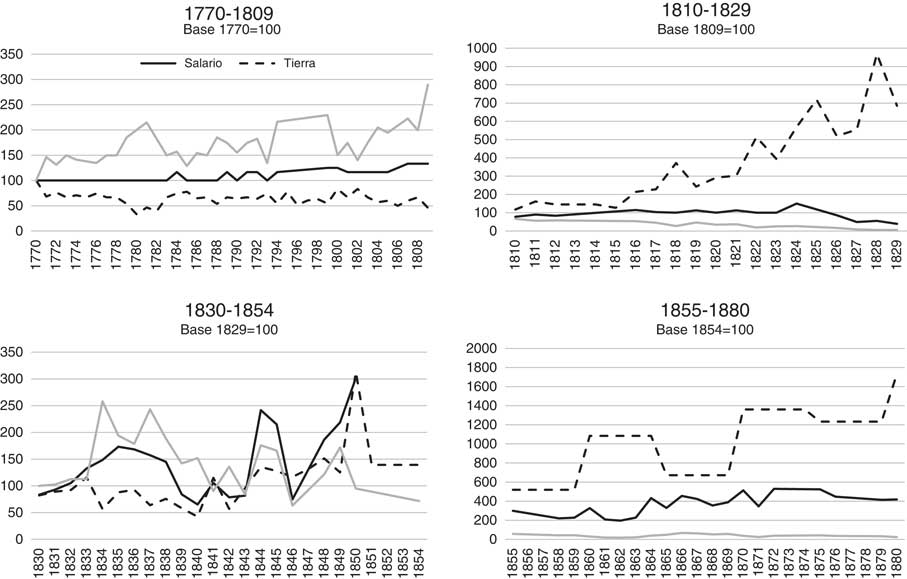
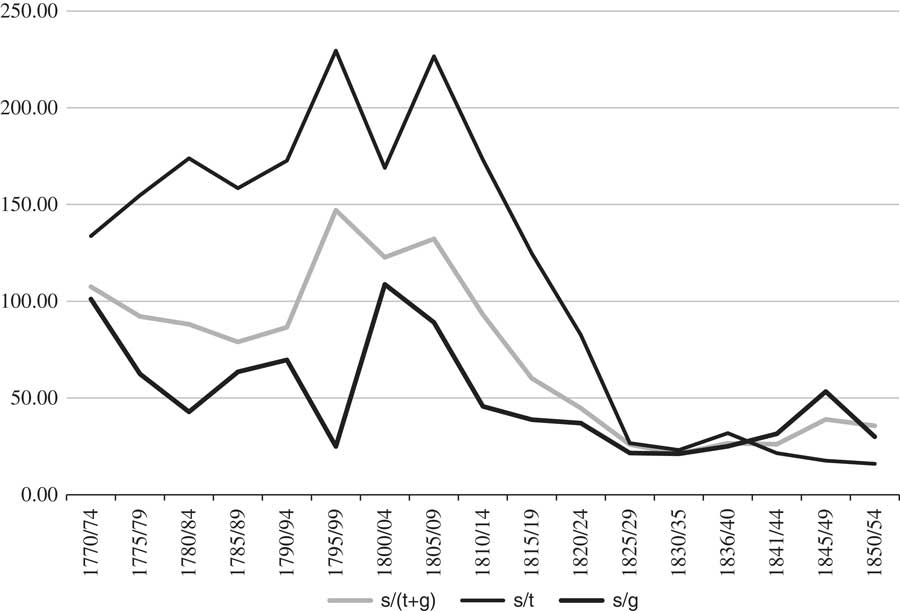
Vamos a periodizar la información que presentamos antes de la evolución de los salarios frente al precio de la tierra rural para que puedan observarse mejor los movimientos parciales y los contrastes en los diversos lapsos (gráfico 4).
Los períodos elegidos están relacionados tanto con modificaciones que se producen en las propias curvas como con el contexto histórico, económico, político y social.
El lapso 1770-1809 está caracterizado, como ya dijimos, por una estabilidad muy grande del precio de la tierra, con una tendencia descendente. El mercado de mano de obra es el que da mayormente la pauta en un momento en el que las exigencias del consumo de Buenos Aires crecen de forma continua. Por su parte, el otro factor necesario para satisfacer ese consumo, la tierra, se mantiene estable dada su relativa abundancia y las facilidades para su acceso. Esto se combina, hacia el final de este período, con una tendencia ascendente de los salarios más clara, lo cual está relacionado con el inicio de la militarización, que compite con la mano de obra necesaria para las actividades rurales. Con estos datos, entonces, se deduce que la etapa virreinal conoce una mejora de la distribución funcional del ingreso a favor de los asalariados. Esto resulta notable al menos para el sector rural, cuyos precios estamos comparando. Sabemos que en el sector urbano las cosas cambian bastante, aunque esto no altera necesariamente la situación en el sector rural. También es preciso resaltar que estas cifras se refieren a la etapa —de las cuatro que estamos considerando— en la que es posible que el trabajo asalariado tuviera un menor peso relativo.
El período 1810-1829 corresponde a la primera etapa de la expansión ganadera. Se mantiene la tendencia del precio de la mano de obra por lo menos hasta 1824, pero le acompaña un incremento aún mayor en el precio de la tierra, que desde 1815 no parece tener freno y provoca una caída fuerte y casi continua de la relación. Es decir, que en esta etapa la distribución funcional favorece con fuerza a los propietarios de la tierra, más allá de la evolución del poder de compra de los salarios. Se puede deducir que el proceso de puesta en explotación ganadera de la tierra ha producido un incremento de su precio. A esto le acompaña una toma de conciencia del estado de Buenos Aires y de sus elites de que el negocio tradicional, vinculado a la plata de Potosí y al tráfico de esclavos y «efectos de Castilla», ha llegado a su fin: el nuevo negocio se centra en la explotación de la tierra del hinterland porteño. Esto mantuvo y, tal vez, aumentó la demanda de mano de obra, ya que no disminuyó su precio, pero sí se deterioró la relación. A partir de la desvalorización del papel moneda producida por la emisión derivada del bloqueo del puerto por parte de la armada brasileña, el sueldo del peón se deteriora en moneda constante, lo que no pasa con el precio de la tierra, que se mantiene e incluso aumenta levemente, tal vez como reaseguro de inversión ante el proceso inflacionario. En resumen, los propietarios de tierras ven cómo el valor de sus propiedades aumenta de manera considerable y, seguramente, también, la renta que producen; mientras que los salarios que pagan apenas suben o incluso caen al comienzo del proceso inflacionario en 1825-1826. Como se ve en el Gráfico 3, este período es el de mayor caída de la relación, que pasa de 38,8 ha/salario mensual en 1809 a 23 en 1820, para terminar el período en 3,94. Esto significa una caída a razón del 13,33% anual; que resulta más del incremento relativo del precio de la tierra que de la caída de los salarios. En la segunda mitad de la década de 1820 la tasa negativa alcanzó el 26,32% anual debido a estos movimientos divergentes del precio de la tierra y los salarios. Es decir, que en esos pocos años de «hiperinflación» y «megadevaluación» el salario del peón rural pierde un 26% anual en relación con el precio de la tierra rural. No conocemos otro momento histórico en el que se produjera semejante caída del salario sin una fuerte conmoción social. Es posible que el tipo de estructura social de la época en Buenos Aires, que aseguraba a una parte importante de la población el acceso directo a los medios de producción, mitigara en parte esta catastrófica relación de precios de la tierra/salarios. Y, sin embargo, sabemos que, al menos desde mediados de la década 1820, se incrementa la conflictividad social rural, que culminará, espoleada por muchos factores, en una rebelión abierta con repercusiones múltiples a comienzos de 1829 (Fradkin, Reference Fradkin2001 y Reference Fradkin2006; González Bernaldo, Reference González Bernaldo1987).
RELACIÓN SALARIO NOMINAL / PRECIO DE LA TIERRA (Salario peón mensual/precio por hectárea en pesos fuertes)
Fuentes: íd. gráficos 1 y 2

El tercer período (1830-1854) se corresponde, aproximadamente, con el gobierno de Juan Manuel de Rosas. Aquí, percibimos una leve recuperación de la remuneración de la mano de obra, aunque con altibajos. Hasta mediados de la primera década, la relación mejora, sobre todo, por la recuperación del salario y la estabilidad del precio de la tierra. La segunda mitad de la década muestra cierta tendencia a la baja del bien, que Garavaglia (Reference Garavaglia2004) atribuye a la puesta en venta de tierras propiedad del Estado. Sin embargo, el precio de la mano de obra también disminuye, en este caso más que la tierra, arrastrado por la devaluación que provoca el nuevo bloqueo al puerto. Durante la década de 1840, la tendencia del precio de la tierra es a la suba, pero hay oscilaciones en la mano de obra que hacen variar la relación abruptamente, unas veces en beneficio y otras en perjuicio de los asalariados. De esta manera, el largo período de caída fuerte de los salarios en relación con la tierra que se inicia luego de la revolución parece detenerse, sobre todo en comparación con los veinte años previos. Sin embargo, el período se cierra con una oscilación hacia abajo.
Por último, el período comprendido entre 1855 y 1880, caracterizado por la «fiebre del lanar», muestra un crecimiento económico intensivo, dadas las limitaciones temporales a la expansión territorial y el acelerado crecimiento demográfico. Como vimos, en referencia al precio de la tierra, este período se caracteriza por un alza, aunque con altibajos. Si bien el salario acompaña dicho movimiento, se puede apreciar que la relación favorece a los propietarios de la tierra. La línea que muestra la relación se vuelve más estable y por debajo de las dos variables consideradas. De todos modos, queda claro que la caída relativa de los salarios en esta etapa continúa una tendencia casi secular, que tuvo su momento culminante entre 1810 y 1828, aproximadamente. La tremenda pérdida sufrida por el salario en el momento inaugural de la expansión ganadera, sigue profundizándose bajo el rosismo, aunque a un ritmo menor; y se acelera en este período (1855-1880), en el que la tasa de decrecimiento de la relación es del 5,32% anual acumulada. Estaríamos en presencia de un proceso largo de cambio en la distribución de los ingresos a favor de los sectores propietarios, con algunos momentos en los que se frena o modera y otros en los que los cambios se tornan bastante dramáticos, como en la década de 1820. Insistimos en que esto no significa que los salarios reales de los trabajadores se hayan deteriorado ni que hayan empeorado sus condiciones de vida. Pero nuestros datos parecen indicar que las ganancias del crecimiento económico de esta etapa se repartieron de manera crecientemente desigual. Si los precios que hemos analizado hasta aquí pueden considerarse indicadores indirectos de la distribución funcional del ingreso, la pérdida relativa de los asalariados fue impactante desde 1815 en adelante, con pocas interrupciones.
SALARIO, PRECIO DE LA TIERRA Y RELACIÓN (S/T) PERIODIZADA (En números índice, 100=al valor inicial de cada etapa).
Fuente: Véase Apéndice.

4. LA INCIDENCIA DE LA GANADERÍA EN LA RELACIÓN SALARIOS-PRECIOS
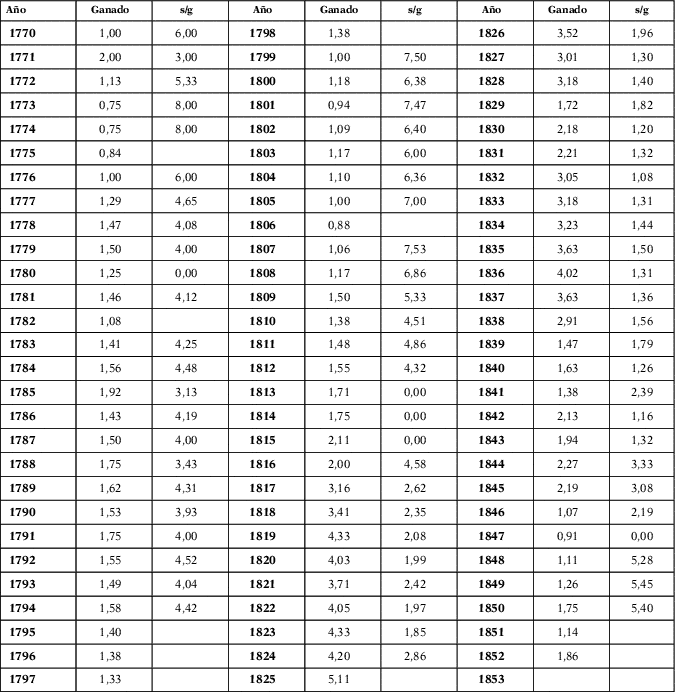
Como señalamos anteriormente, debemos considerar al ganado como el capital principal de las explotaciones agrarias de Buenos Aires de la época. Para ello, tenemos el precio de las vacas tomado de la misma fuente: los inventarios postmortem publicados por Juan Carlos Garavaglia (Reference Garavaglia2004). Lamentablemente, esa serie sólo llega hasta 1850 y aun no se ha construido su continuación, como sí habíamos encontrado para el precio de la tierra. Empecemos por comparar directamente el salario con el precio del ganado, la misma operación que hemos hecho con la tierra. Como se puede observar en el Gráfico 5, la evolución de la relación entre los salarios con el precio del ganado vacuno sigue una tendencia larga similar a la que tienen con la tierra, pero de manera mucho más moderada, con algunos vaivenes y con una cronología algo cambiada. De unos niveles elevados de esa relación en el período colonial, se observa luego una tendencia a valores más bajos, es decir a una pérdida relativa de los salarios, que empieza antes porque el alza de los precios del ganado es algo anterior a los de la tierra, como ya había señalado en su estudio Garavaglia (Reference Garavaglia2004). Pero a la vez, la caída de la relación salarios/ganado en el período postcolonial nunca llegará a ser tan rotunda ni continua como la que tiene con relación a los precios de la tierra. Así, de niveles coloniales que nunca sobrepasan un valor de 7 u 8, dicha relación cae en la primera mitad del siglo XIX, llegando a su punto más bajo en 1842: 1,16; sin embargo, luego repunta y alcanza 5,4 en 1850. De todos modos, como queda claro en el gráfico, esa relación es, en general, bastante más baja en la primera mitad del siglo XIX que durante la colonia; es decir que, siguiendo este indicador, la desigualdad se agravó por la pérdida relativa de los salarios (véase en el Apéndice el Cuadro A-3).
RELACIÓN SALARIO NOMINAL/PRECIO DE FACTORES (Salario peón mensual/precio por hectárea y salario peón mensual/precio de la vaca, en pesos fuertes)
Fuentes: íd. gráficos 1 y 2.

Con ambos datos podemos ahora construir un índice combinado teniendo en cuenta el peso de cada factor en la composición del capital promedio de las explotaciones en Buenos Aires.
Garavaglia (Reference Garavaglia1999) analiza el capital de las estancias de toda la región entre 1751 y 1853 dividiendo la información en dos períodos, 1751-1815 y 1816-1852, y mostrando algunos cambios en la composición de dichos inventarios. En el primero, el ganado representaba el 55% del capital total, mientras que la tierra era sólo el 14%, seguida por las construcciones, que representaban el 13%; el resto correspondía a los esclavos, mayoritariamente. En la segunda etapa, el ganado había aumentado su incidencia al 63%, pero también lo había hecho la tierra, que llegó al 21%, mientras que las construcciones habían descendido al 10%; así como la inversión en esclavos, que ahora era de un escaso 3%, mostrando el proceso de disolución de este tipo de relación social (Garavaglia, Reference Garavaglia1999a, p. 711)Footnote 19 .
Con estos datos, y teniendo en cuenta que las construcciones eran mejoras a la tierra y que en el precio de la hectárea que hemos utilizado hasta ahora presumimos incluidas tales mejoras, hemos considerado que para ambas etapas el ganado representaba el 67% de la inversión, mientras que el 33% correspondía a la tierra. Asimismo, en nuestro trabajo sobre la distribución de la riqueza en Buenos Aires (Gelman y Santilli, Reference Gelman and Santilli2006) se llegó a porcentajes muy similares para el año 1839: 64% y 36%, respectivamente, para ganado y tierra. De modo que podemos extender la aplicación de la proporción de Garavaglia, 67% y 33%, respectivamente, a la primera parte de nuestra serie. Consideraremos la inversión de capital en esas proporciones entre 1770 y 1850. Veamos el gráfico 6 (en este caso, para que las muestras sean comparables, hemos utilizado un índice 1770=100).
COMPARACIÓN ÍNDICE COMBINADO TIERRA+GANADO, SÓLO GANADO Y SÓLO TIERRA. 1770=100 (promedios quinquenales)
Fuentes: calculado a partir de Garavaglia (Reference Garavaglia1999a y 2004); y Gelman y Santilli, (Reference Gelman and Santilli2014a)20.

Como se puede apreciar, la combinación de los precios de la tierra y del ganado en las proporciones indicadas más arriba muestra una relación con los salarios que no es tan distinta a la obtenida sólo con los precios de la tierra, aunque sí es más moderada. En un principio los salarios caen hasta la última década del siglo XVIII, coincidiendo con el aumento del precio del ganado, que arrastra los ingresos de nuestro capitalista hacia arriba. Pero, a partir del quinquenio final de la centuria y hasta 1815-1819, la relación superó el nivel de 1770; es decir, mejoró para los asalariados. A partir de ese lustro, cae continuamente el salario arrastrado tanto por el aumento del precio de la tierra como por el más moderado del ganado. En el último decenio, la relación entre el salario y el ganado pasa a ser menos perjudicial para los trabajadores, lo que permite una leve recuperación del salario en relación con el índice combinado, pero siempre en niveles más bajos que a finales de la colonia.
Observado este período en su conjunto, la incorporación del precio del ganado en nuestro cálculo no altera radicalmente el movimiento de la distribución, pero sí lo atempera. Así como se modera o anula el incremento relativo de los salarios en la etapa colonial, también se hace menos fuerte la caída posterior, aunque la tendencia es similar. También es notable que, durante el período rosista, la bajada de los precios del ganado suaviza el deterioro relativo de los salarios, lo que incluso permite una leve mejora de estos últimos hacia el final.
5. A MODO DE CONCLUSIÓN: LOS CICLOS DE LA DESIGUALDAD EN BUENOS AIRES
Si bien lo que presentamos aquí es apenas un primer intento de acercarnos a la distribución funcional del ingreso en el largo plazo desde finales de la colonia hasta finales del siglo XIX, aparecen algunas conclusiones importantes que merece la pena retener y que futuras investigaciones deberán completar y, quizás, matizar.
La más importante de todas se refiere a la relación cambiante entre los precios de la tierra y los salarios, que tomamos como indicativa, con una serie de consideraciones, de la distribución de los ingresos entre los trabajadores y los propietarios.
En este caso pudimos observar un período, el que arranca con la creación del virreinato, pero que seguramente viene de muy atrás en el tiempo, en el que los salarios eran muy elevados en relación con el costo muy bajo de la tierra. Y dicha relación parece incluso mejorar hacia los primeros años del siglo XIX, empujada por la estabilidad del precio de la tierra mientras los salarios avanzan al calor de la militarización. Sin duda, se trata de una etapa que se puede considerar como bastante típica de condiciones de frontera y, a la vez, de escasa demanda de tierra para la compra, en la que el valor de la misma es muy bajo y el trabajo, por las mismas circunstancias, muy caro en términos relativos. Se trataba de una economía centrada en la intermediación de bienes producidos en otros espacios, con formas de acceso a la tierra que no requerían, en buena parte, pasar por el mercado para ello. Pero esta situación se revertiría en la segunda década del nuevo siglo, que comenzaba con la revolución de mayo, la apertura comercial y el desarrollo de la «expansión ganadera».
Así, a partir de la revolución, las cosas cambiarían mucho, especialmente marcadas por los inicios de la expansión ganadera hacia 1815-1820. Si bien se incorporan nuevas tierras a la explotación ganadera desde esta etapa, la demanda que genera la transformación de la economía porteña lleva la delantera mediante la generación de un proceso de incremento vertiginoso de los precios de este factor, en general bastante por encima del de los otros, ya sea del ganado —que hemos tomado como expresión del capital— o del salario. En este sentido, pudimos observar en especial el golpe a los salarios que significó el comienzo de las emisiones monetarias masivas que acompañaron al primer bloqueo del puerto de Buenos Aires entre 1825 y 1828, y ocurre al menos en otras dos ocasiones: entre 1838 y 1840, y entre 1845 y 1848. En estos períodos, particularmente en el primero, mientras los salarios en moneda constante caen y también lo hace el precio del ganado, la tierra continúa su ciclo ascendente, separándose fuertemente de los primeros.
Al incluir el factor ganado en el panorama de la distribución del ingreso, observamos que se modera algo la imagen de ganancia de los salarios en la etapa virreinal (porque los precios del ganado suben antes que los de la tierra y por momentos superan al movimiento de los salarios) y también es algo menos drástica la caída relativa del salario en la mayor parte del siglo XIX, porque el precio del ganado frena su ascenso. Sin embargo, las tendencias generales se mantienen: en esa primera etapa, la escasez de trabajo permite mantener la porción elevada que los trabajadores obtenían del proceso económico, y esa parte caerá en el siglo XIX, unas veces con fuerza y otras moderadamente, con algunas etapas intermedias en las que logra sostener el nivel, aunque ya más reducido, entre las décadas de 1830 y 1850, aproximadamente.
De esta manera, se podría sostener que el caso de Buenos Aires en esta etapa se corresponde en gran medida con lo que preveía el modelo Heckscher-Ohlin sobre la apreciación relativa del factor abundante en una etapa de globalización o integración de mercados, aunque es necesario incorporar algunos matices importantes.
La apertura del comercio atlántico en los años que siguen a la revolución, en un contexto de cambio de la economía mundial y de alteración de los términos de intercambio por la revolución industrial, promueve la expansión ganadera en Buenos Aires, la incorporación de nuevas tierras, pero a la vez su encarecimiento relativo y un crecimiento muy rápido de la población con aportes migratorios (primero de origen interregional y luego internacional), que van a favorecer un proceso de creciente desigualdad en la región. Pero, como hemos observado, ese proceso general tiene momentos diversos, aunque la tendencia general parece clara. Dichos matices y etapas deben estudiarse con cuidado y, seguramente, permitirán que las explicaciones sobre las causas de los movimientos en la desigualdad se vuelvan más complejas. Para empezar, la oferta de los factores es cambiante. No sólo las condiciones iniciales de la región estimulan un fuerte crecimiento demográfico, tanto natural como por migraciones, sino que la oferta de tierras también es cambiante. Así, si el territorio de Buenos Aires se multiplica varias veces a lo largo del período en estudio, dicho proceso no es constante sino por etapas y conoce también algunos retrocesos, como sucede tras la caída de Rosas. Y esto se relaciona con un crecimiento demográfico bastante espectacular y más regular que el de la tierra, que multiplica la población de Buenos Aires casi 8 veces entre 1822 y 1880 (Mateo, Reference Mateo2013). Al mismo tiempo, la oferta potencial de trabajo no se vincula sólo con el tamaño de la población, sino también con su composición. Por ejemplo, la creciente inmigración en la segunda mitad del siglo XIX profundiza la tasa de masculinidad en la población joven adulta, incrementando así la oferta potencial de trabajo masculino asalariadoFootnote 21 . De esta manera, las variaciones espasmódicas de la relación entre estos factores deben tenerse en cuenta con mayor precisión. Pero también deben considerarse factores institucionales y políticos que afectan, por ejemplo, a la forma en que los distintos sectores acceden a estos factores. Así, la nueva tierra ganada por el estado de Buenos Aires en la frontera se pondría a disposición de la población de distintas maneras, ya fuera a través de la enfiteusis en la década de 1820 o de la venta, con distintas condiciones de acceso; también se deben considerar los cambios tecnológicos que afectan a la utilización de los factores y sus retribuciones, etc.Footnote 22
De cualquier manera, debemos insistir en que las conclusiones que presentamos en este trabajo no se refieren a las condiciones de vida de la población de Buenos Aires, sino sólo a la forma en que se distribuía la riqueza generada a lo largo de esta etapa.
Aunque todavía faltan más estudios al respecto, sabemos que los salarios de los trabajadores porteños durante casi todo el siglo XIX estaban lejos de ser bajos comparados con los de otras regiones americanas, así como con la mayoría de los europeos, y ello se convertía en un fuerte estímulo a la inmigración, más allá de que la desigualdad se incrementara en la misma etapa (Arroyo Abad, Reference Arroyo Abad2008; Cortés Conde, Reference Cortés Conde1979; Dobado y García Montero, Reference Dobado and García Montero2010). Asimismo, sabemos que se trataba de una sociedad que habilitaba importantes posibilidades de movilidad social, incluido el acceso a la tierra.
Sin embargo, lo que nuestro estudio revela es que al interior de la sociedad bonaerense, y al menos desde el período 1815-1820, los dueños de la tierra y, en menor medida, del ganado se quedaban con una porción de la riqueza que, con pocas interrupciones, no hacía más que crecer, mientras que la de los asalariados caía.
Aquí se hace necesario introducir algunas consideraciones sobre el peso de los distintos sectores en la sociedad porteña a lo largo de esta etapa. Tanto el peso de los asalariados, como de los productores que no eran dueños del factor tierra, va cambiando a lo largo de la etapa considerada, aunque no disponemos de datos demasiado confiables. Como señalamos antes, diversos padrones y censos de población confirman lo que parece una evolución lógica en el sentido de un crecimiento del sector de los asalariados, tanto en términos absolutos como relativos. Paralelamente, crece en número el sector de quienes acceden a la propiedad de la tierra, aunque estos devienen una porción cada vez menor del total. Más difícil es conocer el peso de quienes, sin poseer la tierra, se ganan la vida como productores autónomos, ya sea como ocupantes sin títulos de tierra estatal o privada o, cada vez más, bajo sistemas de arrendamiento o aparcería. Pero sabemos que este sector está muy lejos de desaparecer en la economía porteña y durante todo el siglo XIX jugará un papel importante en la puesta en valor del territorioFootnote 23 . Por otra parte, un sector de los asalariados combinaba sus ingresos como mano de obra dependiente con actividades autónomas o, lo que es lo mismo, una parte de los productores por cuenta propia sumaban ingresos salariales, aunque obviamente carecemos de estadísticas sobre ello.
¿Qué podríamos decir entonces sobre la desigualdad considerando estos sectores diversos y utilizando la información que analizamos en este trabajo?
En principio, se puede decir que la situación relativa de los asalariados en la etapa inicial que consideramos parece ser la mejor. Ésta afectaba a una porción reducida de la población, ya que un porcentaje muy alto del total, especialmente en el sector rural, lograba desempeñar actividades por cuenta propia, al menos de forma parcial. Así, aunque la situación individual de cada trabajador dependiente se vería en lo sucesivo afectada en su relación con los ingresos de los propietarios, ese sector asalariado sería cada vez mayor, por lo que la porción de ingresos del sector en su conjunto podría haber crecido.
En el otro extremo tendríamos a los propietarios de tierra rural, aunque podemos incluir en el razonamiento a la propiedad urbana para el período inicial para el que tenemos datos. El sector más pudiente en el período colonial, con asiento en la ciudad y con inmuebles en la misma, parece gozar de buena salud económica; pero el sector cuyos activos radicaban sólo o principalmente en el campo, no tiene ganancias relativas en esta etapa, más bien lo contrario. Sin embargo, en lo sucesivo, desde los inicios de la expansión ganadera, estos últimos serían los que más ganarían en la distribución, siendo, en este sentido, la contracara de los asalariados.
Pero, como ya dijimos, debemos considerar, por su peso en el capital total, el papel jugado por el ganado. Y este ganado no sólo lo poseían los dueños de la tierra, sino también muchos productores sin tierra, entre los cuales, además, una parte tenía ingresos salariales.
Ya vimos que la situación relativa del primer sector, el de propietarios de tierra y ganado, se parece a la de los dueños de sólo tierra, pero con una tendencia algo más moderada, tanto porque en el período virreinal los precios del ganado subieron mientras que la tierra no lo hizo y porque luego el ganado subió menos o incluso cayó, mientras que la tierra seguiría su marcha ascendente, moderando así las ganancias relativas del propietario de ambos recursos.
Por su parte la situación del productor no propietario de tierras debió ser bastante más complicada: si al inicio su situación es más bien favorable en el reparto de los ingresos (por la marcha ascendente de sus ingresos expresados en el alza temprana de los precios del ganado), luego su ecuación se complica al subir bastante más el precio de la tierra que el del ganado. Es decir, que si este productor tiene que pagar arrendamiento, la parte que le quede del proceso económico irá mermando a favor del propietario de la tierra durante la mayor parte del período 1815-1880 que hemos considerado. Si a la vez debe pagar algunos salarios, aunque sea temporalmente, o si, al revés, gana algunos salarios temporales, su situación se verá agravada o mejorada según los diversos ciclos analizados en el trabajo.
Finalmente, si el asalariado consigue una parte de sus ingresos en tanto productor de algo de ganado por su cuenta (o de otros bienes como trigo, etc.) su situación también se modifica parcialmente. De hecho, existen coyunturas en las que los salarios reales cayeron mucho mientras que los precios de los bienes agrarios no lo hicieron y, ante las cuales, es posible que muchos trabajadores hayan reforzado la búsqueda de producción por cuenta propia, para poder afrontar esas pésimas condiciones salariales (Gelman y Santilli, Reference Gelman and Santilli2014a).
Sea como sea, todas estas observaciones necesitan seguir siendo investigadas, tratando de sumar datos que permitan medir estos fenómenos con mayor precisión, así como probando nuevos instrumentos analíticos.
Pero creemos haber logrado mostrar algunos movimientos en el comportamiento de los precios relativos que, a su vez parecen indicar otros en la evolución de la desigualdad, con tendencias bastante claras en este largo plazo que transcurre entre los finales del período colonial y los albores de la máxima expansión económica que conoció la Argentina.
APÉNDICE
PRECIOS DE LA TIERRA POR HECTÁREA EN PESOS FUERTES

PRECIOS DE LA TIERRA POR HECTÁREA EN PESOS FUERTES

RELACIÓN SALARIO/PRECIO DE LA TIERRA (S/T)

RELACIÓN SALARIO/PRECIO DEL GANADO