



1 Introduction
Vortical structures in wall-bounded turbulence and their associated fluid motions have received considerable attention, because they provide means to understand the exchange of mass and momentum near walls (Robinson Reference Robinson1991; Adrian Reference Adrian2007). Some well-known examples of such structures are the quasi-streamwise vortices in the near-wall region (Jeong et al. Reference Jeong, Hussain, Schoppa and Kim1997) and the hairpin vortex (Theodorsen Reference Theodorsen1952). The latter is taken here to include symmetric arch-type vortices and asymmetric cane-type vortices following Adrian, Meinhart & Tomkins (Reference Adrian, Meinhart and Tomkins2000). The hairpin vortex in particular appears to be statistically relevant when it comes to momentum exchange, as it shows up in the conditional average flow around an ejection of low-momentum fluid away from the wall (Zhou et al. Reference Zhou, Adrian, Balachandar and Kendall1999; Adrian Reference Adrian2007; Schröder et al. Reference Schröder, Geisler, Staack, Elsinga, Scarano, Wieneke, Henning, Poelma and Westerweel2011). Furthermore, it has been proposed that hairpins are organized into so-called packets (Adrian et al. Reference Adrian, Meinhart and Tomkins2000). A packet consists of a number of streamwise-aligned hairpin vortices around a single low-momentum region. The spatial organization of hairpins is important, because it enhances the Reynolds stresses by the cooperative transfer of momentum between the hairpins (Adrian et al. Reference Adrian, Meinhart and Tomkins2000), i.e. together the hairpins induce a large-scale and more intense low-speed zone. Indeed, packets were shown to contribute significantly to the Reynolds shear stress (Ganapathisubramani, Longmire & Marusic Reference Ganapathisubramani, Longmire and Marusic2003). The Reynolds shear stress in this case is a measure to quantify momentum exchange in wall turbulence.
Experimental evidence of hairpins and packets was provided initially by their signatures in planar velocity fields obtained by particle image velocimetry (PIV) (Adrian et al.
Reference Adrian, Meinhart and Tomkins2000; Christensen & Adrian Reference Christensen and Adrian2001; Ganapathisubramani et al.
Reference Ganapathisubramani, Longmire and Marusic2003) and more recently by fully three-dimensional (3D) velocity fields from tomographic PIV over a wide range of Reynolds numbers (Elsinga et al.
Reference Elsinga, Kuik, Van Oudheusden and Scarano2007, Reference Elsinga, Adrian, Van Oudheusden and Scarano2010; Gao, Ortiz-Dueñas & Longmire Reference Gao, Ortiz-Dueñas and Longmire2013). While the 3D measurements have been criticized for not resolving the smallest spatial scales in the flow, i.e. the Kolmogorov length scale, the spatial resolution was sufficient to accurately measure the velocity fluctuations, the Reynolds stresses and the turbulent kinetic energy in the outer layer of the turbulent boundary layer (beyond
 $y^{+}=90$
). Hence, it is fair to say that the hairpins and packets, as visualized in those experiments, describe the energy-containing motions in such flows. It would explain why the hairpin-like models by Perry & Marusic (Reference Perry and Marusic1995) and Marusic (Reference Marusic2001) provide quite accurate predictions of the velocity statistics in boundary layers. After all, the velocity statistics are determined mostly by the larger and energetic scales of turbulent motion.
Direct numerical simulations (DNS) offer better spatial resolution, but studies using DNS seem to have reached opposing conclusions on the occurrence of hairpins: identifying hairpin vortices either as relevant, possibly even dominant, features of boundary layer turbulence (Wu & Moin Reference Wu and Moin2009; Wu Reference Wu2010), or as virtually non-existent (Jeong et al. Reference Jeong, Hussain, Schoppa and Kim1997; Jimenez et al. Reference Jimenez, Hoyas, Simens and Mizuno2010; Schlatter et al. Reference Schlatter, Li, Örlü, Hussain and Henningson2014). Those differences have been attributed to transition effects, which do not persist in fully developed turbulent boundary layers (Jimenez et al. Reference Jimenez, Hoyas, Simens and Mizuno2010; Schlatter et al. Reference Schlatter, Li, Örlü, Hussain and Henningson2014). To understand whether or not hairpins are indeed remnants of transition, further study of the flow dynamics is required. Specifically, we need to address the following question: Can new hairpins be generated within the fully turbulent boundary layer flow?
At this point it is uncertain if they can. Models for the (auto-)generation of hairpin vortices in wall-bounded flow have been proposed based on the evolution of initial perturbations to an otherwise laminar flow (Smith et al. Reference Smith, Walker, Haidari and Sobrun1991; Zhou et al. Reference Zhou, Adrian, Balachandar and Kendall1999), even if the laminar flow had a turbulent mean velocity profile (Zhou et al. Reference Zhou, Adrian, Balachandar and Kendall1999). In both models the initial perturbation was a hairpin, or a hairpin-like, vortex. With time, the initial hairpin generated new hairpins upstream. The hairpin generation mechanisms were supported from experiment by flow visualization (Smith et al. Reference Smith, Walker, Haidari and Sobrun1991) and from DNS (Zhou et al. Reference Zhou, Adrian, Balachandar and Kendall1999), and gained further credibility by observations of hairpin packets in the boundary layer transition region (e.g. Wu Reference Wu2010; Elsinga & Westerweel Reference Elsinga and Westerweel2012). Kim, Sung & Adrian (Reference Kim, Sung and Adrian2008) later confirmed that hairpins can auto-generate new hairpins within a fully turbulent environment, but still they had to forcefully introduce a very strong initial hairpin vortex structure into their turbulent channel flow. It thus remains unclear if this process is naturally occurring within fully developed and unperturbed turbulent boundary layers. Direct observations are lacking presently.
A closely related issue is the existence of hairpins in the near-wall region below a wall-normal distance of
 $y^{+}=60$
. Some DNS studies do not show any evidence of hairpins (Jeong et al.
Reference Jeong, Hussain, Schoppa and Kim1997; Schlatter et al.
Reference Schlatter, Li, Örlü, Hussain and Henningson2014), whereas others have observed them in that region (Wu Reference Wu2010). Furthermore, the high-resolution holographic PIV experiments of Sheng, Malkiel & Katz (Reference Sheng, Malkiel and Katz2009) reveal hairpin vortices. Even if it turns out that their number density is low, it remains possible that hairpins are important in certain physical processes, such as the mixing of momentum. This idea is, for instance, supported by the hairpin appearing in the conditional average flow around ejection events, as already discussed in the above. Near-wall low-speed streaks and associated quasi-streamwise vortices can be a source of turbulent motion, but that does not imply that they contribute importantly to the Reynolds shear stress. In fact, the wall-normal location of the peak Reynolds shear stress does not overlap with the near-wall peak of the streamwise velocity fluctuations, which is associated with the streaks and is located at
 $y^{+}\approx 15$
.
In order to address these open questions related to hairpin vortices, we present new 3D time-resolved velocity measurements in a fully developed and unperturbed turbulent boundary layer. The resulting flow fields are inspected for possible hairpin auto-generation events. Additionally, the instantaneous vortical structures close to the wall are visualized in order to contribute to the discussion on the existence of hairpins below
 $y^{+}=60$
. Our new data improve considerably over existing 3D time-resolved velocity measurements in terms of the spatial resolution, which allows the vortices in the near-wall region to be resolved, as discussed in § 2. In the remainder of the paper, the experimental dataset obtained by time-resolved tomographic PIV is introduced (§ 2) and its accuracy is assessed (§ 3). The instantaneous flow structures are presented in § 4, which is followed by a discussion of the hairpin vortex dynamics observed in our data (§ 5). Finally, the findings are summarized in § 6.
2 Experimental set-up
2.1 Flow facility and boundary layer properties
The experiments were performed in the water tunnel of the Laboratory for Aero and Hydrodynamics at Delft University of Technology, which had a cross-section of 600 mm
 $\times$
600 mm. The boundary layer was created over one of the tunnel sidewalls, which was made of 32 mm thick Plexiglas to allow optical access. A zigzag trip was placed 500 mm downstream of the test section inlet to force the boundary layer to become turbulent. The time-resolved tomographic PIV measurements were performed 3.5 m downstream of the trip. The free-stream velocity
 $U_{e}$
was 0.253 m s
 $^{-1}$
with the free-stream turbulence intensity level below 0.7 %. These values, as well as the boundary layer characteristics, were obtained by independent planar PIV measurements, which covered the whole boundary layer region and part of the free-stream flow. The measurement plane in this case was 97 mm
 $\times$
146 mm in the streamwise and wall-normal directions, while the spatial resolution was 0.48 mm (based on the correlation window size). At the measurement location, the boundary layer thickness,
 ${\it\delta}_{99}$
, and the momentum thickness,
 ${\it\theta}$
, were 69.9 mm and 7.70 mm, respectively. The corresponding Reynolds number based on momentum thickness,
 $Re_{{\it\theta}}$
, was 2038, which is considered sufficiently high to avoid transition affecting the boundary layer properties (Erm & Joubert Reference Erm and Joubert1991; Schlatter & Örlü Reference Schlatter and Örlü2012). The friction velocity,
 $u_{{\it\tau}}$
, was obtained by the Clauser chart method. An overview of the boundary layer properties is provided in table 1, where
 ${\it\nu}$
is the kinematic viscosity.
Tomographic PIV experimental arrangement: a picture showing the camera configuration (a) and a sketch of the volume illumination system (b). The boundary layer over the sidewall closest to the cameras is measured.

Summary of the turbulent boundary layer properties.

Furthermore, we define the
 $x$
,
 $y$
and
 $z$
axes along the streamwise, wall-normal and spanwise directions, respectively; with the corresponding fluctuating velocity components given by
 $u$
,
 $v$
and
 $w$
; and
 $U$
gives the mean velocity in the streamwise direction. Space, time and velocity are non-dimensionalized in wall units using
 ${\it\nu}/u_{{\it\tau}}$
,
 ${\it\nu}/u_{{\it\tau}}^{2}$
and
 $u_{{\it\tau}}$
, respectively, which is indicated by the superscript
 $+$
.
2.2 Time-resolved tomographic PIV
The temporal evolution of the 3D velocity distribution within the boundary layer was measured by tomographic PIV (Elsinga et al.
Reference Elsinga, Scarano, Wieneke and Van Oudheusden2006). The tomographic system consisted of four LaVision Imager Pro HS 4M cameras (
 $2016\times 2016$
pixels, 12 bits) in a rectangular arrangement (figure 1). They were mounted with Scheimpflug adapters and 105 mm Nikon lenses at
 $f/8$
for the upper cameras and
 $f/16$
for the lower cameras. The off-axis viewing angle was approximately 25
 $^{\circ }$
in air, reducing to 18.5
 $^{\circ }$
in water due to the change in refractive index at the tunnel wall. Note that no prisms were used to correct for this effect. The water flow was seeded with nearly neutrally buoyant 10
 ${\rm\mu}$
m hollow glass spheres (Sphericel) up to a concentration equivalent to a particle image density of 0.03 particles per pixel, which was confirmed by counting intensity peaks in the images. The tracer particles were illuminated by a dual-cavity 30 mJ pulse
 $^{-1}$
 $\text{Nd}:\text{YLF}$
laser in a 15 mm thick volume touching the wall. A knife-edge slit was added in the path of the laser to cut low-intensity sidelobes from the light profile outside this volume. The total measurement volume was 60 mm
 $\times$
14.5 mm
 $\times$
55 mm, corresponding to
 $670\times 160\times 610$
wall units in the streamwise, wall-normal and spanwise directions, respectively, which was imaged at a resolution of 28.0 pixels mm
 $^{-1}$
. The measurement volume was located at the tunnel mid-height, 300 mm below the water level. The recording rate was constant at 1279 Hz, resulting in an approximate 3.3 pixels maximum particle displacement between consecutive frames. The time between frames corresponds to
 $0.094{\it\nu}/u_{{\it\tau}}^{2}$
. In total, three time series of 3140 images each were recorded and analysed, which corresponds to 7.37 s of data.
Average reconstructed intensity,
 $I$
, in the wall-normal direction normalized by its maximum. Inside the wall the intensity is low as there are no tracer particles. It contrasts the elevated intensities due to the tracers in the fluid. Hence, the sharp rise in the intensity on the left marks the wall position.

The instantaneous particle intensity distribution was reconstructed in 3D space by the MART tomographic algorithm with five iterations (Elsinga et al.
Reference Elsinga, Scarano, Wieneke and Van Oudheusden2006) at a resolution of 23.4 voxels mm
 $^{-1}$
. The first three iterations were followed by volume enhancement by Gaussian smoothing (Discetti, Natale & Astarita Reference Discetti, Natale and Astarita2013). Image pre-processing, that is, background subtraction and Gaussian smoothing with a kernel size of
 $3\times 3$
pixels, and volume self-calibration (Wieneke Reference Wieneke2008) were applied to improve the accuracy of the reconstruction. The position of the wall within the measurement volume, hence the origin of the wall-normal coordinate, was determined as the position where the reconstructed light intensity distribution changes suddenly (figure 2).
The particle displacement field was obtained from the sequence of reconstructed volumes using an iterative cross-correlation technique with multi-grid and window deformation (Scarano & Riethmuller Reference Scarano and Riethmuller2000) and considering volumes that were six time steps (4.69 ms) apart in order to enhance the dynamic velocity range of the measurement. The resulting maximum particle displacement was 19.8 voxels. The first reconstructed volume was thus correlated with the seventh volume in the time sequence, the second with the eighth volume and so on. The resulting temporal oversampling of the velocity field was used for later filtering purposes, as explained below. The final cross-correlation volume (interrogation volume) size was
 $32\times 32\times 32$
voxels corresponding to 1.37 mm
 $\times$
1.37 mm
 $\times$
1.37 mm, with 75 % overlap between neighbouring interrogation volumes. The resulting vector spacing in each direction was 0.34 mm. The region close to the wall (
 $y^{+}<40$
) was also processed using a final correlation window of
 $64\times 16\times 32$
voxels at 75 % overlap. This improved the spatial resolution in the wall-normal direction, which was necessary to capture the strong particle displacement gradients in that direction. The universal outlier detection method was used to remove spurious vectors (Westerweel & Scarano Reference Westerweel and Scarano2005).
In order to suppress measurement noise, the velocity field was filtered in both time and space. First, the time signal at each point in space was filtered using a second-order polynomial regression (Savitzky & Golay Reference Savitzky and Golay1964). The polynomial was fitted to the velocity signal over 19 points in time, which corresponds to a period of 14.1 ms, or 1.7 wall units. Next, these temporally filtered velocity fields were spatially filtered. The spatial filter again was a second-order regression, which was performed on the
 $7\times 7\times 7$
neighbourhood around each point. The kernel corresponds to a volume of 2.05 mm
 $\times$
2.05 mm
 $\times$
2.05 mm, or
 $23\times 23\times 23$
wall units. In the near-wall region, the filter volume was 4.10 mm
 $\times$
1.02 mm
 $\times$
2.05 mm (
 $46\times 12\times 23$
wall units) due to the different interrogation volumes used. The regression was also used to determine the local velocity gradients. The specific implementation details of the spatial filter and its filter characteristics are described in Elsinga et al. (Reference Elsinga, Adrian, Van Oudheusden and Scarano2010). Note that both filters are linear (Savitzky & Golay Reference Savitzky and Golay1964).
The correlation window size of 15 wall units and the spatial filter wavelength of 23 wall units are equivalent to approximately 6.1 and 9.2 Kolmogorov length scales, respectively. Here, we estimate the Kolmogorov length scale,
 ${\it\eta}$
, at 2.5 wall units (Stanislas, Perret & Foucaut Reference Stanislas, Perret and Foucaut2008). The present spatial resolution is comparable to the size of the coherent fine-scale eddies close to the wall, which is (8–10)
 ${\it\eta}$
as reported by Tanahashi et al. (Reference Tanahashi, Kang, Miyamoto, Shiokawa and Miyauchi2004) for channel flow at comparable Reynolds number (
 $Re_{{\it\tau}}=800$
). Hence these vortices can be considered resolved/captured. The expected structure size and the spatial resolution are, furthermore, consistent with the (6–10)
 ${\it\eta}$
diameter generally reported for the intense vortical structures in turbulent flows (Jimenez et al.
Reference Jimenez, Wray, Saffman and Rogallo1993; Sheng et al.
Reference Sheng, Malkiel and Katz2009; Herpin et al.
Reference Herpin, Stanislas, Foucaut and Coudert2013).
The present spatial resolution is an improvement over existing time-resolved tomographic PIV datasets of wall-bounded turbulence, which used cross-correlation windows of
 $55\times 55\times 55$
wall units (Schröder et al.
Reference Schröder, Geisler, Staack, Elsinga, Scarano, Wieneke, Henning, Poelma and Westerweel2011) and
 $43\times 22\times 43$
wall units (Ghaemi & Scarano Reference Ghaemi and Scarano2013). The 40–55 wall unit spatial resolution is considered insufficient to capture the vortices in the near-wall region with an expected diameter of 25 wall units (corresponding to 10
 ${\it\eta}$
). On the other hand, the non-time-resolved holographic PIV experiment of Sheng et al. (Reference Sheng, Malkiel and Katz2009) offers much higher spatial resolution at
 $5\times 2.5\times 5$
wall units. The high spatial resolution resulted in a measurement volume of just
 $88\times 145\times 88$
wall units due to fundamental limitations in the dynamic spatial range of PIV (Westerweel, Elsinga & Adrian Reference Westerweel, Elsinga and Adrian2013). Such a small volume leads to very short observation times if the measurement is time-resolved, because the structures convect out of the observation domain quickly. Furthermore, larger observation domains are advantageous when studying the 100–300 wall unit long quasi-streamwise vortices and their spatial organization (Jeong et al.
Reference Jeong, Hussain, Schoppa and Kim1997; Waleffe Reference Waleffe2001; Schoppa & Hussain Reference Schoppa and Hussain2002; see also § 4.2). The finite dynamic spatial range of PIV thus needs to be carefully tailored to the turbulent motions that one wishes to investigate; in this case the vortices and their downstream evolution. We have, therefore, chosen a spatial resolution that is just sufficient to capture the vortices, which allows the field of view, and consequently the observation time, to be as large as possible.
3 Assessment of the measured velocity
The mean velocity profile returned by tomographic PIV compares well with our planar PIV measurements and the DNS data at
 $Re_{{\it\theta}}=2000$
by Schlatter & Örlü (Reference Schlatter and Örlü2010) (figure 3
a). As expected, the elongated correlation volumes (
 $64\times 16\times 32$
voxels) improve the result close to the wall, mainly for
 $y^{+}<25$
. Still, the velocity is overestimated below
 $y^{+}=6$
, which is explained by the correlation volumes partially overlapping with the wall below this wall-normal distance (Kähler, Scharnowski & Cierpka Reference Kähler, Scharnowski and Cierpka2012). Furthermore, the mean velocity profile by tomographic PIV deviates from the expected trend in the direction of lower velocity for
 $y^{+}>140$
. This is attributed to ghost particles, which are spurious intensity peaks in the reconstructed intensity distribution. Near the edge of the illuminated volume, at approximately
 $y^{+}=150$
, the light intensity decreases (figure 2), hence the intensity of the true particles drops relative to the reconstruction noise level, i.e. ghost particle intensity. Therefore, towards the edge of the volume the ghosts can contribute to the cross-correlation analysis and introduce a bias error as explained in Elsinga et al. (Reference Elsinga, Westerweel, Scarano and Novara2011).
Profiles of the root mean square (r.m.s.) velocity are presented and compared against the DNS database (Schlatter & Örlü Reference Schlatter and Örlü2010) in figure 3(b). Considering the streamwise velocity component, the tomographic PIV results capture the near-wall peak at
 $y^{+}=15$
, which is further evidence for the velocity being well resolved. Again, the elongated windows yield better results than the cubic windows below
 $y^{+}=25$
. Between
 $y^{+}=50$
and 140, the present
 $u_{rms}^{+}$
profiles show lower values with respect to the DNS, but the differences remain within 6 %. The lower streamwise velocity fluctuations in that region we attribute to a slightly favourable pressure gradient in our facility (Eisma et al.
Reference Eisma, Westerweel, Ooms and Elsinga2015), and the associated uncertainty in determining the friction velocity,
 $u_{{\it\tau}}$
, used for normalization. The present spatial resolution would explain only a 1–2 % drop of the r.m.s. velocity (Saikrishnan, Marusic & Longmire Reference Saikrishnan, Marusic and Longmire2006). The r.m.s. of the other velocity components also agree within 6 %.
Based on the assessment of the velocity statistics, it is concluded that the tomographic PIV data are reliable in the range
 $6<y^{+}<140$
. Furthermore, the elongated interrogation volumes improved the velocity statistics close to the wall (
 $y^{+}<25$
). For further analysis and visualization purposes, we will therefore use the data from the elongated interrogation volumes below
 $y^{+}=25$
, while data from the regular cubic interrogation volumes are used beyond that wall-normal distance.
Mean (a) and r.m.s. (b) velocity profiles returned by tomographic PIV using cubic and elongated correlation volumes are compared against the DNS database of Schlatter & Örlü (Reference Schlatter and Örlü2010), and the present planar PIV experiments.

Joint p.d.f. of
 $-\partial u/\partial x$
and
 $(\partial v/\partial y+\partial w/\partial z)$
evaluated between
 $y^{+}=40$
and 60. Points away from the diagonal indicate divergence error. The contours are in log scale.

The accuracy of the velocity gradients can be assessed based on the divergence. For an incompressible flow like the present boundary layer, the conservation of mass requires the divergence of the velocity field to be identically zero everywhere:
 $$\begin{eqnarray}\boldsymbol{{\rm\nabla}}\boldsymbol{\cdot }\boldsymbol{V}=\frac{\partial u}{\partial x}+\frac{\partial v}{\partial y}+\frac{\partial w}{\partial z}=0.\end{eqnarray}$$
The joint probability density function (p.d.f.) of the two components
 $-\partial u/\partial x$
and
 $(\partial v/\partial y+\partial w/\partial z)$
contributing to the divergence is shown in figure 4. Points away from the diagonal in this plot correspond to non-zero divergence, and hence indicate measurement error. The correlation coefficient between these components varies with wall-normal distance between 0.84 and 0.88, which quantifies the accuracy of the velocity gradients. It compares well with other 3D PIV experiments (Ganapathisubramani, Lakshminarasimhan & Clemens Reference Ganapathisubramani, Lakshminarasimhan and Clemens2007; Casey, Sakakibara & Thoroddsen Reference Casey, Sakakibara and Thoroddsen2013), although a scanning approach can achieve higher values of up to 0.98 in slow flows (
 ${\sim}$
7 mm s
 $^{-1}$
) (Lawson & Dawson Reference Lawson and Dawson2014). The correlation coefficient is based on the total signal, i.e. the true velocity gradient plus the measurement noise. Therefore, it is sensitive to the magnitude of the true velocity gradients, which depend on the wall-normal distance. A better measure for the uncertainty on the velocity gradients is based on the r.m.s. divergence error, which is determined primarily by the noise. The present r.m.s. divergence error is 1.5 s
 $^{-1}$
(0.013 wall units). Assuming that the errors on the individual velocity gradients are independent, their uncertainty is 0.007 wall units and the uncertainty on the vorticity is 0.010 wall units. Below
 $y^{+}=25$
, the divergence error is slightly higher at 1.9 s
 $^{-1}$
(0.016 wall units).
Streamwise velocity in wall units simultaneously at two wall-normal distances,
 $y^{+}=15$
(a) and 121 (b), which reveal different flow scales.

The auto-correlation coefficient,
 $R$
, of the velocity fluctuations for spanwise shifts
 ${\rm\Delta}z^{+}$
, evaluated at two wall-normal distances,
 $y^{+}=15$
(a) and 121 (b).

4 Instantaneous flow structures
4.1 Velocity structures
The measurement volume spans the buffer layer and part of the logarithmic layer. It is, therefore, expected to contain a broad range of scales. Close to the wall at
 $y^{+}=15$
we observe the well-known low-speed streaks (Kline et al.
Reference Kline, Reynolds, Schraub and Runstadler1967), which are quite thin in the spanwise direction, but can extend beyond the size of the present measurement volume in the streamwise direction (figure 5
a). Furthermore, the visualization shows a spanwise spacing between the streaks of the order of 100 wall units, which is in line with the values quoted in the literature (Gupta, Laufer & Kaplan Reference Gupta, Laufer and Kaplan1971; Smith & Metzler Reference Smith and Metzler1983; Kähler Reference Kähler2004). The spanwise dimension of the velocity structures is quantified by means of the spatial auto-correlation functions (figure 6
a). The correlation coefficient for the streamwise velocity component,
 $u$
, drops to zero at
 ${\rm\Delta}z^{+}=50$
, which can be interpreted as the characteristic width of the near-wall high- and low-speed streaks and is consistent with the mentioned streak spacing of 100 wall units. The correlation of the
 $v$
and
 $w$
velocity components cross zero at
 ${\rm\Delta}z^{+}=25$
and 86, respectively. Furthermore, the correlation of
 $v$
shows a distinct minimum at
 ${\rm\Delta}z^{+}=40$
, in agreement with the results of Kähler (Reference Kähler2004).
Farther from the wall at
 $y^{+}=121$
, the appearance of the streamwise velocity structures has changed significantly (figure 5
b). The streamwise coherence is less pronounced and the structures are clearly wider in the spanwise direction when compared to the near-wall region (figure 5
a). The increased structure width is confirmed by the spanwise correlations shown in figure 6(b), where the zero crossings are at
 ${\rm\Delta}z^{+}=136$
, 123 and 214 for the correlations corresponding to the fluctuating velocity components
 $u$
,
 $v$
and
 $w$
, respectively. The two wall-parallel planes presented in figure 5 are taken from the same instantaneous 3D velocity field, yet there does not appear to be an obvious visual correspondence between them. It strongly suggests that they represent different structures, which, moreover, will probably be convected at different speeds. In particular, the (larger) structures away from the wall are expected to convect faster than the smaller scales close to the wall (Del Alamo & Jimenez Reference Del Alamo and Jimenez2009), following the increase in the average flow velocity with the wall distance. Those differences become important when considering the dynamics in § 5.
4.2 Vortices below
 $y^{+}=120$

In this section we provide examples of vortical structures encountered in the measurement. The focus is on the near-wall region below
 $y^{+}=120$
, where the full extent of the structure can be observed. The vortical structures farther from the wall very often extend beyond the edge of the measurement volume and cannot be characterized in full. Note that at the present Reynolds number
 $y^{+}=120$
also corresponds to the upper bound of the logarithmic region,
 $0.15Re_{{\it\tau}}$
, as defined by Marusic et al. (Reference Marusic, Monty, Hultmark and Smits2013). Moreover, the number density of vortices is highest in this near-wall region, reaching a peak at
 $y^{+}=30{-}50$
(Tanahashi et al.
Reference Tanahashi, Kang, Miyamoto, Shiokawa and Miyauchi2004; Wu & Christensen Reference Wu and Christensen2006; Stanislas et al.
Reference Stanislas, Perret and Foucaut2008).
Staggered array of quasi-streamwise vortices around a low-speed streak in top (a) and side (b) views. The vortices are revealed by the isosurface of swirling strength (Zhou et al.
Reference Zhou, Adrian, Balachandar and Kendall1999) at
 $0.06u_{{\it\tau}}^{2}/{\it\nu}$
(green). The blue surface represents a streamwise velocity of
 $11u_{{\it\tau}}$
. Vortical structures above
 $y^{+}=100$
were removed for clarity.

The first example is that of a series of quasi-streamwise vortices, which are in a staggered arrangement around a low-speed streak (figure 7). The vortices on opposite sides of the streak are counter-rotating. Furthermore, the vortices are located at approximately
 $y^{+}=50$
or below, and their length is approximately 100 wall units. The most upstream streamwise vortex in this example is an exception, with a length of approximately 200 wall units. Furthermore, it is connected to the arch vortex located at
 $x^{+}=-200$
. Quasi-streamwise vortices have been widely observed in the buffer layer using DNS (Robinson Reference Robinson1991; Jeong et al.
Reference Jeong, Hussain, Schoppa and Kim1997; Schlatter et al.
Reference Schlatter, Li, Örlü, Hussain and Henningson2014). Moreover, the staggered array of quasi-streamwise vortices alongside an undulating low-speed streak is reminiscent of a number of models for near-wall turbulence, such as the (unstable) travelling wave solutions in channel flow (Waleffe Reference Waleffe2001), the streak transient growth mechanism (Schoppa & Hussain Reference Schoppa and Hussain2002), the autonomous near-wall cycles (Jimenez & Pinelli Reference Jimenez and Pinelli1999; Jimenez & Simens Reference Jimenez and Simens2001) and the sinuous breakdown of low-speed streaks in bypass transition (Schlatter et al.
Reference Schlatter, Brandt, de Lange and Henningson2008). In particular, the travelling wave solutions (Waleffe Reference Waleffe2001) reveal vortices of approximately 100 wall units in length, which is close to the typical length observed in figure 7. The present results provide a first direct experimental observation of such a quasi-streamwise vortex array in the buffer layer of a fully developed turbulent boundary layer at moderate Reynolds number, which was not possible before due to limitations in spatial resolution or measurement volume size (see § 2).
Taller quasi-streamwise vortices, which gradually arch over the low-speed streak. The vortices are shown in oblique (a), top (b) and side (c) views by means of an isosurface of the swirling strength (green, level
 $0.06u_{{\it\tau}}^{2}/{\it\nu}$
). The streamwise velocity isosurface of
 $9u_{{\it\tau}}$
is shown in blue. The latter is not included in (c) for clarity. The dashed lines in (b) and (c) mark the three quasi-streamwise vortices. Thin dashed lines are used in (b) to indicate the branches on the upstream and the middle vortex.

Figure 8 presents an array of three taller quasi-streamwise vortices. They extend up to approximately
 $y^{+}=100$
and they are approximately 150–250 wall units long in the streamwise direction. The length seems consistent with those reported in Jeong et al. (Reference Jeong, Hussain, Schoppa and Kim1997) and the vortices developing in the streak transient growth mechanism (see figure 25 in Schoppa & Hussain (Reference Schoppa and Hussain2002)). Besides being taller and longer, their general shape also shows differences with respect to the vortices in figure 7. Most notably, their heads (i.e. the part farthest from the wall) gently curve/arch over the low-speed streak underneath (figure 8), whereas before the smaller quasi-streamwise vortices were much straighter (figure 7). One may, therefore, also refer to these curved streamwise vortices as canes, depending on how strict one wishes to define a cane shape. Out of the main vortices, some branches seem to have developed. The most upstream quasi-streamwise vortex, for example, has a branch at
 $x^{+}=0$
, which creates a small arch. However, this arch is not a hairpin vortex, as the branch is co-rotating with the main quasi-streamwise vortex to which it is connected. Furthermore, a spanwise vortex element is seen close to this vortex at
 $(x^{+},y^{+})=(-70,80)$
. Also the second quasi-streamwise vortex has a co-rotating branch at
 $x^{+}=170$
(figure 8
b). Here, we have defined the main vortex as the part with the thicker core, associated with higher peak swirling strength inside, and the branch as the thinner protrusion with lower associated peak swirling strength.
Given their larger size, it is possible that the vortices in figure 8 represent a later stage of development from initially smaller quasi-streamwise vortices similar to those shown in figure 7. The latter can be associated with travelling wave solutions, which are unstable (Waleffe Reference Waleffe2001) and therefore are expected to grow. This growth process may be described by a streak transient growth mechanism, which indeed seems to generate longer and slightly curved vortices (Schoppa & Hussain Reference Schoppa and Hussain2002). Unfortunately, this is a relatively slow process and the present observation time is limited, so this conjecture cannot be tested.
A hairpin packet in oblique (a), top (b) and side (c) views. Vortices (green) are visualized using swirling strength (
 $0.08u_{{\it\tau}}^{2}/{\it\nu}$
). In (a) the blue surface indicates a streamwise velocity of
 $14u_{{\it\tau}}$
.

The last example is a hairpin packet (figure 9). Note that unattached neighbouring vortices were removed from the visualization for clarity. The packet contains a smaller upstream and a taller downstream hairpin. The streamwise distance between the hairpin heads is 120 wall units, which is consistent with the 120–160 wall units spacing observed by Adrian et al. (Reference Adrian, Meinhart and Tomkins2000). The heads in the present packet are at
 $y^{+}=50$
and 110, which is again similar to an earlier observation of packet structures in planar PIV data (Adrian et al.
Reference Adrian, Meinhart and Tomkins2000). Both hairpins are symmetric in the sense that they have two counter-rotating legs, one on each side of the low-speed flow region enclosed by the packet. The distance between the legs is approximately 50 wall units, consistent with the width of near-wall low-speed streaks. Overall, the vortices closely resemble the idealized omega-shaped hairpin (Smith Reference Smith, Zakin and Patterson1984; Zhou et al.
Reference Zhou, Adrian, Balachandar and Kendall1999). Specifically, the legs are inclined at a small angle with the wall (8
 $^{\circ }$
–12
 $^{\circ }$
), while the neck is inclined at much larger angles (45
 $^{\circ }$
–80
 $^{\circ }$
). Moreover, the legs are seen to bend outwards at their most upstream tip. This indicates that the vorticity associated with the vortex is turned towards the spanwise direction, which is the direction of the mean vorticity. Furthermore, the packet in figure 9 shows two so-called tongues, which are the nearly horizontal vortices attached to the head of the tallest hairpin and pointing in the downstream direction. The whole hairpin packet, including the tongues, appears very similar to the vortical structure, which develops during the auto-generation process described by Zhou et al. (Reference Zhou, Adrian, Balachandar and Kendall1999). The present results, as well as results in Sheng et al. (Reference Sheng, Malkiel and Katz2009), e.g. their figure 4, provide clear experimental evidence showing that hairpins (figure 9) or arches (figure 7) can be found in the near-wall region below
 $y^{+}=60$
. The experimental findings thus contradict the DNS results, which did not reveal any such arch or hairpin vortex structure in that region (Jeong et al.
Reference Jeong, Hussain, Schoppa and Kim1997; Schlatter et al.
Reference Schlatter, Li, Örlü, Hussain and Henningson2014). Still, the quasi-streamwise vortices appear more pronounced in visualizations below
 $y^{+}=60$
, also in the experiments.
Time series showing an auto-generation event:
 $t^{+}=66.97$
(a), 71.46 (b), 80.16 (c), 93.54 (d), 102.89 (e), 107.57 (f), 112.24 (g) and 115.99 (h). Vortices are visualized using the isosurface of swirling strength (
 $0.08u_{{\it\tau}}^{2}/{\it\nu}$
), which is colour-coded according to the local streamwise velocity in wall units (a colour legend is included in (h)). The black surface indicates a streamwise velocity of
 $11u_{{\it\tau}}$
in the region above
 $y^{+}=14$
.

5 Auto-generation
Having confirmed the existence of hairpin vortices and packets, we continue by considering their dynamics. In particular, we want to know if the proposed auto-generation mechanism for hairpins and packets (Zhou et al. Reference Zhou, Adrian, Balachandar and Kendall1999) occurs naturally within a fully developed turbulent boundary layer flow, that is, within a boundary layer not perturbed by artificially inserting an eddy, as in Kim et al. (Reference Kim, Sung and Adrian2008).
As a starting point, we take the packet shown before in figure 9 and consider its earlier and subsequent development, which is presented in figure 10. A movie showing the evolution is provided as supplementary material with this paper, available at http://dx.doi.org/10.1017/jfm.2016.153. The sequence starts with a group of vortices aligned in the streamwise direction, which are marked L1, H1 and H2 in figure 10(a). The most downstream structure (L1) is inclined at approximately 45
 $^{\circ }$
with the wall and extends beyond the height of the measurement domain. Therefore, it is not possible to characterize it fully. The second vortex (H1) is a cane-type structure. Its head is at
 $y^{+}=140$
, while its leg is adjacent to the low-speed streak visualized by the black isosurface. The upstream structure (H2) is a quasi-streamwise vortex, which starts on one side of the low-speed streak, curves over the streak and continues on the other side. Over the streak it reaches its maximum height at
 $y^{+}=75$
. With time, the leg of H2 develops a kink, leading to the branch H3 visible in figure 10(b). The leg on the opposite side of the low-speed streak also shows a branch (H4, figure 10
b), which has convected into the measurement domain at approximately the same time. Both branches (H3 and H4) eventually connect to the leg on the opposite side of the low-speed streak, thereby creating hairpins (figure 10
b–d). The packet shown in figure 10(d) is in fact the same as in figure 9. The development of the hairpin H3 in particular is accompanied by growth in the wall-normal direction. Between figures 10(b) and 10(d) its head moves up from
 $y^{+}=75$
to 110. Also, the downstream structure H1 grows in height. In figure 10(c) its head extends beyond the measurement volume. Furthermore, H1 experiences a strong deformation due to the large velocity differences along its head. While H1 and H3 grow, the vortex structure in between them, H2, weakens considerably. At the time instant corresponding to figure 10(d) it has shrunk and has become one of the so-called tongues that stick out of hairpin H3 in the downstream direction. The other (smaller) tongue also is a remnant of a quasi-streamwise vortex, which has been lifted from the wall following the growth of H3. Tongues were observed before by Zhou et al. (Reference Zhou, Adrian, Balachandar and Kendall1999); however, their origin remained unclear. Our results offer a possible explanation for their existence, i.e. tongues are the lifted parts of the quasi-streamwise vortices from which the hairpin developed. The present hairpin packet structure (figure 10
d) thus originates from the kinks/branches developing on the quasi-streamwise vortices on either side of the low-speed streak. The time scale associated with this development is approximately 30 wall units. From the present observations, it is concluded that hairpins and packets are not simply features remaining in the boundary layer after being created in the transition process far upstream, as has been suggested in the past (Schlatter et al.
Reference Schlatter, Li, Örlü, Hussain and Henningson2014). They can be created within the fully developed turbulent flow on relatively short time scales.
The subsequent evolution of this packet is initially characterized by a further growth of the hairpin H3, and, to a lesser extent, of H4. Furthermore, hairpin H4 is observed to temporarily connect to a small blob of swirling motion, which convects past H4 at a higher velocity (figure 10
e). Then inverted cane/arch vortices are seen to approach the packet, which are marked S1 and S2 in figure 10(e,f). The spanwise-oriented parts of S1 and S2 are located at
 $y^{+}=70$
and 80, respectively, and rotate against the mean flow, which can be inferred from the streamwise velocity magnitude over its isosurface. In particular, the top side of the spanwise element has a lower associated velocity as compared to the under side. Thus S1 and S2 are examples of so-called retrograde vortices (Wu & Christensen Reference Wu and Christensen2006). The inverted arch S1 has a dynamic significance in this example. As it approaches the head of hairpin H4, a new small blob of swirling motion (H5) is detected over the low-speed streak approximately 100 wall units upstream of H4 (figure 10
g). The initially small blob develops into a new arch vortex (H5) in just 3–4 wall units time by connecting to the leg of the upstream hairpin H4 (figure 10
h). The fact that the head develops first is consistent with the auto-generation mechanisms reported in the literature (Zhou et al.
Reference Zhou, Adrian, Balachandar and Kendall1999; Goudar, Breugem & Elsinga Reference Goudar, Breugem and Elsinga2016). The head of the new arch (H5) is located at 25–30 wall units distance from the wall. This is clear evidence of an auto-generation event, in which a new smaller hairpin (H5 in this case) is created upstream of an existing hairpin (H4).
Velocity vectors in the plane
 $z^{+}=-90$
, which intersects with the newly formed hairpin head H5:
 $t^{+}=102.89$
(a), 107.57 (b), 112.24 (c) and 115.99 (d). Note that in each direction only every other vector is plotted for clarity. A streamwise velocity of
 $14u_{{\it\tau}}$
is subtracted to highlight local swirling motions in the new hairpin head H5. These swirling motions are also indicated by contours of 3D swirling strength
 ${>}0.06u_{{\it\tau}}^{2}/{\it\nu}$
.
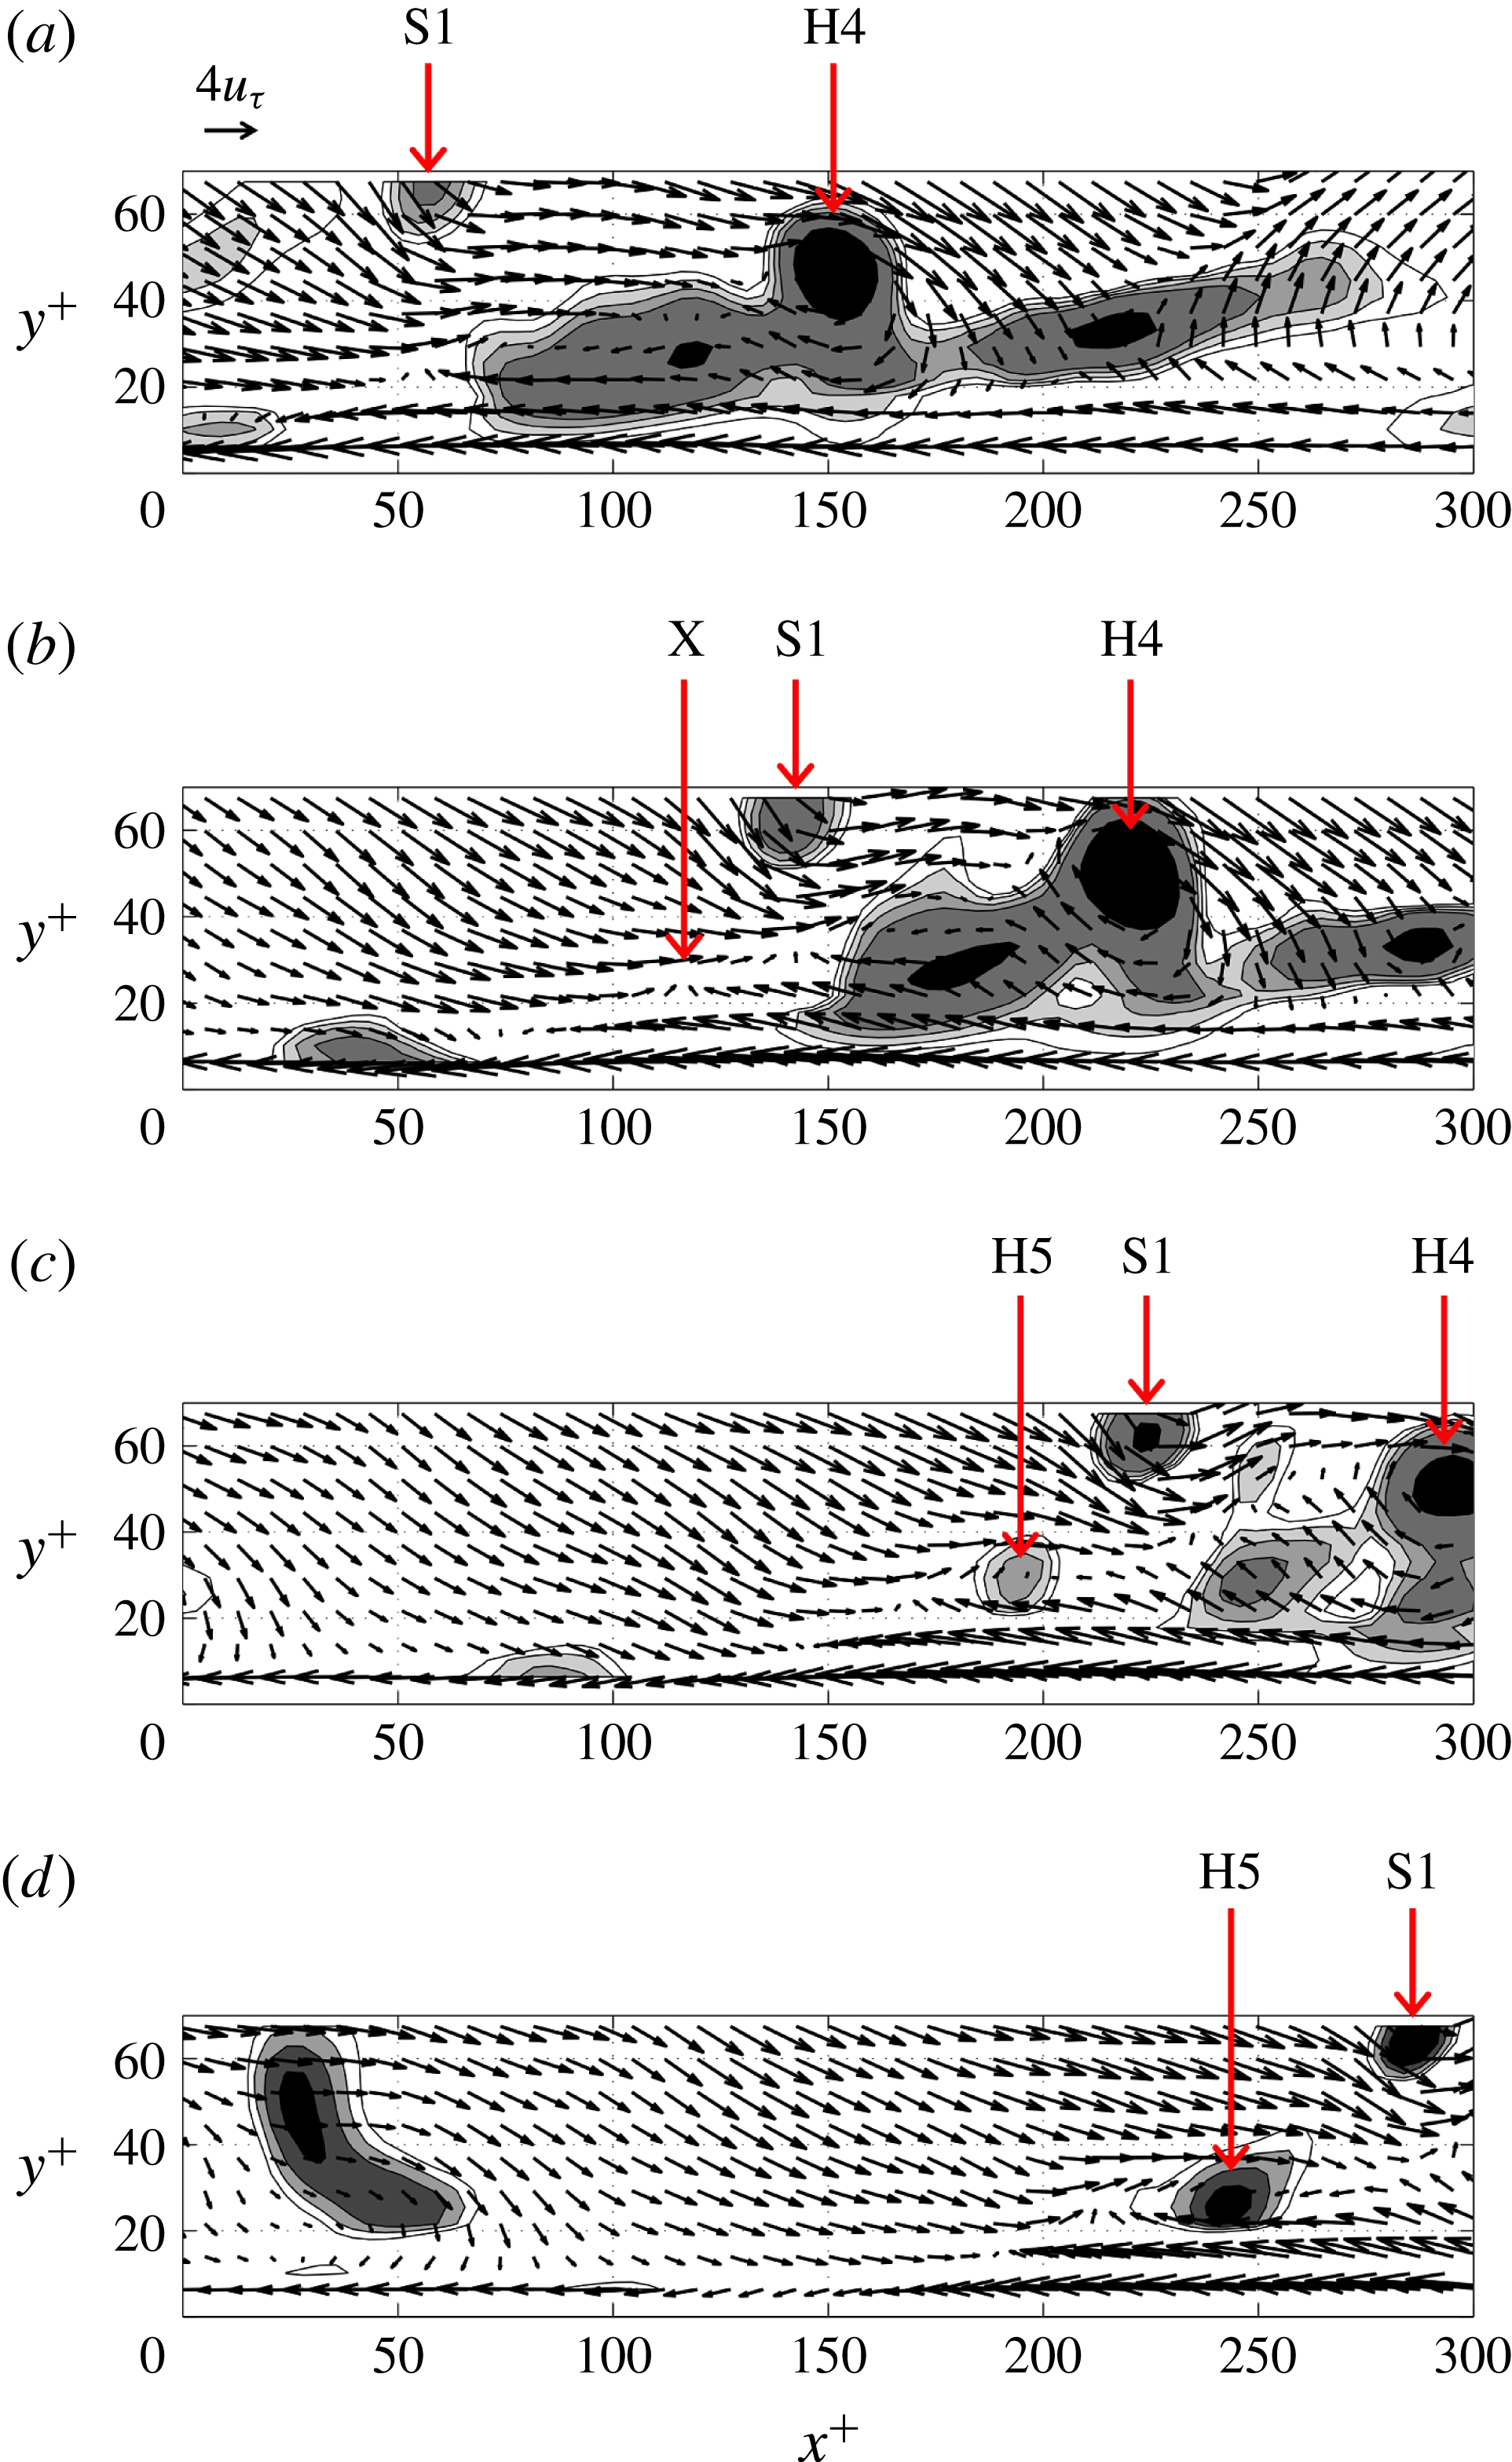
The interaction between the inverted arch S1 and the hairpin H4 is further detailed by means of the velocity vectors in the streamwise–wall-normal plane (figure 11). The plane is taken to intersect with the new hairpin head H5 and is slightly off-centre in the spanwise direction with respect to the other hairpin heads, which means that it intersects part of the leg of H4. The time instants in figure 11(a–d) correspond to those presented in figure 10(e–h), respectively. Figure 11(a) shows that the structure S1 is associated with a sweep event (
 $u>0$
,
 $v<0$
) just upstream of it. The streamwise velocity within its core is higher than that within the hairpin head H4; therefore it convects at a higher velocity and approaches H4. Upstream and downstream of the hairpin head H4, elongated regions of swirl are indicated by the grey contours. These regions correspond to the legs of H4 and the downstream hairpin H3. The approaching inverted arch S1 and its associated sweep cause the leg upstream of the head H4 to deform. The leg shortens and becomes more inclined with respect to the wall, i.e. the sweep pushes the upstream part of the leg in the streamwise direction. Simultaneously, the shear layer that separates the incoming sweep (high-velocity downward flow linked to S1) from the ejection (low-velocity upward flow linked to H4) deforms. As a result, the leg and its associated ejection (
 $u<0$
,
 $v>0$
flow) block more of the incoming high-velocity flow (figure 11
b). The blockage causes most of the incoming flow to deflect upwards and/or in the spanwise direction, so it moves over or alongside the hairpin head H4. However, there remains a small part of the incoming sweep that is deflected downwards and feeds into the low-speed region (figure 11
c). The distorted shear layer then starts to roll up near the point marked X in figure 11(b) and develops the new head H5 (figure 11
c,d). The present observation of incoming high-velocity flow (in this case the sweep associated with vortex S1) deforming the shear layer upstream of an existing hairpin with subsequent roll-up of this shear layer is consistent with the auto-generation scenario outlined in Goudar et al. (Reference Goudar, Breugem and Elsinga2016). Their scenario incorporates the effect of the environment around the initial hairpin, complementing models based mostly on self-induction by the hairpin vortex (Zhou et al.
Reference Zhou, Adrian, Balachandar and Kendall1999). The environment appears to be important when considering hairpins within a fully turbulent flow.
Along the same lines, it may further be speculated that the blocking of an incoming sweep event by an ejection event associated with a quasi-streamwise vortex can also generate a new hairpin. It mainly requires a (sufficiently strong) perturbation of the shear layer that separates the ejection and the incoming high-velocity flow. This scenario could explain the arch observed upstream of the quasi-streamwise vortices in figure 7. Smith et al. (Reference Smith, Walker, Haidari and Sobrun1991) also proposed that new hairpins may form just upstream of a hairpin leg, which can be thought of as a quasi-streamwise vortex. In their model the presence of the head is anyway not required. As in the model by Smith et al. (Reference Smith, Walker, Haidari and Sobrun1991), we observe an ‘eruption’, i.e. the movement of fluid away from the wall, at a point where incoming high-velocity flow collides with the low-velocity flow; see the point marked X in figure 11(b). However, the present eruption is rather weak as compared to their description and it is located in the shear layer above the low-speed streak as opposed to the upstream tip of the streak or at the wall. In our view the eruption mainly initiates the roll-up of vorticity in the existing shear layer.
Moreover, there appears a similarity between the present observations and the mechanism for the explosive growth of an ejection event at the trailing edge of a turbulent spot, as described by Schröder et al. (Reference Schröder, Geisler, Elsinga, Scarano and Dierksheide2008). They observed a sweep event downstream of an already existing arch vortex. This sweep interacted with other structures farther downstream with much lower velocities, which caused a blockage for the sweep. The sweep deflected first in the Q3 direction (
 $u<0$
,
 $v<0$
) and then turned in the direction of the ejection. The sweep thus fed the existing ejection, which thereby grew rapidly. The present results show that sweep events also play a role in creating new hairpin or arch vortices. Furthermore, only a small part of the incoming sweep is deflected downwards into the low-speed streak. This happens just downstream of the new head and it is barely visible in figure 11, where most of the sweep flow is diverted upwards or in the spanwise direction.
If indeed sweep events are important in the dynamics and the generation of certain vortical structures in the near-wall region (
 $y^{+}<60$
), it suggests a mechanism by which the evolution of this region is affected by the outer flow (
 $y^{+}>70$
). The sweep in figure 11 does extend up to at least
 $y^{+}=100$
and is part of a high-velocity region that is even taller. However, low-speed streak formation and the initial development of quasi-streamwise vortices may still be autonomous (Jimenez & Pinelli Reference Jimenez and Pinelli1999).
A quantitative comparison with the auto-generation events in the literature can be made based on the instantaneous Reynolds shear stress, i.e. the product of the instantaneous streamwise and wall-normal velocity fluctuations
 $u^{+}v^{+}$
. The peak ejection strength
 $u^{+}v^{+}$
, associated with the hairpin H4, varies between
 $-$
12 and
 $-$
14 over the
 ${\rm\Delta}t^{+}=20$
time span leading up to the creation of the new arch H5 (corresponding to figure 10
d–f). This peak strength is comparable to the ejection of the
 ${\it\alpha}=2$
conditional eddy at
 $y^{+}=49.6$
,
 $u^{+}v^{+}=-12.8$
(Zhou et al.
Reference Zhou, Adrian, Balachandar and Kendall1999), which is above the threshold strength required for auto-generation in a disturbance-free environment (Zhou et al.
Reference Zhou, Adrian, Balachandar and Kendall1999; Kim et al.
Reference Kim, Sung and Adrian2008). Here,
 ${\it\alpha}$
denotes a multiple of the ejection velocity vector that contributes most to the mean Reynolds shear stress (Zhou et al.
Reference Zhou, Adrian, Balachandar and Kendall1999; Kim et al.
Reference Kim, Sung and Adrian2008; Goudar et al.
Reference Goudar, Breugem and Elsinga2016). When introduced into a fully turbulent channel flow, however, a stronger
 ${\it\alpha}=3$
conditional eddy at
 $y^{+}=51.3$
was found insufficient to trigger the auto-generation of a detectable new hairpin (Kim et al.
Reference Kim, Sung and Adrian2008). The fact that such a strong conditional eddy auto-generates in a disturbance-free flow, but not within a particular turbulent flow, suggests that the details of the environment of the eddy are important when it comes to auto-generation. Both the strength and the turbulent environment of the present hairpin H4 allow the generation of a new arch.
Concerning the environment of the hairpin H4, we observed the incoming sweep associated with S1 (figure 11
a) to play an important role in initiating shear layer roll-up, which eventually led to the creation of the new arch H5 as discussed above. The strength of this sweep event is quantified by a peak
 $u^{+}v^{+}$
of
 $-$
9 before it interacts with the hairpin H4. Additionally, the hairpin H3 located 100–120 wall units downstream of H4 may contribute to the ability of H4 to auto-generate. As shown by Goudar et al. (Reference Goudar, Breugem and Elsinga2016), a packet of two weak conditional eddies, which do not auto-generate individually, can still auto-generate a third hairpin, provided the upstream smaller eddy is within 120 wall units distance from the downstream taller eddy. The present configuration of hairpins satisfies this criterion. Furthermore, the peak ejection strength associated with H3 (
 $u^{+}v^{+}=-14$
) is comparable to that of H4.
Second example of an auto-generation event:
 $t^{+}=148.26$
(a,b), 166.87 (c,d) and 172.02 (e,f). The left column shows the vortices and the low-velocity regions as in figure 10. The right column presents the corresponding velocity vectors and contours of swirling strength in the plane
 $z^{+}=-62$
, which intersects with the newly formed hairpin head H3. Note that in each direction only every other vector is plotted for clarity. A streamwise velocity of
 $14.5u_{{\it\tau}}$
is subtracted to highlight local swirling motions.

A second example of an auto-generation event is presented in figure 12, which serves to demonstrate that this mechanism is not just observed once and illustrates the level of variability between different auto-generation events. The sequence starts again with two arch/hairpin-type vortices, labelled H1 and H2 in figure 12(a,b). The streamwise–wall-normal plane in figure 12(b) partially cuts the leg of H2, which explains the swirling region below and upstream of the head H2 (at
 $(x^{+},y^{+})=(-180,40)$
). Downstream of these arches there is a taller structure (L1), which extends beyond the height of the measurement domain. Upstream and much closer to the wall another arch is observed, labelled H4. At the second time instant shown (figure 12
c,d), the hairpins H1 and H2 have convected downstream faster than the near-wall arch H4. As a result, the streamwise separation between H2 and H4 has increased from approximately 150 to 250 wall units (compare figures 12
b and 12
d). Further note that the swirling strength in the head of H2 increased. At the same time, the high-velocity region above H4 develops a stronger negative wall-normal velocity component under the influence of the approaching vortex S1 (figure 12
c). A much stronger sweep event now interacts with the shear layer upstream of H2, which is observed to roll up and create a new head H3 (figure 12
c,d). The axis of the vortex S1 is in the streamwise–wall-normal plane. Hence, the sweep in this case is associated with a different type of vortical structure as in the example of figure 10. It appears that the incoming sweep is relevant to auto-generation and not so much the vortical structure associated with the sweep. With time, the new head H3 strengthens and connects to the leg of H2, thereby creating a cane-type vortex structure (figure 12
e,f). This auto-generation event is completed on a 20–30 wall unit time scale. A movie showing the evolution of the vortex structures in figure 12 is provided as supplementary material with this paper.
The distortion of the shear layer upstream of H2 is visible from the velocity vectors in figure 12. This layer, which separates the high-velocity region from the low-speed region, is marked by the fluctuating velocity vectors reducing to nearly zero length (relative to the subtracted streamwise velocity). Initially, the shear layer is approximately straight and connects the heads H4, H2 and H1 (figure 12
b). At the second time instant (figure 12
d), it is no longer straight and appears distorted by the incoming sweep. The shear layer is approximately horizontal between heads H4 and H3, and reveals an upward slope with respect to the wall just downstream of H3, as it continues through the heads H2 and H1. At the last time instant, the resulting hairpin heads (H1, H2 and H3) are again on a linear ramp (figure 12
f) consistent with the packet model (Adrian et al.
Reference Adrian, Meinhart and Tomkins2000). The streamwise distances between the heads are 60 wall units and 170 wall units. Furthermore, the newly created cane H3 is yet another example of a hairpin-type vortex observed in the near-wall region below
 $y^{+}=60$
.
The peak instantaneous Reynolds shear stress,
 $u^{+}v^{+}$
, associated with the ejection of the hairpin H2 in figure 12(b) is
 $-$
6. This ejection strength corresponds to an
 ${\it\alpha}=1$
conditional eddy, which is expected not to auto-generate in a clean background, but may auto-generate in the presence of added background noise (Kim et al.
Reference Kim, Sung and Adrian2008) or a downstream hairpin (Goudar et al.
Reference Goudar, Breugem and Elsinga2016). Following the latter explanation, the auto-generation of H3 in figure 12 is promoted by the presence of the hairpin H1 downstream of the hairpin H2. The peak instantaneous Reynolds shear stress,
 $u^{+}v^{+}$
, associated with the incoming sweep is
 $-$
9.
An open issue that remains is the frequency of occurrence. Therefore, an attempt was made to quantify the number of auto-generation events within the present measurement domain in space and time. The first step was to detect ejection events in the plane
 $y^{+}=41$
, which (i) were of strength
 $u^{+}v^{+}<-3$
and (ii) were located between 100 and 150 wall units downstream of a sweep event in the plane
 $y^{+}=79$
. This sweep was also required to be of strength
 $u^{+}v^{+}<-3$
. The detection criteria were based on the above examples of auto-generation (figures 10 and 12), which showed a near-wall ejection and an incoming sweep at a larger wall-normal distance prior to auto-generation. The thresholds on the instantaneous Reynolds shear stress associated with the ejection and the sweep, i.e.
 $u^{+}v^{+}<-3$
, were considerably lower than their peak values in the examples of figures 10 and 12. The threshold, therefore, was not considered to be very restrictive. This first step in the detection yielded 61 unique event candidates, which were considered for visual inspection in the next step. The visualizations used were of the isosurface of swirling strength (
 $0.067u_{{\it\tau}}^{2}/{\it\nu}$
) similar to those shown in figure 10. An auto-generation event was said to be detected when a new hairpin vortex was seen to form upstream of an existing hairpin vortex. The leg (or legs) of the new hairpin could be part of an existing streamwise vortex or the leg of another hairpin vortex, but at least the head and the necks of the hairpin should be newly formed. This scenario is consistent with the descriptions of auto-generation in the literature (Zhou et al.
Reference Zhou, Adrian, Balachandar and Kendall1999; Kim et al.
Reference Kim, Sung and Adrian2008; Goudar et al.
Reference Goudar, Breugem and Elsinga2016) and the present observations (figures 10 and 12). Note that the term ‘hairpin vortex’ includes asymmetric arches and canes, which can also auto-generate (Zhou et al.
Reference Zhou, Adrian, Balachandar and Kendall1999). Out of the 61 event candidates, 12 cases (20 %) showed auto-generation of a new hairpin vortex and another 21 cases (34 %) showed an existing hairpin or packet growing in size or strength. The latter again suggests similarities between (rapidly) growing ejection events associated with a developing hairpin structure and the auto-generation mechanism as already pointed out. These results should be taken as indicative. As our understanding of the auto-generation mechanism improves, we anticipate more refined detection methods, hence more precise estimates of the rate of occurrence in the future.
To offer a perspective on the mentioned rate of occurrence, we perform a comparison with the regeneration cycle associated with the near-wall streaks and the streamwise vortices. Hamilton, Kim & Waleffe (Reference Hamilton, Kim and Waleffe1995) found that the period of the regeneration cycle is of the order of
 $270{\it\nu}/u_{{\it\tau}}^{2}$
. Their computational box containing one streak was 140 wall units wide in the spanwise direction. In the present case, the measurement domain spans
 ${\sim}$
600 wall units in the spanwise direction, which means that on average 4.3 such streaks are in view (assuming a streak covers the full streamwise extent of the measurement domain). The present integrated observation time is 7.37 s corresponding to
 $885{\it\nu}/u_{{\it\tau}}^{2}$
(§ 2.2). Given the number of streaks per volume and the total observation time, the corresponding number of regeneration cycles is estimated at approximately 14. Note that the limited observation time of individual flow structures in the experiment does not allow full cycles to be captured, so only short fragments of a regeneration cycle may be observed, but these fragments add up to 14 full cycles. A similar number of hairpin auto-generation events were observed, as explained above. This tentatively suggests that both mechanisms are of similar importance in terms of their occurrence.
6 Conclusions
Time-resolved tomographic PIV measurements were performed in the wall region,
 $6<y^{+}<140$
, of a turbulent boundary layer at
 $Re_{{\it\theta}}=2038$
. The spatial and the temporal resolution were sufficient in order to capture the vortices and observe their dynamics. Instantaneous visualizations revealed the near-wall low-speed streaks with the associated staggered arrangement of quasi-streamwise vortices, as expected. Hairpin-type vortices were observed throughout the measurement volume, also in the region below
 $y^{+}=60$
.
The evolution of a hairpin packet was shown in detail. The packet developed from quasi-streamwise vortices on either side of a low-speed streak, upstream of an existing cane vortex. The two hairpin heads initially started as branches on the quasi-streamwise vortex, which increased in length and eventually connected to the quasi-streamwise vortex on the other side of the streak, thereby creating hairpins. The downstream hairpin in particular experienced a subsequent growth in the wall-normal direction. As this hairpin grew, the remaining quasi-streamwise vortices downstream of its head were lifted from the wall and became so-called tongues. Tongues are nearly streamwise vortices attached to the head of the tallest hairpin in a packet (Zhou et al. Reference Zhou, Adrian, Balachandar and Kendall1999). The present observations offer some first insights into their origin.
A hairpin packet was shown to auto-generate a new hairpin vortex in two different examples. The heads of the new hairpins were located at approximately 30 wall units distance from the wall and upstream of the existing packet. In both cases the auto-generation was preceded by a sweep event approaching the packet. The high-velocity flow associated with the sweep distorted the shear layer upstream of the packet, causing the shear layer to roll up. This roll-up resulted in a spanwise vortex element, which quickly developed into a hairpin. The observed scenario of shear layer roll-up under the influence of incoming high-velocity flow is consistent with the auto-generation mechanism described by Goudar et al. (Reference Goudar, Breugem and Elsinga2016), which was based on numerical simulations of conditional eddies in laminar flow (albeit with a turbulent mean velocity profile) and built on the work of Zhou et al. (Reference Zhou, Adrian, Balachandar and Kendall1999) to include influences of the environment of the initial hairpin. The time scale associated with the present auto-generation events is (20–30)
 ${\it\nu}/u_{{\it\tau}}^{2}$
.
The present experimental observations thus prove that new hairpin vortices are generated within the near-wall region of a fully developed and unperturbed turbulent boundary layer. Additionally, hairpin auto-generation appears to be a fast process with short time scales. This means that a hairpin within the turbulent boundary layer may have been created just 200 wall units distance upstream of the point of observation. A hairpin, therefore, is not necessarily a remnant of the transition process far upstream, as has been suggested in the past. The fact that an entire hairpin packet structure was seen to develop from quasi-streamwise vortices (figure 10 a–d) further strengthens the idea that a hairpin is not a transitional flow structure. We may expect the hairpin vortex to remain a relevant structure in the near-wall region even at higher Reynolds numbers.
Acknowledgements
The authors gratefully acknowledge Professor J. Westerweel for his valuable support of the research visit of Y.J. and Mr E. Overmars for his assistance in the experiment. This work was partially supported by a grant, ‘Fellowships for Research Abroad’ by the Institute of National Colleges of Technology, Japan.
Supplementary movies
Supplementary movies are available online at http://dx.doi.org/10.1017/jfm.2016.153.



