People are famously poor at judging their own ability, engaging in such behaviours as “errors of omission”, “flawed self-assessment”, and “faulty self-awareness” (Carter & Dunning, Reference Carter and Dunning2008). It is an established finding that people's self-assessment and objective measures of performance relate poorly if at all. Meager or non-existing links between self- and other-assessments seem to be evident in all aspects of human behaviour, from sports, to health, to education, to the workplace (Dunning, Heath & Suls, Reference Dunning, Heath and Suls2004; Falchikov & Boud, Reference Falchikov and Boud1989; Harris & Schaubroek, Reference Harris and Schaubroek1988). In fact, across different skill sets, mean correlations between expected and observed performance fluctuate around .29, with correlations in sports being the highest and in the social domain, such as interpersonal skills, the lowest (Mabe & West, Reference Mabe and West1982).
The relationship between self- and other-assessment is important. At the conceptual level, it reflects one aspect of human metacognition, namely, the ability to evaluate both one's own and other people's competence across domains (Klin, Guzman & Levine, Reference Klin, Guzman and Levine1997; Lichtenstein & Fischoff, Reference Lichtenstein and Fischoff1977). And at the practical level, being able to adequately judge one's performance is linked to real-world decision-making, with inaccurate self-assessments leading people to engage in potentially dangerous, skill-inappropriate behaviours (e.g., poor drivers attempting to drive in adverse weather conditions, executives taking untenable financial risks) or to abstain from beneficial experiences (e.g., students dropping skill-appropriate courses).
Although the body of literature on self-assessment is wide-ranging, it is far from complete. One notable absence is research targeting second language (L2) pronunciation, which refers here to the linguistic characteristics underlying listener-based global constructs such as accentedness (nativelikeness) and comprehensibility (ease of understanding) in L2 speech.Footnote 1 Apart from a handful of studies (e.g., Dlaska & Krekeler, Reference Dlaska and Krekeler2008), it is unknown whether L2 speakers might misjudge their pronunciation (i.e., with respect to accentedness or comprehensibility), relative to the judgment of others, or what linguistic variables might underlie such assessment. Understanding the link between self- and other-assessment of L2 pronunciation is essential, given the importance of international trade and education, combined with the ever-growing interest in global popular culture and social media. These factors underscore the need for speakers to achieve communicative success in multiple languages, especially in pronunciation. This is because listeners differ in their tolerance for foreign accent (Moyer, Reference Moyer2013) and because comprehensibility is essential for efficiently communicating with an interlocutor (Isaacs & Trofimovich, Reference Isaacs and Trofimovich2012). If L2 speakers hold distorted views of their own pronunciation abilities, attaining communicative success will be problematic at best. Therefore, the goal of this study was to determine if there is a gap between self- and other-assessment of L2 speakers’ pronunciation skills and to examine what linguistic factors might underlie this mismatch.
Dunning-Kruger effect
When people compare their own ability and performance to those of others, a common finding is that more than half will judge themselves to be better than average, and those with poorer ability will be more likely to overestimate it than those with better skills (Carter & Dunning, Reference Carter and Dunning2008; Dunning et al., Reference Dunning, Heath and Suls2004). That poor performers tend to misjudge their ability has come to be known as the Dunning-Kruger effect (Dunning, Johnson, Ehrlinger & Kruger, Reference Anderson-Hsieh, Johnson and Koehler2003; Kruger & Dunning, Reference Kruger and Dunning1999). This effect is chiefly attributed to the information deficit faced by people at a lower level of skill. Poor performers suffer from a double ‘curse’: not only are they poor at a particular skill, such as math or driving, but inadequate skill also prevents them from accurately evaluating their own competence. Put simply, compared to skilled performers, unskilled ones tend to overrate themselves because they are unaware of their incompetence. For instance, college students scoring in the bottom quartile on a psychology exam overestimate their score by about 30%, compared to the students in the top quartile whose self-assessment is more closely calibrated with their scores (Kruger & Dunning, Reference Kruger and Dunning1999). This effect emerges even when people are promised money for accurate self-assessment, when they receive feedback about their performance, or when poor performers are given the chance to familiarize themselves with the performance of peers (Ehrlinger, Johnson, Banner, Dunning & Kruger, Reference Ehrlinger, Johnson, Banner, Dunning and Kruger2008; Mattern, Burrus & Shaw, Reference Mattern, Burrus and Shaw2010; Simons, Reference Simons2013; Sinkavich, Reference Sinkavich1995).
People's self-assessment also depends on a specific domain in which they evaluate themselves, with self-assessment in ill-defined, fuzzy, or highly subjective domains, such as intelligence, sophistication, or idealism, being more inflated than in more specific domains like neatness or punctuality (Burson, Larrick & Klayman, Reference Burson, Larrick and Klayman2006; Dunning, Meyerowitz & Holzberg, Reference Dunning, Meyerowitz and Holzberg1989; Hayes & Dunning, Reference Hayes and Dunning1997). Inaccurate self-assessment is also thought to be due to missing, ambiguous, or biased feedback which does not allow people to get accurate impressions of themselves. For instance, positive feedback is often rare (Dunning, Reference Dunning2005), such that people frequently do not know that they are performing well. Negative feedback is commonly worded to protect people's feelings and egos, with the consequence that it provides little concrete evidence to shape future behavior (Tesser & Rosen, Reference Tesser, Rosen and Berkowitz1975).
And it is not only poor performers that are prone to inaccurate self-assessment. Unlike poor performers, who overestimate their expertise, top performers tend to be overly modest, underestimating their ability relative to the perception of others (Ehrlinger et al., Reference Ehrlinger, Johnson, Banner, Dunning and Kruger2008; Kruger & Dunning, Reference Kruger and Dunning1999). The source of this error in self-judgment is likely not the lack of skill but rather attribution of success to others (Fussell & Krauss, Reference Fussell and Krauss1992), although top performers’ negative self-assessment appears to be easy to correct by showing them the performance of peers (Hodges, Regehr & Martin, Reference Hodges, Regehr and Martin2001; Kruger & Dunning, Reference Kruger and Dunning1999). Nonetheless, as with overinflated self-assessment by poor performers, top performers’ underestimated self-assessment may have behavioral consequences. For instance, people who feel that they perform worse than they actually do on a quiz of scientific reasoning tend to decline a future invitation to participate in a science competition (Ehrlinger & Dunning, Reference Ehrlinger and Dunning2003). In sum, for both unskilled and skilled performers, perceptions – rather than reality – may determine decision-making.
Self-assessment in L2 pronunciation research
The construct of self-assessment has had a substantial presence in the field of L2 learning and assessment (see Upshur, Reference Upshur, Palmer and Spolsky1975), with research focusing on self-assessment in test validation (e.g., Weigle, Reference Weigle2010), as an awareness-raising tool (e.g., Glover, Reference Glover2011), as predictor of learners’ in-class participation (e.g., de Saint Léger, Reference de Saint Léger2009), and a key element in learner-centered learning and teaching (e.g., Little, Reference Little2005). In addition, self-assessment has been seen as integral to the L2 proficiency construct, with self-assessment used as diagnostic feedback on reading, writing, and listening to complement test-takers’ actual test performance, for instance, in the DIALANG diagnostic tests assessing proficiency in 14 European languages (Alderson, Reference Alderson2005). In L2 literature, findings in line with the Dunning-Kruger effect have also been reported, with low correlations between self- and other-assessed skills (e.g., Blanche & Merino, Reference Blanche and Merino1989; Brantmeier, Vanderplank & Strube, Reference Brantmeier, Vanderplank and Strube2012; Ross, Reference Ross1998). And language assessment specialists have frequently noted, again consistent with the Dunning-Kruger effect, that learners at a lower level of ability overestimate their L2 performance (Davidson & Henning, Reference Davidson and Henning1985; Janssen van Dieten, Reference Janssen van Dieten1989) while higher-ability learners underestimate it (Heilenman, Reference Heilenman1990).
However, one L2 skill set that is mostly missing from this literature is pronunciation. Pronunciation, which encompasses dimensions associated with linguistic attributes of spoken language (e.g., prosody, segmental accuracy), is arguably one of the hardest skills to acquire. Adult L2 speakers rarely sound nativelike, with accented L2 speech generally seen as normal and often unavoidable, even for early bilinguals (Flege, Munro & MacKay, Reference Flege, Munro and MacKay1995). Despite this, many learners view the linguistic ability of a native speaker, characterized by near-native accent, as their ideal ultimate learning goal (Tokumoto & Shibata, Reference Tokumoto and Shibata2011). At the same time, many learners, while perhaps aware that they have difficulties with pronunciation, might be unable to identify their specific linguistic problems because learners lack diagnostic abilities or metalinguistic knowledge to articulate them, particularly at lower ability levels (Derwing & Rossiter, Reference Derwing and Rossiter2002). Pronunciation is rarely targeted in communicative L2 classrooms. For instance, in a classroom-based study by Foote, Trofimovich, Collins and Soler Urzúa (Reference Foote, Trofimovich, Collins and Soler Urzúa2013), a focus on pronunciation accounted for about 10% of all language-related episodes. Similarly, teachers may also provide only limited types of feedback targeting pronunciation, mainly in the form of implicit error correction such as recasting (Lyster, Reference Lyster2001), with the consequence that learners may not recognize feedback as such, particularly at lower proficiency levels (Ammar & Spada, Reference Ammar and Spada2006), or may not benefit from feedback due to learners’ lack of experience in pronunciation training and relevant linguistic knowledge (Saito, Reference Saito2013). Finally, pronunciation difficulties are highly context-dependent, with particular difficulties linked to speakers’ linguistic backgrounds and also to listener characteristics, such as being native or non-native interlocutors (Smiljanic & Bradlow, Reference Smiljanic and Bradlow2009). L2 pronunciation thus represents an ill-defined and highly complex skill with often missing or ambiguous feedback. As such, L2 speakers would likely be susceptible to faulty self-assessment.
However, with respect to L2 pronunciation, there is limited evidence about discrepancies in self- and other-assessment and the linguistic dimensions which underlie these discrepancies. For example, Yule and his colleagues examined the accuracy of L2 English learners’ segmental perception (e.g., cloud vs. crowd) and their confidence ratings about their accuracy on two occasions separated by seven weeks (Yule, Damico & Hoffman, Reference Yule, Damico and Hoffman1987; Yule, Hoffman & Damico, Reference Yule, Hoffman and Damico1987). Little relationship was observed between learners’ self-confidence of perception accuracy and their actual accuracy, with some learners improving only in self-confidence but others only in perception accuracy. More recently, focusing on the production of German vowels and consonants, Dlaska and Krekeler (Reference Dlaska and Krekeler2008) asked advanced learners of German to compare their own production of vowels and consonants to native-speaker models. Whereas the learners and two trained listeners mostly agreed on which sounds were produced accurately, the learners were able to identify only 44% of their vowel and consonant errors, revealing a gap between self- and other-assessment of segmental production. In sum, existing evidence suggests that L2 speakers’ self-assessment is misaligned with their actual performance, yet it is unclear to what extent L2 speakers are over- or under-confident in their self-judgment or which aspects of speech, apart from segmentals, are subject to distorted self-assessment.
The current study
With the goal of clarifying the relationship between self- and other-assessment of L2 pronunciation, the current study targeted L2 speakers from multiple language backgrounds whose speech, recorded in an extemporaneous speaking task, was rated by the speakers themselves and also by native-speaking listeners for two constructs (accent, comprehensibility). Of primary interest was a potential discrepancy between speakers’ own and native-speaking listeners’ assessment (Dunning-Kruger effect). However, besides exploring this effect in the domain of L2 pronunciation, which (as argued previously) represents a complex and ill-defined skill with frequently missing or ambiguous feedback, this study also aimed to examine which linguistic aspects of L2 speech might be linked to inaccuracies in L2 speakers’ self-assessment. These aspects included a wide range of linguistic factors that feed into overall conceptions of L2 performance as reflected in rating scales, including segmental and suprasegmental accuracy, temporal fluency, lexical appropriateness and richness, grammatical accuracy and complexity, as well as discourse structure.
To address these goals, this study focused on two broad constructs of L2 pronunciation: accentedness and comprehensibility. Accentedness (a measure of linguistic nativelikeness) refers to listeners’ perceptions of how closely speakers can approximate speech patterns of the target-language community, while comprehensibility (a broad measure of speakers’ communicative effectiveness) is defined as listeners’ perceptions of how easily they can understand L2 speech. Accentedness and comprehensibility are overlapping yet distinct constructs, as illustrated by the finding that even some heavily accented L2 speech can be highly comprehensible (Derwing & Munro, Reference Derwing and Munro2009). These two dimensions are particularly relevant to investigating self-assessment because they represent two common learning and teaching goals (Levis, Reference Levis2005), namely, a focus on nativelikeness (accent reduction) and a focus on understanding (comprehensibility).
This study thus investigated the relationship between self- and other-assessment of L2 speakers’ accent and comprehensibility through two experiments, addressing two questions. The question targeted in Experiment 1 was “Do L2 speakers demonstrate a discrepancy between their own and native-speaking listeners’ assessment of accentedness and comprehensibility in L2 speech?” The question targeted in Experiment 2 was “Which linguistic characteristics of L2 speech (including segmental and suprasegmental accuracy, temporal fluency, lexical appropriateness and richness, grammatical accuracy and complexity, and discourse structure) are most susceptible to discrepancies between self- and other-assessment of accentedness and comprehensibility in L2 speech?” The overall goal of both experiments was to expand the study of self-assessment behavior in the field of L2 speech learning, to better understand the linguistic dimensions that feed into L2 speakers’ awareness of accentedness and comprehensibility.
Experiment 1
Experiment 1 targeted the relationship between self- and other-assessment of L2 speech for a large sample of L2 speakers (n = 134) from multiple language backgrounds, with the goal of documenting how closely L2 speakers’ judgments of accent and comprehensibility relate to native-speaking listeners’ assessment of the same constructs. Consistent with previous research in the domains of social and cognitive psychology (e.g., Carter & Dunning, Reference Carter and Dunning2008) and L2 learning and assessment (e.g., Dlaska & Krekeler, Reference Dlaska and Krekeler2008), it was predicted that L2 speakers would show discrepancies in their self-assessment, relative to the rating by native-speaking listeners, with speakers judged as most accented and least comprehensible overestimating their ability and speakers at the opposite end underestimating their ability.
Participants
The participants in Experiment 1 were 134 speakers (31 female, 103 male) with a mean age of 23.9 years (SD = 3.2) from an unpublished corpus of L2 speech by speakers from 19 language backgrounds completing five tasks (Isaacs & Trofimovich, Reference Isaacs and Trofimovich2011). The language groups represented in the corpus included speakers of Farsi (33), Chinese (14), Telugu (13), Hindi (12), Bengali (9), Tamil, French (8 each), Punjabi, Arabic (7 each), Spanish (7), Gujarati (4), Urdu (3), Greek, Marathi (2 each), as well as Akan, Kannada, Kinyarwanda, Malayalam, and Portuguese (1 each). The speakers, who were international students in undergraduate (25) and graduate (109) programs at an English-medium Canadian university, had studied English on average 21.5 years (SD = 5.7), primarily through formal instruction in primary, secondary, and university-level settings. They had arrived in Canada to pursue studies at a mean age of 23.3 years (SD = 3.8) and participated in the experiment during the first term of university studies, which usually started soon after their arrival in Canada. All speakers had recently taken either TOEFL iBT or IELTS tests, which are high-stakes instruments that were used to assess the participants’ ability to pursue university studies (see Chalhoub-Deville & Turner, Reference Chalhoub-Deville and Turner2000). The participants’ mean overall scores were 88.8 (SD = 9.6) for TOEFL iBT and 6.9 (SD = .6) for IELTS. The speakers self-rated their English ability at a mean of 6.6 (SD = 1.1) in speaking and 7.3 (SD = 1.3) in listening using 9-point Likert-type scales (1 = extremely poor, 9 = extremely fluent). Using 0–100% scales (0% = never, 100% = all the time), they also estimated their daily use of English at 61.6% (SD = 22.9) in speaking and at 70.1% (SD = 20.5) in listening. The speakers indicated that they used English at the university on average 76.6% daily (SD = 23.5).
Materials and procedure
As part of the original corpus, each speaker completed five speaking tasks administered in a randomized order, but only the picture story task, one of the most common tasks used to elicit L2 speech (e.g., Derwing, Rossiter, Munro & Thomson, Reference Derwing, Rossiter, Munro and Thomson2004; Trofimovich & Isaacs, Reference Trofimovich and Isaacs2012), was chosen for analysis in this study. The task consisted of an eight-frame colored picture narrative depicting a man and a woman who collided with each other on a busy street corner, accidentally switched their identical suitcases, and finally realized their error after arriving in their respective destinations (Derwing et al., Reference Derwing, Rossiter, Munro and Thomson2004). The speakers were first shown the picture sequence and were instructed to describe the story by explaining what happened in each image, with no time limit imposed. The narratives were recorded directly onto a computer and stored as digital audio files. After completing the task, the speakers were asked to use a 9-point scale to indicate how well they performed it (1 = very poorly, 9 = very well) and to estimate overall task difficulty (1 = very easy, 9 = very difficult), in that order. They were subsequently instructed to self-rate their accent, which refers to the extent of native language (L1) influences in their speech (1 = heavily accented, 9 = not accented at all), and comprehensibility, which denotes presumed listener effort in understanding their speech during the task (1 = hard to understand, 9 = easy to understand).
The audio files were subsequently normalized by matching peak amplitude across files, then presented to listeners. The listeners were three native English speakers (all females), with a mean age of 41.7 (SD = 8.1) and 10 years (SD = 0) of L2 teaching experience. They had been educated entirely in English, holding advanced degrees in applied linguistics or language teaching and completing at least one course on applied phonetics and pronunciation teaching. They reported using English daily on average 86.7% of the time (SD = 5.8) in speaking and 90% of the time (SD = 0) in listening, and reported extensive exposure to L2 English and some proficiency in another language (French, German, Japanese, Swahili). The listeners individually evaluated the 134 audio files, which were on average 68.3s long (SD = 30.3), rating each file for the same two dimensions, namely, accent (1 = heavily accented, 9 = not accented at all) and comprehensibility (1 = hard to understand, 9 = easy to understand). The listeners, who used a personal computer for audio playback, were first given definitions of each rated construct and invited to discuss any questions. They then received a rating booklet and rated three practice files. The listeners worked at their own pace, playing each consecutive file and recording their ratings in the booklet, with an unlimited number of replays permitted. Although they were not required to play the entire file to make decisions, all listeners listened to at least 20–30s of speech in each recording, which is consistent with 15–30s samples used to obtain listeners’ impressionistic ratings of speech in prior research (e.g., Derwing et al., Reference Derwing, Rossiter, Munro and Thomson2004).
Analysis
Cronbach's alpha, a measure of rater consistency, was computed first across the three listeners’ ratings, separately for accent and comprehensibility. The obtained coefficients were reasonably high (Stemler & Tsai, Reference Stemler, Tsai and Osborne2008), particularly given the small sample size (.89 for accent and .79 for comprehensibility), exceeding the benchmark value of .70–.80 (Larson-Hall, Reference Larson-Hall2010). Therefore, a single accent and comprehensibility score was derived for each speaker by averaging across the three listeners’ judgments. The measure of primary interest was speakers’ overconfidence scores in accent and comprehensibility. Overconfidence scores were derived by subtracting the mean rating for each speaker from the speaker's self-rating and then expressing the obtained numerical difference as a proportion on a 9-point scale. Numerical differences which were positive corresponded to speakers overestimating their accent (nativelikeness) or comprehensibility (ease of understanding), relative to native-speaking listeners, while negative numerical differences represented speakers underestimating their accent or comprehensibility. Values around zero indicated self-ratings that were calibrated or aligned with listener judgments. The extent of the difference between self- and other-ratings was illustrated by the magnitude of the proportion.
Results and discussion
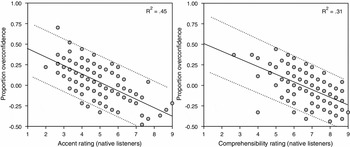
The first set of analyses examined the overall relationship between the L2 speakers’ actual performance (as rated by native listeners) and their self-ratings. Pearson correlation tests (two-tailed) revealed no association between the speakers’ actual and self-rated scores for accent, r(132) = .06, p = .50, and only a weak association for comprehensibility, r(132) = .18, p = .03, suggesting that the relationship between actual and self-rated performance was tenuous at best. However, consistent with the Dunning-Kruger effect, there were moderate-to-strong associations between speakers’ overconfidence scores and their actual performance, both for accent, r(132) = −.67, p < .0001, and comprehensibility, r(132) = −.56, p < .0001. In both cases, the associations (illustrated in Figure 1) were negative, indicating that more accented and less comprehensible speech was associated with greater overconfidence scores. This suggests that the speakers who were rated by native-speaking listeners as most accented and least comprehensible were those whose self-ratings of accent and comprehensibility were most inflated, compared to listener ratings. Both associations were also comparable in their strength, as was shown by Fisher r-to-z transformations conducted to explore statistical differences in correlation coefficient strength, Z = 1.57, p = .12.
Associations between L2 speakers’ (n = 134) overconfidence scores and their actual performance (as rated by native-speaking listeners) for accent (1 = heavily accented, 9 = not accented at all, left panel) and comprehensibility (1 = hard to understand, 9 = easy to understand, right panel), with regression lines showing the best fit to the data. Dotted lines designate 95% confidence intervals for linear regression.

To further qualify the relationships shown in Figure 1, the overconfidence scores for the bottom and top thirds of the speakers (n = 45) were then compared, separately for accent and comprehensibility. For accent, the bottom third of the speakers was significantly more overconfident (M = .27 or +2.4 points on a 9-point scale) than the top third (M = −.19 or −1.7 points), t(88) = 19.39, p < .001, Cohen's d (effect size) = 5.40, who were underconfident. For comprehensibility, although overconfidence scores generally clustered around the upper range of the scale (see Figure 1), the bottom third of the speakers was again significantly more overconfident (M = .18 or +1.6 points on a 9-point scale) than the top third (M = −.23 or −2 points), t(88) = 19.13, p < .001, d = 10.52, who again underestimated their performance. To sum up, the speakers’ self-ratings related little to their actual performance, as rated by native-speaking listeners. Instead, the speakers tended to either over- or underestimate their performance. Put differently, speakers at the bottom of the accent and comprehensibility scale overestimated their performance while speakers at the top of each scale underestimated it.
The next analysis examined how various speaker characteristics related to their overconfidence scores. These characteristics included background profiles collected in a participant questionnaire, as well as the speakers’ self-ratings of task difficulty and task performance success. With respect to interlocutor background characteristics, such as age, amount of prior English study, self-rated speaking and listening ability, age of first exposure to English, amount of daily English use, or TOEFL and IELTS test scores or listening and speaking subscores, there were no significant associations between any of these characteristics and overconfidence scores, r < .15, p > .07. Speakers’ overconfidence scores also showed no significant associations with their own ratings of how well they performed each task and how they estimated overall task difficulty, r < .08, p > .37. In sum, speakers’ background characteristics or their perception of task success and task difficulty bore no obvious relationship to the extent of overconfidence they demonstrated in judging their own accent and comprehensibility.
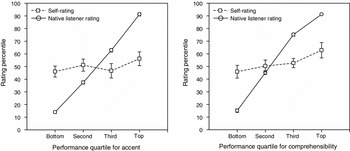
The final analysis sought to ascertain that the obtained pattern of findings was not specific to the particular measure of overconfidence used, namely, a numerical difference between self- and listener-based ratings expressed as a proportion on a 9-point ordinal scale. In line with previous psychological research on self-assessment (e.g., Burson et al., Reference Burson, Larrick and Klayman2006; Kruger & Dunning, Reference Kruger and Dunning1999), rated accent and comprehensibility values were first rank-ordered and then expressed as percentile scores by subtracting listener-rated performance from speakers’ own estimates to derive a percentile-based measure of overconfidence. The resulting overconfidence scores matched closely the original measure of overconfidence for both accent, r(132) = .98, p < .0001, and comprehensibility, r(132) = .96, p < .0001, and the pattern of findings obtained with this new measure was identical to the one reported previously. The relationship between percentile-based measures of the speakers’ actual and self-rated performance is illustrated in Figure 2, which shows speakers’ perceived percentile rankings (self-rating, shown by a dashed line) and their actual test performance (listener rating, shown by a solid line) plotted separately for four speaker groups based on listener-rated performance quartile (bottom to top 25%).
L2 speakers’ (n = 134) percentile rankings for self- and listener-ratings of accent (left panel) and comprehensibility (right panel) as a function of listener-rated performance quartile (bottom to top 25%). Error bars enclose ±1SE.

As Figure 2 shows, the speakers who were rated by listeners in the bottom 25% of the sample overestimated their performance (self-rating higher than listener rating), while the speakers rated by listeners in the top 25% underestimated it (self-rating lower than listener rating). In fact, self-rating and actual performance were aligned only for speakers performing around the 50th percentile in accent and comprehensibility, which roughly corresponded to a rating of 4.8 for accent and 6.7 for comprehensibility on a 9-point scale. To sum up, L2 speakers showed discrepancies in judgments of their accentedness and comprehensibility compared to judgments by native-speaking listeners, with speakers at the bottom of each scale overestimating their performance and speakers at the top of each scale underestimating it by a similar degree. Notably, none of the speakers’ language background characteristics nor their ratings of task difficulty and task success could explain the extent of discrepancy between the speakers’ self-rated and actual performance.
Experiment 2
As predicted, Experiment 1 revealed discrepancies in L2 speakers’ self-assessment, relative to listeners’ rating, with those speakers who were rated most accented and least comprehensible overestimating their ability and speakers who were rated at the higher end of the ability continuum underestimating their ability. However, the extent of L2 speakers’ over- or under-confident behavior was unrelated to their language background characteristics or their ratings of task difficulty and task success. Therefore, Experiment 2 targeted the relationship between self- and other-assessment of L2 speech in more detail, for a smaller cohort of the original speakers (n = 56), by analyzing the speakers’ speech for 10 linguistic categories from the linguistic categories of segmental and suprasegmental accuracy, fluency, lexical and grammatical appropriateness and richness, and discourse structure. The goal of Experiment 2 was therefore to determine which linguistic categories in L2 speech are most susceptible to discrepancies between self- and other-assessment of accentedness and comprehensibility. Based on limited previous research targeting segmental aspects of L2 speech perception and production (Dlaska & Krekeler, Reference Dlaska and Krekeler2008; Yule et al., Reference Yule, Damico and Hoffman1987), it was predicted that L2 speakers would be especially prone to misjudging their segmental production accuracy. However, given a strong link between accent and segmental and suprasegmental accuracy and fluency as well as between comprehensibility and lexis, grammar, and discourse (Crowther, Trofimovich, Saito & Isaacs, Reference Crowther, Trofimovich, Saito and Isaacs2014; Trofimovich & Isaacs, Reference Trofimovich and Isaacs2012), it was also expected that speakers’ self-assessments might be linked to other aspects of L2 speech, besides segmentals.
Participants
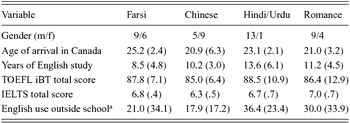
The participants in Experiment 2 included 60 speakers drawn from the sample of 134 participants in Experiment 1. The speakers were selected based on their L1 background and represented the largest cohorts in the corpus, yielding groups of Farsi, Mandarin Chinese, Hindi/Urdu, and Romance speakers (n = 15). L1 background was used as a grouping variable to isolate possible L1 influences on speakers’ self-assessment, since linguistic dimensions of L2 speech are known to be L1-specific (e.g., Flege, Reference Flege, Meyer and Schiller2003). The Hindi/Urdu group combined the speakers of both languages because the key difference between them is script-based (King, Reference King1994), and the Romance group included all speakers of French and Spanish, which share a common language family and a similar syllable-timed rhythm (Jun, Reference Jun and Jun2005). However, the data for four speakers were lost due to error, leaving altogether 56 speakers, with a nearly-equal distribution of speakers per group: Farsi (n = 15), Chinese (n = 14), Hindi/Urdu (n = 14), and Romance (n = 13), with eight French and five Spanish speakers. The speakers were matched as closely as possible across the four groups based on background characteristics (shown in Table 1), with the exception of male/female ratio in the Hindi/Urdu group, which mirrored the gender makeup of these speakers in the university. According to one-way ANOVAs, there were no significant between-group differences in any of the scores shown in Table 1, Fs < 2.65, p > .06, except age of arrival, F(3, 52) = 3.99, p = .012, ηp 2 = .19, with the Farsi group being slightly older than the Chinese (p = .03) and the Romance (p = .04) groups at the time of arrival in Canada.
Background characteristics (means and standard deviations) for speakers in Experiment 2

Note: aSelf-rating on a 0–100% scale.
Materials and Procedure
The 56 speakers’ audio recordings from the picture story task, along with written transcripts of each recording, were then presented to trained raters for linguistic coding using 10 rated categories targeting the dimensions of phonology, fluency, lexis, grammar, and discourse. The raters included 10 native English speakers (7 females, 3 males), with a mean age of 32.7 years (SD = 10.2) and an average of 6.6 years of L2 teaching experience (SD = 6.8). The raters were either recent graduates or current students in applied linguistics from the same university community as the speakers. They estimated using English a mean of 89% of the time (SD = 8.8) in speaking and 85% of the time (SD = 13.5) in listening, and reported extensive exposure to L2 English and some proficiency in another language (French, Spanish, Korean). The raters evaluated the 56 speakers’ performance in the picture story task in two individual rating sessions (about 2h each), conducted within three weeks. The first session was devoted to the coding of audio recordings for five phonology- and fluency-based categories, while the second session was dedicated to evaluating orthographic transcripts for five lexical, grammatical, and discourse categories (described below). Transcripts of recorded picture narratives (rather than audio recordings) were used in the second session in order to remove pronunciation and fluency as possible confounds in judgments of lexis, grammar, and discourse (Crossley, Salsbury & McNamara, Reference Crossley, Salsbury and McNamara2014).
In all rating sessions, the raters used computer-based scales developed by Saito, Trofimovich and Isaacs (forthcoming). For each rated measure, the scale featured a 1000-point continuous slider, run through the MATLAB interface, with endpoints clearly marked by a frowning face on the left (rating of 0) and a smiley face on the right (rating of 1000). The slider was initially fixed in the middle (rating of 500), with no numerical labels or marked intervals shown. At the start of each session, the raters were trained on the relevant rated categories (see Appendix) and were shown how to use the scale. Depending on the session, they then listened to four supplementary audio recordings or viewed four supplementary transcripts and rated them for practice by using the relevant scales, with each rating discussed to determine if the raters understood each rated category as intended. All audio recordings were edited to remove all fillers and false starts at the beginning of the file and were shortened to include only the initial 30s of speech, consistent with prior research using 20–60s samples to evaluate speech (e.g., Derwing et al., Reference Derwing, Rossiter, Munro and Thomson2004). To minimize phonology and fluency influences on rater judgments of lexis, grammar, and discourse (Crossley et al., Reference Crossley, Salsbury and McNamara2014) and to avoid any transcriber influence (Ochs, Reference Ochs, Orchs and Schieffelin1979), all orthographic transcripts of the speakers’ task performance were modified to remove hesitation markers (e.g., um, uh), spelling clues signaling phonology-specific errors (e.g., three pronounced as tree was spelled as “three”), and punctuation. All relevant scales (i.e., five categories for audio or transcript rating) were visible simultaneously, and the raters were allowed to adjust their judgments on all scales before proceeding to the next recording (or transcript). All audio recordings or transcripts (depending on the session) were presented to each rater in a unique randomized order, and the raters could replay each recording or reread each transcript as often as necessary.
Coded linguistic categories
Audio recordings
The raters evaluated each audio recording for the following five segmental, suprasegmental, and temporal categories (see Appendix for training materials and onscreen labels):
-
1. Segmental errors (1 = “frequent”, 1000 = “infrequent or absent”), defined as errors in the articulation of individual sounds within a word (e.g., dat instead of that; pin instead of pen), as well as any sounds erroneously deleted from or inserted into words (e.g.,’ouse instead of house; supray instead of spray).
-
2. Word stress errors (1 = “frequent”, 1000 = “infrequent or absent”), defined as errors in the placement of primary stress (e.g., com-pu-TER instead of com-PU-ter, where capitals designate stress) or the absence of discernible stress, such that all syllables receive equal prominence (e.g., com-pu-ter).
-
3. Intonation (1 = “unnatural”, 1000 = “natural”), defined as appropriate pitch moves that occur in native speech, such as rising tones in yes/no questions (e.g., Will you be home tomorrow↑) or falling tones at the end of statements (e.g., Yeah, I’ll stay at home↓).
-
4. Rhythm (1 = “unnatural”, 1000 = “natural”), defined as the difference in stress (emphasis) between content and function (grammatical) words. For instance, in the sentence “They RAN to the STORE”, the words “ran” and “store” are content words and therefore are stressed more than the words “they”, “to”, and “the”, which are grammatical words featuring reduced vowels.
-
5. Speech rate (1 = “too slow or too fast”, 1000 = “optimal”), defined as a speaker's overall pacing and the speed of utterance delivery.
Orthographic transcripts
The raters evaluated each orthographic transcript for the following five lexical, grammatical, and discourse categories (see Appendix for training materials and onscreen labels):
-
1. Lexical appropriateness (1 = “many inappropriate words used”, 1000 = “consistently uses appropriate vocabulary”), defined as the speaker's choice of words to accomplish the task. Poor lexical choices include incorrect, inappropriate, and non-English words (e.g., “A man and a woman bumped into each other on a walkside”).
-
2. Lexical richness (1 = “few, simple words used”, 1000 = “varied vocabulary”), defined as the sophistication of the vocabulary used by the speaker. Simple words with little variety correspond to poor lexical richness (e.g., “The girl arrived home her dog was happy she arrived home”, compared to “The girl arrived home to find her dog overjoyed at her return”).
-
3. Grammatical accuracy (1 = “poor grammar accuracy”, 1000 = “excellent grammar accuracy”), defined as the number of grammar errors made by the speaker. Examples included errors of word order (e.g., “What you are doing?”), morphology (e.g., “She go to school every day”), and agreement (e.g., “I will stay there for five day”).
-
4. Grammatical complexity (1 = “simple grammar”, 1000 = “elaborate grammar”), defined as the sophistication of the speaker's grammar. Grammatical complexity is low if the speaker uses simple, coordinated structures without embedded clauses or subordination (e.g., “The man wore a black hat and he enjoyed his coffee”, compared to “The man who was wearing a black hat was enjoying his coffee”).
-
5. Discourse richness (1 = “simple structure, few details”, 1000 = “detailed and sophisticated”), defined as the richness and sophistication of the utterance content. Discourse richness is low if the entire narrative is simple, unnuanced, bare, and lacks sophisticated ideas or details, but high if the speaker produces several distinct ideas or details so that the narrative sounds developed and sophisticated.
Analysis
Cronbach's alpha coefficients, computed to determine inter-rater reliability, showed that the raters were fairly consistent, demonstrating reliability values that surpassed benchmark values of .70–.80 (Larson-Hall, Reference Larson-Hall2010) for segmental and suprasegmental accuracy (a segmentals = .94; a word stress = .87; a intonation = .84; a rhythm = .86), fluency (a speech rate = .90), vocabulary (a appropriateness = .80; arichness = .86), grammar (a acccuracy = .82; acomplexity = .85), and discourse (arichness = .88). Considered sufficiently consistent, the scores were averaged across the 10 raters to obtain a single mean score per speaker for each rated category. The raters also appeared to have little difficulty understanding and applying the rated categories, as shown through their feedback at the end of each session. They had estimated the extent to which they understood the categories at 8.3 (SD = .5) on a 9-point scale (1 = I did not understand at all, 9 = I understand this concept well) and rated the degree to which they could comfortably and easily use them at 7.8 (SD = .9) on a similar scale (1 = very difficult, 9 = very easy and comfortable). Because the original measure of overconfidence from Experiment 1 – namely, an overconfidence score expressed as a proportion on a 9-point scale – shared a substantial amount of variance with a percentile-based measure (96% for accent, 92% for comprehensibility), it was decided to use this original measure as the dependent variable of interest in Experiment 2.
Results and Discussion
The first analysis was used for data reduction purposes to explore underlying patterns among the 10 rated linguistic categories in the speakers’ speech. The goal was to uncover possible common dimensions across the 10 rated linguistic categories, so that these dimensions could be related to the degree of speaker overconfidence in judging their own accent and comprehensibility, relative to listener ratings. First, the scores from the 10 linguistic categories for the entire set of 56 speakers were submitted to an exploratory Principal Component Analysis (PCA) with Oblimin rotation to determine if the categories showed any underlying patterns based on their clustering. Although the sample size was relatively small, the Kaiser-Meyer-Oklin value was .86, exceeding the required .60 for sampling adequacy and indicating excellent factorability of the correlation matrix (Hutcheson & Sofroniou, Reference Hutcheson and Sofroniou1999). Moreover, Bartlett's test of sphericity yielded a highly significant value, χ2 (45) = 653.92, p < .0001, suggesting that the correlations between the categories were sufficient for PCA.Footnote 2 The PCA yielded two factors accounting for 83.6% of total variance (shown in Table 2). Factor 1, labeled Phonology, consisted of the four segmental/suprasegmental categories and speech rate. Factor 2, named Lexicogrammar, comprised all vocabulary, grammar, and discourse-level categories, plus speech rate. In sum, the 10 linguistic categories patterned along two dimensions (phonology and lexicogrammar), with speech rate common to both. That a fluency variable would be linked to both phonology and lexicogrammar is unsurprising because fluent speech reflects efficient processing at multiple levels, including those of phonological encoding and articulation as well as lexical retrieval and grammatical assembly (see Segalowitz, Reference Segalowitz2010).
Summary of a two-factor solution based on a principal component analysis of the 10 rated linguistic variables

Note: All eigenvalues > 1.
The next analysis targeted possible contributions of the PCA phonology and lexicogrammar factors to speakers’ overconfidence. More specifically, the phonology and lexicogrammar PCA scores, computed through the Anderson-Rubin method of obtaining non-correlated factor scores (Field, Reference Field2009), were used as two predictor variables in a stepwise multiple regression analysis to examine the contribution of phonology and lexicogrammar to speakers’ overconfidence scores, separately for accent and comprehensibility. The two regression models (n = 56) yielded nearly identical findings (summarized in Table 3), with the phonology factor emerging as the only significant predictor of overconfidence scores, accounting for 28% of variance for accent and 27% for comprehensibility.Footnote 3 Thus, as indicated by negative beta values (reflecting negative associations between variables) in Table 3, the extent of speakers’ overconfidence was inversely related to their L2 phonology, with less nativelike segmental and suprasegmental accuracy and fluency linked to overestimated self-ratings of accent and comprehensibility, relative to listener ratings.
Results of multiple regression analyses using the factors of phonology and lexicogrammar as predictors of overconfidence scores in accent and comprehensibility

Note: The variables entered into the regression equation were the two factors obtained in the PCA reported in Table 2. However, because only the phonology factor emerged as a significant predictor, only this factor is listed in the table.
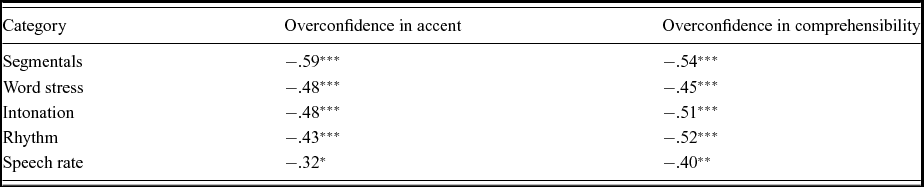
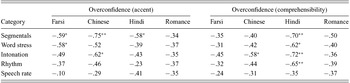
This obtained relationship between speakers’ overconfidence and their L2 speech is clarified further in Table 4, which shows individual Pearson correlations (two-tailed) between the speakers’ overconfidence scores and their scores for the five linguistic categories subsumed under the PCA phonology factor. Each of the five categories accounted for 10–35% of shared variance in speakers’ overconfidence in accent and 16–29% in their overconfidence in comprehensibility. In all cases, less accuracy in segmental production, in word stress, rhythm, and intonation, as well as non-optimal (too fast or slow) speech rate were associated with overestimated self-ratings of accent and comprehensibility, relative to native listener ratings.
Pearson correlations between the five phonology categories and overconfidence scores for accent and comprehensibility (n = 56)

Note: *p < .05, **p < .01, ***p < .001.
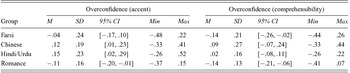
The final analyses targeted between-group differences in overconfidence, on the assumption that speakers’ self-assessment behaviours might be specific to their linguistic background. First, the overconfidence scores for the speakers in the four groups were submitted to one-way ANOVAs to determine if the extent of overconfidence varied as a function of the speakers’ L1. These analyses yielded significant F-ratios for both accent, F(3, 52) = 4.89, p = .005, ηp 2 = .22, and comprehensibility, F(3, 52) = 4.50, p = .007, ηp 2 = .21. For accent, Bonferroni-corrected post-hoc tests revealed that the Chinese (p = .039) and the Hindi/Urdu (p = .013) speakers’ overconfidence scores were significantly greater than those of the Romance speakers. For comprehensibility, the Chinese speakers’ overconfidence scores were again significantly greater than those of the Romance (p = .033) and the Farsi speakers (p = .021). This pattern of findings is best illustrated in Table 5, which shows descriptive statistics for each group. For accent, the Chinese (M = .12) and Hindi/Urdu (M = .15) speakers overall tended to overestimate their performance, compared to the Farsi speakers (M = −.04), whose overconfidence scores were close to 0 (i.e., aligned with listener assessment), and the Romance speakers (M = −.11), who underestimated their performance. For comprehensibility, the Chinese speakers (M = .09) as a group overestimated their performance, compared to the Hindi/Urdu speakers (M = .02), whose assessment was aligned with native listener assessment, and the Farsi (M = −.14) and Romance (M = −.14) speakers, who both underestimated their performance. Given a strong inverse relationship between overconfidence scores and actual performance, as shown in Experiment 1, these findings imply that the groups that were more accented (i.e., Chinese, Hindi/Urdu) and less comprehensible (i.e., Chinese), as rated by native-speaking listeners, are those that significantly overestimated their performance, compared to the other groups.Footnote 4
Descriptive statistics for overconfidence scores in accent and comprehensibility by L1 group

Because the confidence scores for each group ranged widely between negative (underestimated performance) and positive (overestimated performance) values (see Table 5), it was then possible to examine which linguistic categories were associated with overconfidence, separately for each group. Table 6 shows the results of Pearson correlations (two-tailed) between overconfidence scores for each group and their scores for the five linguistic categories subsumed under the PCA phonology factor. The obtained pattern of significant correlations, taken together with the results of between-group comparisons illustrated in Table 5, suggests two broad conclusions. Firstly, for both accent and comprehensibility, the link between speakers’ overconfidence and their segmental, suprasegmental, and fluency performance is strongest for groups with weaker actual performance (i.e., Chinese and Hindi/Urdu vs. Romance). For speakers rated lower in accent and comprehensibility (Chinese, Hindi/Urdu), segmental and suprasegmental accuracy and fluency likely feed into their inaccurate self-assessment. In contrast, for speakers at higher levels of accent and comprehensibility (Romance and Farsi, especially for comprehensibility), self-assessment is likely based on factors other than those targeted here.Footnote 5 And secondly, the specific segmental, suprasegmental, and fluency variables linked to overconfidence unsurprisingly appear to vary as a function of the speakers’ L1 background, such that speakers’ self-assessment is based on the variables that are likely most problematic for them, such as segmentals and intonation for Chinese speakers (Anderson-Hsieh, Johnson & Koehler, Reference Anderson-Hsieh, Johnson and Koehler1992) or suprasegmentals (word stress, rhythm, intonation) for Hindi/Urdu speakers (Shackle, Reference Shackle, Swan and Smith2001).
Pearson correlations between the five rated phonology categories and overconfidence scores for accent and comprehensibility by L1 group

Note: *p < .05, **p < .01.
General discussion
The two research questions of this study asked whether L2 speakers show discrepancies between their own and listeners’ assessment of accentedness and comprehensibility in their speech and which linguistic characteristics of L2 speech are linked to such discrepancies. In line with previous research on the Dunning-Kruger effect (Carter & Dunning, Reference Carter and Dunning2008) and research in L2 assessment and learning (Davidson & Henning, Reference Davidson and Henning1985), the L2 speakers in this study showed mostly inaccurate self-assessment of how accented and comprehensible they sounded, relative to the ratings of native speakers. Consistent with prior findings, speakers at the low end of the accentedness and comprehensibility scales tended to overestimate their performance, while speakers at the high end of each scale underestimated it. In fact, only about a third of all L2 speakers were fully calibrated with listeners in their self-assessment (37/134 or 28% for accent and 51/134 or 38% for comprehensibility), placing themselves within ±10% of listener ratings. For both accent and comprehensibility, discrepancies in self- versus other-assessment were associated with several segmental and suprasegmental dimensions of L2 speech (segmental accuracy, word stress, rhythm, intonation, speech rate) but not with aspects of lexis, grammar, and discourse. Generally, the L1 groups that showed weaker performance (Chinese) tended to rate themselves more overconfidently than higher-scoring groups (Romance, Farsi), and the specific linguistic aspects of L2 speech feeding into inaccurate self-assessment appeared to be L1-specific, such as segmentals and intonation for Chinese speakers. These findings extend literature on self-assessment in social, academic, and professional domains (Dunning et al., Reference Dunning, Heath and Suls2004; Mabe & West, Reference Mabe and West1982) by showing that L2 speakers’ rating of their accent and comprehensibility correspond only weakly to listeners’ judgment. Also, given the argument that pronunciation is a complex skill for L2 speakers, such discrepancies are in line with prior research illustrating larger gaps between self- and other-assessment in more complex, as compared to simpler, skills and tasks (Burson et al., Reference Burson, Larrick and Klayman2006; Hayes & Dunning, Reference Hayes and Dunning1997).
Inaccurate self-assessment
A weak relationship between self- and other-assessment of L2 speech has interesting consequences for L2 speech learning, particularly within interactionist approaches to L2 development. Underlying interactionist approaches (e.g., Long, Reference Long, Ritchie and Bhatia1996) is the idea that specific aspects of interaction – referred to broadly as negotiation for meaning – ultimately lead L2 users to notice the discrepancy (i.e., the gap) between the target language and their own understanding of it (Long, Reference Long, de Bot, Coste, Ginsberg and Kramsch1991; Schmidt, Reference Schmidt and Robinson2001), which in turn facilitates language development (for review, see Mackey & Goo, Reference Mackey, Goo and Mackey2007). Put simply, interaction-driven learning requires L2 users to notice similarities or differences between their own linguistic performance and the language produced by their interlocutors.
However, if L2 speakers consistently misjudge their performance relative to more objective measures, then they might have difficulty noticing the important ways in which their own production differs from targetlike language, particularly at low ability levels (Ammar & Spada, Reference Ammar and Spada2006). Consistent with the Dunning-Kruger effect, L2 speakers at the lower end of the speaking ability spectrum might be overconfident in their self-assessment, making it harder for them to notice their linguistic shortcomings. In contrast, L2 speakers at the higher end of the spectrum, who are conservative in their self-assessment, might preoccupy themselves with linguistic issues which are fairly inconsequential to their performance. In the end, inaccurate self-assessment might lead most L2 speakers, regardless of their ability level, to engage in skill-inappropriate linguistic choices, such as attending to some aspects of language (e.g., segmentals) at the expense of others (e.g., suprasegmentals), or in real-world behaviors, such as engaging in learning experiences which are inappropriate for their level. Clearly, the relationship between L2 users’ self-assessment of their linguistic abilities and the extent to which they benefit from interaction needs to be investigated further.
Taken together, the current findings point to the inherent complexity of the relationship between language users’ perceived and actual L2 performance. However, at least some of the variability in self-assessment could be due to measurement error, such as the tendency for scores to regress to the mean (Kruger & Mueller, Reference Kruger and Mueller2002) or to test-takers’ (or indeed teacher raters’) bias to respond to traits or phenomena other than those targeted, to portray themselves in a positive light, or to be influenced by task difficulty (Bachman & Palmer, Reference Bachman and Palmer1989; Heilenman, Reference Heilenman1990). Additionally, some of the variability in self-assessment may have also stemmed from methodological differences in how speakers and listeners assessed speech in this study. While the listeners were given multiple opportunities to listen to audio recordings to assess the speakers’ accent and comprehensibility, the speakers had no access to their own performance or to the performance by their peers. Put differently, whereas the listeners could engage in norm-referenced assessment (i.e., compare one speaker to another speaker, with an order effect controlled through randomization), the speakers, who completed self-assessments without access to peer performances, could not evaluate their own performance relative to those of other L2 users. L2 speakers thus could not make immediate use of a reference sample of other speakers to mediate their use of the scale. Therefore, future research could further examine the relationship between L2 users’ self- and peer-assessments, making their assessment procedure more similar to that of the listeners.
These methodological issues notwithstanding, consistently documented failures for people to accurately assess their performance, traceable to the lack of a threshold level of ability in a given skill, suggest that self-assessment is driven by entrenched, preconceived self-views (Carter & Dunning, Reference Carter and Dunning2008; Ehrlinger & Dunning, Reference Ehrlinger and Dunning2003). Critcher and Dunning (Reference Critcher and Dunning2009) proposed that such self-views influence people's performance evaluations by biasing them to experience tasks in a particular (excessively favorable) way. In their study, college students performing several tests were asked not only to estimate their test performance but also, when completing each test item, to self-rate how long they worked on it, how difficult it was, or how much they guessed. These researchers showed that students’ self-assessment was unrelated to their actual performance but instead was associated with their perceived task experiences. Those who overestimated their performance, compared to those who did not, perceived their time on task as being shorter and the task itself as less effortful, and felt more familiar with test content. Thus, inaccurate self-assessment, guided by top-down self-views, was mediated through specific bottom-up task experiences.
Although no link between self-assessment and task difficulty was found here, Critcher and Dunning's (Reference Critcher and Dunning2009) finding implies that entrenched, preconceived self-views responsible for inaccurate self-assessment are ultimately traceable to peoples’ real-world experiences with a given skill set. For a skill as ill-defined and complex as L2 pronunciation, where speakers might succeed in communication despite a noticeable accent or through the use of such strategies as gesturing, avoidance, or circumlocution to convey a message, and without interlocutors’ feedback focusing specifically on speech perception and production, speakers might develop an overly positive view of their speaking experiences, thus reinforcing inaccurate self-views responsible for inaccurate self-assessment. Accurate self-assessment, then, may be tied to clear, unambiguous learning experiences, an issue discussed further as part of the implications.
Linguistic basis of self-assessment
Besides documenting inaccuracies in L2 speakers’ self-assessment of their L2 accent and comprehensibility, one novel finding of this study was that such inaccuracies were only tied to segmental, suprasegmental, and fluency aspects of L2 speech (see Table 4). This result stands in stark contrast to research showing that, for native-speaking listeners, accent and comprehensibility are associated with different linguistic dimensions of speech (Crowther et al., Reference Crowther, Trofimovich, Saito and Isaacs2014; Derwing et al., Reference Derwing, Rossiter, Munro and Thomson2004; Tajima, Port & Dalby, Reference Tajima, Port and Dalby1997; Trofimovich & Isaacs, Reference Trofimovich and Isaacs2012). L2 accent is predominantly tied to segmental and suprasegmental aspects of L2 speech as well as fluency while L2 comprehensibility, in addition to these factors, is linked to several other domains, including lexicon, grammar, and discourse structure. Thus, while L2 speakers’ self-ratings of accent were inaccurate, compared to native listener ratings, they were based on the same linguistic dimensions that are used by native-speaking listeners to judge L2 accent (e.g., Crowther et al., Reference Crowther, Trofimovich, Saito and Isaacs2014; Trofimovich & Isaacs, Reference Trofimovich and Isaacs2012). However, L2 speakers’ inaccurate self-ratings of comprehensibility were linked only to segmental, suprasegmental, and fluency variables, whereas native-speaking listeners consider a wider range of linguistic factors in judging comprehensibility. In essence, L2 speakers appear to be unaware which linguistic factors, besides a few segmental and suprasegmental issues, make L2 speech comprehensible for the listener. This finding is striking given that comprehensible speech, rather than accent reduction, is considered to be more useful as a learning and teaching goal (Derwing & Munro, Reference Derwing and Munro2009; Levis, Reference Levis2005). As was argued previously, this lack of awareness, compounded by the complexity of L2 pronunciation (and particularly comprehensibility) as a skill, would only exaggerate L2 speakers’ inaccurate self-assessment.
Although investigating L1 effects on speakers’ self-assessment was not the primary goal of this study, examining four L1-based groups separately in Experiment 2 proved advantageous, since nearly all theoretical frameworks of L2 speech learning predict L1-specific influences on L2 production (e.g., Eckman, Reference Eckman2004; Flege, Reference Flege, Meyer and Schiller2003). Though sample sizes of individual groups were small, there were several L1-specific relationships between speakers’ self-assessment of accent and comprehensibility and linguistic characteristics of their speech. For example, while inaccurate self-assessment of accent was linked to segmental accuracy for most groups, consistent with prior research (Dlaska & Krekeler, Reference Dlaska and Krekeler2008), segmental issues had the strongest association for the Chinese speakers. This likely stems from the challenge that segmental production in English poses to these speakers, with many substitutions and errors of syllable structure in their speech (Anderson-Hsieh et al., Reference Anderson-Hsieh, Johnson and Koehler1992). For Hindi/Urdu speakers, segmentals, word stress, intonation, and rhythm were all strongly associated with their inaccurate self-assessment of comprehensibility. At least some of these associations might be specific to how intonation and pitch are used in Hindi/Urdu as compared to how they are used in English (Shackle, Reference Shackle, Swan and Smith2001). What is crucial is that these potentially L1-specific aspects of speech linked to L2 speakers’ inaccurate self-assessment may not necessarily be those that actually matter for listener perception of accent and comprehensibility. In fact, in a companion study (Crowther et al., Reference Crowther, Trofimovich, Saito and Isaacs2014), Hindi/Urdu speakers’ comprehensibility for native-speaking listeners was associated with lexical, grammatical, and discourse-based aspects of their speech, rather than with any segmental, suprasegmental, or fluency variables. Put differently, the linguistic characteristics which are linked to L2 speakers’ inaccurate self-assessment may not be the same characteristics which are actually important for native-speaking listeners’ assessment. Although thought-provoking, these findings must be confirmed in future research, with the goal of disentangling possible culture- from language-specific effects on L2 speakers’ inaccurate self-assessment, especially because speakers’ culture and linguistic background were confounded in this study.
Implications and future research
One important implication of the current findings pertains to the issue of helping L2 speakers align or calibrate their self-assessment with their actual performance. This issue is crucial if indeed accurate self-assessment underlies L2 development, either through its impact on what L2 speakers attend to in the input they receive, or through its influence on real-world decision-making (e.g., whether L2 speakers engage in learning experiences which are skill-inappropriate or abstain from experiences which are beneficial). It appears that accurate self-assessment is not a simple matter of accruing skill-relevant experience and receiving feedback. For instance, students’ semester-long experience with a subject in an undergraduate educational psychology course, given repeated testing and self-assessment opportunities, had little positive impact on their self-assessment accuracy, such that poor performers remained highly overconfident (Hacker, Bol, Horgan & Rakow, Reference Hacker, Bol, Horgan and Rakow2000). Similarly, Simons (Reference Simons2013) showed that professional bridge players remained overconfident in their predictions of game success even though they consistently received feedback about their performance. In an extensive literature review, Dunning et al. (Reference Dunning, Heath and Suls2004) offered several possible methods of improving self-assessment skills. Such methods include the use of self-testing exercises interspersed throughout the course, reviews of past performance, benchmarking (students creating an agreed-upon set of standards), and peer assessment. With respect to self-assessment of L2 speech, the effectiveness of these methods remains to be investigated in future research.
Last but not least, besides cognitive (e.g., Critcher & Dunning, Reference Critcher and Dunning2009), motivational (e.g., Guenther & Alicke, Reference Guenther and Alicke2010), or instructional (e.g., Dunning et al., Reference Dunning, Heath and Suls2004) variables contributing to inaccurate self-assessment, it might be important to consider social-psychological factors linked to overconfidence. For example, given the gender imbalance in our sample, it would be important to determine how speakers’ gender impacts their self-views, as males and females tend to differ in their self-assessment behaviours (Dunning et al., Reference Dunning, Johnson, Ehrlinger and Kruger2003). Similarly, Fay, Jordan, and Ehrlinger (Reference Fay, Jordan and Ehrlinger2012) recently reviewed evidence suggesting that socially-construed norms might encourage overconfident self-assessment behaviors. These researchers argued that social norms of preferring positive over negative feedback (e.g., Brown & Levinson, Reference Brown and Levinson1987), which may be culturally-mediated (e.g., Heine, Kitayama & Lehman, Reference Heine, Kitayama and Lehman2001), and an emphasis on positive emotions such as joy, love, and pride over negative emotions (e.g., Eid & Diener, Reference Eid and Diener2001) might actually rob people of the crucial information they require to create accurate self-awareness. Such social and emotional influences on self-assessment, particularly for L2 speech development in various contexts (e.g., classroom, study abroad) and for various types of learners (e.g., children, adults), are interesting areas for future research into the relationship between self- and other-assessment of L2 speech.
Appendix: Training materials and onscreen labels