Introduction
The detection of contours that typically define the boundaries of objects is an important perceptual function for navigating the visual world. A special type of contour detection involves inferentially perceiving discrete, spatially separated edge elements as a larger, single contour, in accordance with Gestalt principles of proximity and good continuation (Wertheimer, Reference Wertheimer and Ellis1938). To date, researchers have examined the perception of contours that form closed objects yielding evidence of abnormalities in both early visual cortical and higher-level functions in schizophrenia (SCZ) (Butler et al., Reference Butler, Abeles, Silverstein, Dias, Weiskopf, Calderone and Sehatpour2013; Foxe, Murray, & Javitt, Reference Foxe, Murray and Javitt2005; Silverstein, Kovács, Corry, & Valone, Reference Silverstein, Kovács, Corry and Valone2000; Spencer et al., Reference Spencer, Nestor, Niznikiewicz, Salisbury, Shenton and McCarley2003, Reference Spencer, Nestor, Perlmutter, Niznikiewicz, Klump, Frumin and McCarley2004), but it remains unclear whether perception of simple discrete contours devoid of semantic information may yield similar high-level abnormalities. Disentangling the diverse processes that lead to contour integration deficits in SCZ may illuminate whether such deficits are unique to contour detection or are indicative of wide-ranging perceptual deficits.
Another important perceptual function for navigating the visual world involves the modulation of a central stimulus by the presence and configuration of surrounding stimuli; typically, more similar surrounding contexts reduce perceptual salience (i.e. surround suppression; Chubb, Sperling, & Solomon, Reference Chubb, Sperling and Solomon1989; Snowden & Hammett, Reference Snowden and Hammett1998; Xing & Heeger, Reference Xing and Heeger2000, Reference Xing and Heeger2001; Yu, Klein, & Levi, Reference Yu, Klein and Levi2001, Reference Yu, Klein and Levi2003). Effects of surrounding context are thought to be weaker in people with SCZ; for example, surround suppression during contrast perception is weaker in SCZ v. healthy controls (CON; Dakin, Carlin, & Hemsley, Reference Dakin, Carlin and Hemsley2005; Tibber et al., Reference Tibber, Anderson, Bobin, Antonova, Seabright, Wright and Dakin2013; Yang et al., Reference Yang, Tadin, Glasser, Hong, Blake and Park2013; Yoon et al., Reference Yoon, Rokem, Silver, Minzenberg, Ursu, Ragland and Carter2009), and similar effects have been reported during contour detection (Schallmo, Sponheim, & Olman, Reference Schallmo, Sponheim and Olman2013).
Visual contextual modulation is thought to depend on a mixture of lower- and higher-level processes, based on work in both animal models (Angelucci & Bressloff, Reference Angelucci, Bressloff, Martinez-Conde, Macknik, Martinez, Alonso and Tse2006; Nurminen, Merlin, Bijanzadeh, Federer, & Angelucci, Reference Nurminen, Merlin, Bijanzadeh, Federer and Angelucci2018; Webb, Dhruv, Solomon, Tailby, & Lennie, Reference Webb, Dhruv, Solomon, Tailby and Lennie2005) and humans (Cai, Zhou, & Chen, Reference Cai, Zhou and Chen2008; Petrov & McKee, Reference Petrov and McKee2009; Schallmo, Kale, & Murray, Reference Schallmo, Kale and Murray2019; Schallmo & Murray, Reference Schallmo and Murray2016). Few, if any, studies have delineated how these lower and higher level processes are affected in SCZ and patients with bipolar disorder (BP). Given the distinct time courses of these proposed mechanisms, the high temporal resolution of electroencephalography (EEG) may be useful for identifying when deviant contextual modulation occurs.
Furthermore, there are relatively few studies comparing contextual modulation in SCZ to first-degree relatives of SCZ (SREL; Schallmo et al., Reference Schallmo, Sponheim and Olman2013; Schallmo, Sponheim, & Olman, Reference Schallmo, Sponheim and Olman2015). Previous studies from our group have reported normal surround suppression, but could not speak to the latent physiology of contextual modulation in SREL. Investigation of the neurobiology of contextual modulation in SREL may provide insights into the relationship between genetic liability for SCZ and abnormal contextual modulation.
The present study aimed to identify neural correlates of impaired contextual processing and contour integration in SCZ, BP, and SREL as compared to CON. Specifically, we utilized event-related potentials (ERPs) to understand the time course of neural responses to visual contour stimuli, the modulation by surrounding context, and deficient neural processing.
Methods and materials
Participants
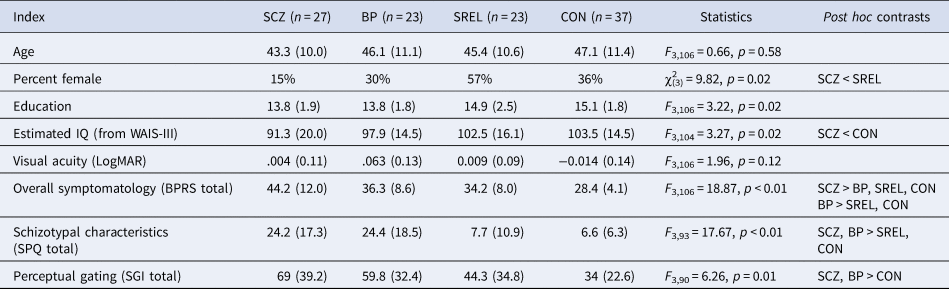
28 SCZ, 23 SREL, 25 BP, and 37 CON completed the Collinear Gabor Contour Task (CGCT; Schallmo et al., Reference Schallmo, Sponheim and Olman2013; Schumacher, Quinn, & Olman, Reference Schumacher, Quinn and Olman2011) as part of two family studies of severe psychopathology at the Minneapolis Veterans Affairs Health Care System (MVAHCS). Fourteen SCZ, eight SREL, and 15 CON participated in a previous study that implemented an earlier version of the CGCT (Schallmo et al., Reference Schallmo, Sponheim and Olman2013). Table 1 provides demographic and clinical characteristics of participants. Patients were recruited from MVAHCS outpatient clinics, community support programs for the mentally ill, and county mental health clinics. SREL were identified by research staff using a pedigree form completed through interviews with SCZ. CON were recruited via posted announcements at fitness centers, community libraries, the MVAHCS, and newsletters for veterans.
Participant demographic characteristics and symptom ratings

SCZ, patients with schizophrenia; BP, patients with bipolar disorder; SREL, first degree relatives of SCZ; CON, healthy controls; WAIS-III, Wechsler Adult Intelligence Scale, 3rd edition; BPRS, 24-item brief psychiatric Rating Scale; SPQ, Schizotypal Personality Questionnaire; SGI, Sensory Gating Inventory.
All data are presented as mean (standard deviation), unless otherwise noted.
Alpha for all post hoc contrasts was set at 0.05 and were corrected for multiple comparisons using FDR when appropriate. Estimated IQ data were not obtained for one patient with BP and one healthy control. SPQ data were not obtained for one patient with SCZ, three SREL, four BP, and five CON. SGI data were not obtained for two SREL, three CON, five BP, and six SCZ.
Potential SCZ, BP, and CON participants were excluded if they met any of the following criteria: English as a second language, age >60 years, IQ <70, poor visual acuity that could not be corrected to a logarithmic visual acuity score of <0.3 LogMAR or 20/40 Snellen (4 meter viewing distance; (LIGHTHOUSE Distance Visual Acuity Test, Long Island City, NY)), substance dependence within the past 6 months, substance abuse within 2 weeks of testing, head injury with skull fracture or substantial loss of consciousness (i.e. loss of consciousness >30 min), electroconvulsive therapy, amblyopia untreated before 18, epilepsy, stroke, or other neurological conditions. Additional exclusion criteria for CON were family history of major depressive disorder or a psychotic disorder. SREL were excluded only if they had poor visual acuity that could not be corrected to normal (i.e. LogMAR score <0.3), or a medical condition that prevented participation.
The study protocol was approved and monitored by the MVAHCS and the University of Minnesota Institutional Review Board. Participants were administered the Structured Clinical Interview for the DSM-IV-TR Axis-I Disorders-Patient Edition (SCID-I/P; First et al., Reference First, Spitzer, Gibbon and Williams2002), Brief Psychiatric Rating Scale, 24-item (BPRS; Overall & Gorham, Reference Overall and Gorham1962), Schizotypal Personality Questionnaire (SPQ; Raine, Reference Raine1991), Sensory Gating Inventory (SGI; Hetrick, Erickson, & Smith, Reference Hetrick, Erickson and Smith2012), and Wechsler Adult Intelligence Scale, Third Edition (WAIS-III; Wechsler, Reference Wechsler1997). A minimum of two trained raters (advanced doctoral students in clinical psychology, postdoctoral researchers, or licensed psychologists) reached consensus on all diagnoses, based on the DSM-IV-TR criteria (American Psychological Association, 2000). Additional participant and study information is detailed in previous publications (Goghari, Macdonald, & Sponheim, Reference Goghari, Macdonald and Sponheim2014; Lynn, Kang, & Sponheim, Reference Lynn, Kang and Sponheim2016).
Participant characteristics
Participant demographic information, after exclusions, is presented in Table 1. Due to differences in gender distribution across groups, gender was added as a between-subjects factor in all analyses (Feng et al., Reference Feng, Zheng, Zhang, Song, Luo, Li and Talhelm2011; Steffensen et al., Reference Steffensen, Ohran, Shipp, Hales, Stobbs and Fleming2008). Visual acuity was not significantly different across groups. One SCZ participant had amblyopia corrected before the age of 18 with multiple interventions (two surgeries and corrective glasses). There were differences in education across groups, but post-hoc comparisons did not reach significance. Estimated IQ differed across groups with CON exhibiting higher IQs than SCZ. Psychiatric symptoms, as assessed by the BPRS, were more prominent in SCZ as compared to BP, CON, and SREL while BP exhibited intermediate psychiatric symptomatology, scoring lower than SCZ, but higher than CON. Schizotypal personality trait scores were higher for both patient groups as compared to SREL and CON. Similarly, phenomenological perceptual gating abnormalities were more prominent in both patient groups as compared to SREL and CON.
Task
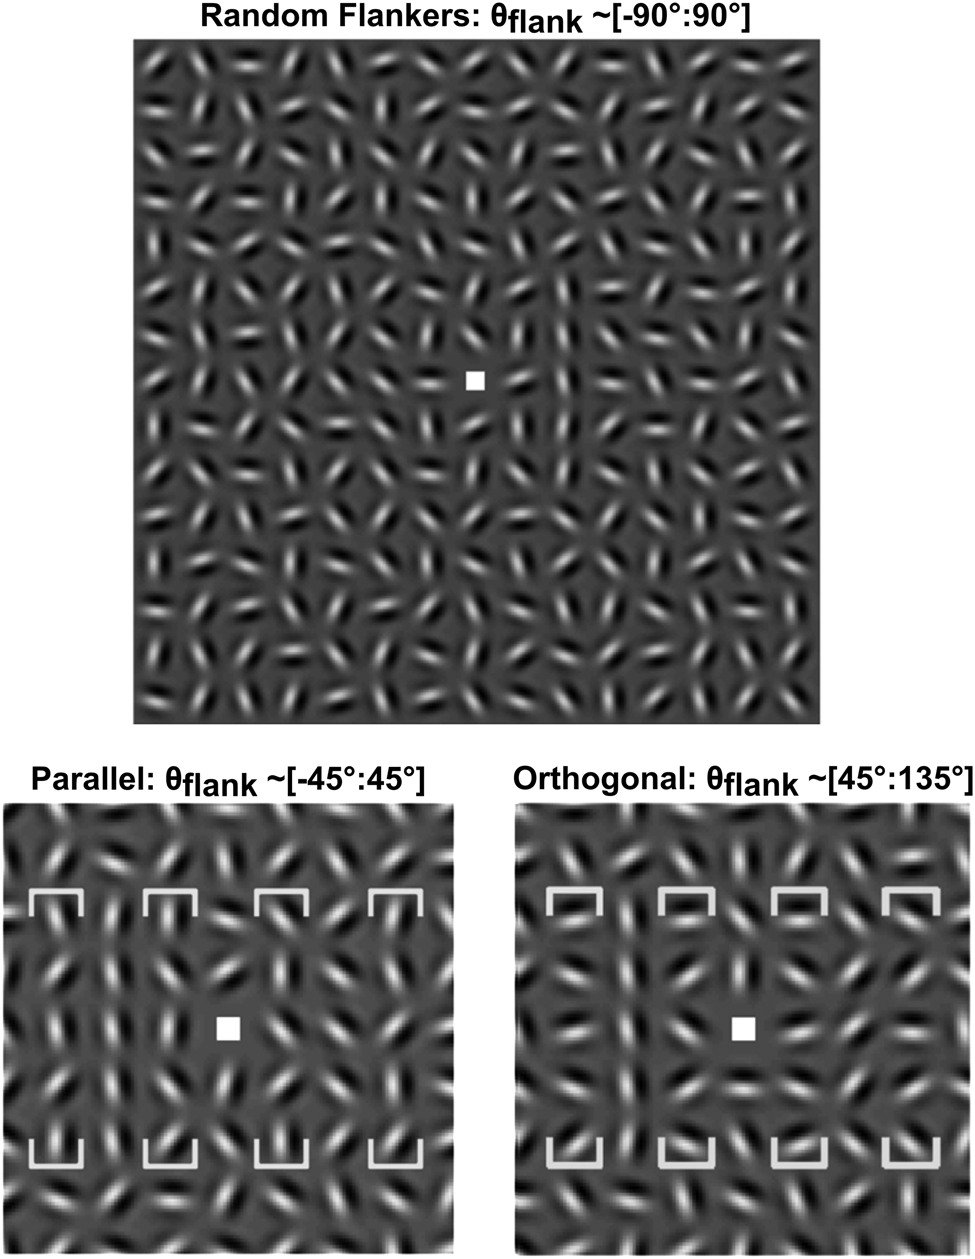
Stimuli for the CGCT were presented using E-Prime on a Dell computer running Windows XP. The images were displayed on a NEC-17″ CRT monitor with a 1024 × 768 resolution. The monitor viewing distance was 61 cm and the visual angle subtended 35.1 × 26.7° and the monitor was calibrated to have a linear luminance output. Stimuli consisted of Gabor patches organized into 15 × 15 grids (see Fig. 1). Gabor arrays subtended 12°. Individual Gabors consisted of a two cycles per degree sine wave grating modulated by a Gaussian envelope (s.d. = 0.17°) and were spaced 0.8° from one another. Target contours were composed of five vertically aligned Gabor patches centered at 1.6° eccentricity to the left or right of a central fixation point along the horizontal meridian (see Fig. 1).
Stimulus examples. (Top) Collinear Gabors form a vertical contour (right of center), with randomly oriented flankers. (Bottom left, bottom right) Same, but with the contours to the left of center, and with parallel or orthogonal flankers. The flanker position is bracketed in each panel with orientation distributions noted above. The bottom left and right panels are zoomed in for detail. The parallel condition typically suppresses contour detection, the random condition is typically intermediate and the orthogonal condition typically facilitates detection. Adapted from Fig. 1 in Schallmo et al. (Reference Schallmo, Sponheim and Olman2013).

Target contour detection thresholds were calculated for three flanker conditions: parallel, random, and orthogonal. In normative populations, parallel flankers suppress contour detection, random flankers are intermediate and orthogonal flankers facilitate contour detection (Dakin & Baruch, Reference Dakin and Baruch2009; Schumacher et al., Reference Schumacher, Quinn and Olman2011). Orthogonal flankers ranged from 45° to 135° such that the mean orientation of flankers was perpendicular to the target contour. Similarly, orientation of parallel flanker stimuli ranged from −45° to 45° such that the mean orientation of flankers was parallel to the contour. Random flanker stimuli ranged from −90° to 90°. Non-contour, non-flanker Gabor patches were randomly oriented, but cardinal neighbors differed by at least 30° to prevent stochastic contour formation.
Procedure
Participants were instructed to fixate on a cross at the center of the monitor and use their peripheral vision to detect laterality of the target contour within the stimuli grid. For each trial, the fixation cross was randomly moved within 0.5° of the center to prevent participants fixating on potential target contour locations. Responses were indicated via a left or right press on a button box. Degree of collinearity within target contours was jittered in increments of 4.5° with a floor of 0° and a ceiling of 45°. Before the EEG session, participants completed a preliminary version of the CGCT to determine collinear jitter threshold values for the EEG version of the task. In this preliminary task, collinear jitter was increased after three correct responses and decreased after one incorrect response. This staircase procedure adjusted task difficulty such that participants’ overall accuracy approached 79% (Garcia-Perez, Reference Garcia-Perez2000). Setting jitter thresholds for each participant allowed for personalized task difficulty and prevented performance effects (i.e. floor effects and ceiling effects) during the EEG task. Additionally, individually tailored jitter thresholds helped control for effects related to generalized cognitive deficits in SCZ because task difficulty was equated across subjects (Gold & Dickinson, Reference Gold and Dickinson2013).
EEG data collection and analyses
EEG data were collected using a BioSemi ActiveTwo system with a differential amplifier and a high density 128 electrode cap. All channels were referenced to linked-ears during acquisition. Data were recorded with a sampling rate of 1024 Hz, and downsampled to 256 Hz offline with a high pass filter of 0.5 Hz and a low pass filter of 256 Hz. Artifacts were removed using a custom ICA algorithm, and denoised data were re-referenced to average head signal.
Stimulus locked ERPs were computed by averaging trials within each flanker condition for each participant. Participants were not included if they had less than 20 viable trials per condition after preprocessing. On average, each group had a similar number of trials per condition (SCZ, M = 52.2; BP, M = 51.5; SREL, M = 51.2; CON, M = 51.2; ANOVA, F 3,106 = 0.56 p = 0.64). In order to differentiate neural responses associated with hypothesized temporally discrete mechanisms of surround suppression (Bair, Cavanaugh, & Movshon, Reference Bair, Cavanaugh and Movshon2003; Schallmo & Murray, Reference Schallmo and Murray2016), our ERP components of interest included earlier P1 (70–110 ms) and N1 (110–210 ms) components, and later P2 (190–290 ms) and P3 (350–650 ms) components. Time windows of interest were identified via inspection of grand average butterfly plot waveforms, grand average topographies, and histograms depicting mean amplitude frequency across subject-level ERPs. Electrodes where ERP amplitudes were largest or task effects were most evident, collapsed across groups, were selected for quantification. PO7 and PO8 electrode sites were averaged together for trials in which the target was contralateral to electrode location and quantified for P1, N1, and P2. Additionally, a late positive (P3) component was observed and quantified at CPz (350–650 ms). Further EEG collection and analysis information can be found in the online Supplemental Materials.
Analysis
Subjects were excluded from analysis if accuracy scores were lower than 60% across all trials or lower than 75% on catch trials (one SCZ and two BP were excluded this way). Catch trials were trials in which the orientation jitter was fixed at 0° (i.e. the jitter level with the lowest difficulty). Eight SCZ had a total of 13 relatives in the SREL group in the final analysis. To address concerns regarding shared characteristics between family members biasing our statistical analyses, we followed up repeated measures ANOVAs with corresponding mixed effects models with family membership included as a random effect (see online Supplementary Table S1). All reported findings were corroborated by these mixed effects models. Contour detection performance was calculated by averaging jitter thresholds (degree of misalignment tolerated for the five Gabor elements that make up the linear contour) in each flanker orientation condition for each subject. Contextual modulation indices were then calculated by subtracting random condition jitter thresholds from both parallel and orthogonal jitter thresholds. All p values were corrected for multiple comparisons using Tukey's HSD for between-subjects effects and false discovery rate (FDR; Benjamini & Hochberg, Reference Benjamini and Hochberg1995) for within-subjects effects.
Results
Task performance
There were no group differences in accuracy (main effect of group, ANOVA, F 3,102 = 0.91, p = 0.44) reflecting the individualization of task difficulty. Average reaction times did not differ across groups (main effect of group, ANOVA, F 3,102 = 1.62, p = 0.19), but females exhibited slower reaction times compared to males (main effect of gender, ANOVA, F 1,102 = 4.70, p = 0.03).
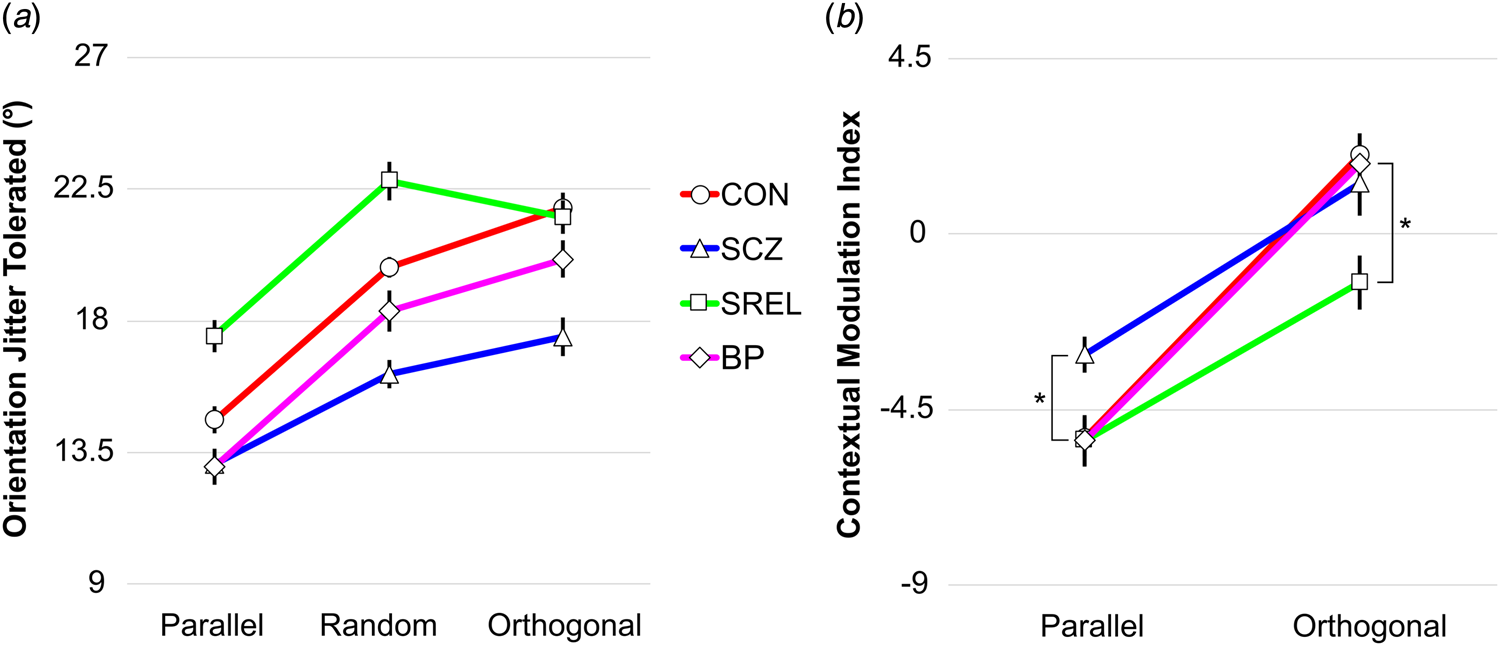
Figure 2 depicts behavioral performance on the CGCT for each group. Higher jitter thresholds indicated stronger contour integration and better overall performance. We observed differences in contour detection performance between flanker conditions (relative orientation of Gabor elements neighboring the collinear contour: parallel, random, and orthogonal) and groups (main effect of flanker, F 2,101 = 93.81, p < 0.001; main effect of group, F 3,102 = 4.00, p = 0.01). Irrespective of group, participants exhibited less tolerance to orientation jitter (i.e. worse contour detection performance) during the parallel flanker condition as compared to the random (FDR corrected p < 0.001) and orthogonal conditions (FDR corrected p < 0.001). Differences in contour detection between the random and orthogonal conditions were also significant (FDR corrected, p = 0.043). Across conditions, SCZ had lower jitter thresholds than SREL (Tukey's HSD, p < 0.001) and CON (Tukey's HSD, p = 0.016), but did not significantly differ from BP (Tukey's HSD, p = 0.547). Across flanker conditions, mean jitter threshold was higher for SREL compared to CON, but the post-hoc contrast was not significant (even without correction for multiple comparisons). Additionally, the effect of flanker orientation on contour detection differed between groups as indicated by an interaction of condition and group (F 6,204 = 3.35, p = 0.004). Notably, only CON (FDR corrected p = 0.004) exhibited significant facilitation of contour perception in the orthogonal condition as compared to the random condition.
Contour detection thresholds and contextual modulation indices. Mean detection thresholds (left) and contextual modulation indices (right) are plotted for 37 CON (circles), 27 SCZ (triangles), 23 SREL (squares), and 23 BP (diamonds) for parallel, random, and orthogonal conditions. Asterisks denote attenuated suppression by parallel flankers in SCZ as compared to other groups (FDR corrected ps<0.016) and attenuated facilitation in SREL as compared to CON (FDR corrected p = 0.018). Error bars are within-subjects standard error of the mean with a Morey correction factor. These were calculated by subtracting the within-subject mean across conditions from each subject's data, and then adding the grand mean (across subjects and conditions), according to an established method (Morey, Reference Morey2008). This was done to help visualize variability across conditions, while accounting for the greater variability across individuals in ERP amplitudes.

Contextual modulation performance
Contextual modulation indices were calculated to reflect the impact of flanker orientation on contour integration relative to the random flanker condition. As expected, we observed differences in contour detection between parallel-random and orthogonal-random modulation indices (main effect of relative flanker orientation, ANOVA, F 1,102 = 140.99, p < 0.001). Given our a priori hypothesis that SCZ would exhibit weakened contextual suppression (Mittal, Gupta, Keane, & Silverstein, Reference Mittal, Gupta, Keane and Silverstein2015; Schallmo et al., Reference Schallmo, Sponheim and Olman2013), we conducted one-tailed t tests to assess contextual modulation for SCZ in the parallel condition as compared to other groups. Analyses revealed that SCZ exhibited weaker modulation (i.e. less suppression) to parallel contextual stimuli as compared to the other groups (FDR corrected ps < 0.016). Unexpectedly, SREL exhibited negative estimated orthogonal modulation indices, signifying a lack of facilitation by orthogonal flankers. To test whether this lack of facilitation was due to a ceiling effect (i.e. whether SREL's lack of orthogonal facilitation was due to the group's higher jitter thresholds overall), we correlated overall jitter thresholds with the orthogonal modulation indices for SREL. This revealed a non-significant relationship between better performance on the task in general and lower orthogonal facilitation (r(21) = −0.39, p = 0.063). Additionally, it should be noted that jitter thresholds for SREL participants did not approach ceiling level in our task (45°). Follow-up pairwise comparisons revealed differences in contextual facilitation between SREL and CON only (FDR corrected p = 0.036). Interestingly, group differences in contextual modulation were affected by gender irrespective of flanker condition (interaction of group and gender, ANOVA, F 3,102 = 3.86, p = 0.012). This interaction was primarily driven by BP in which males exhibited more positive contextual modulation indices, collapsed across conditions, than females (FDR corrected p = 0.001).
Visual evoked potentials: P1 and N1
We did not observe effects of group (ANOVA, F 3,109 = 1.6, p = 0.16), condition (ANOVA, F 2,109 = 0.4, p = 0.67) or gender (ANOVA, F 1,109 = 0.97, p = 0.33) on P1 mean amplitude at sites PO7/PO8. Furthermore, amplitude did not significantly differ across groups as a function of flanker orientation (interaction of group and condition, ANOVA, F 6,109 = 0.56, p = 0.76).
For N1 at sites PO7/PO8, we found a significant effect of flanker orientation on mean amplitude (main effect of flanker condition, ANOVA, F 2,101 = 3.31, p = 0.041). Post-hoc pairwise comparisons revealed a difference in amplitude between parallel and orthogonal conditions that did not withstand correction for multiple comparisons. There were no differences in mean amplitude between groups (main effect of group, ANOVA, F 3,102 = 0.76, p = 0.52) or differences in the effect of flanker condition between groups (interaction of flanker condition and group, ANOVA, F 6,204 = 0.77, p = 0.59).
Late visual event-related potential: P2
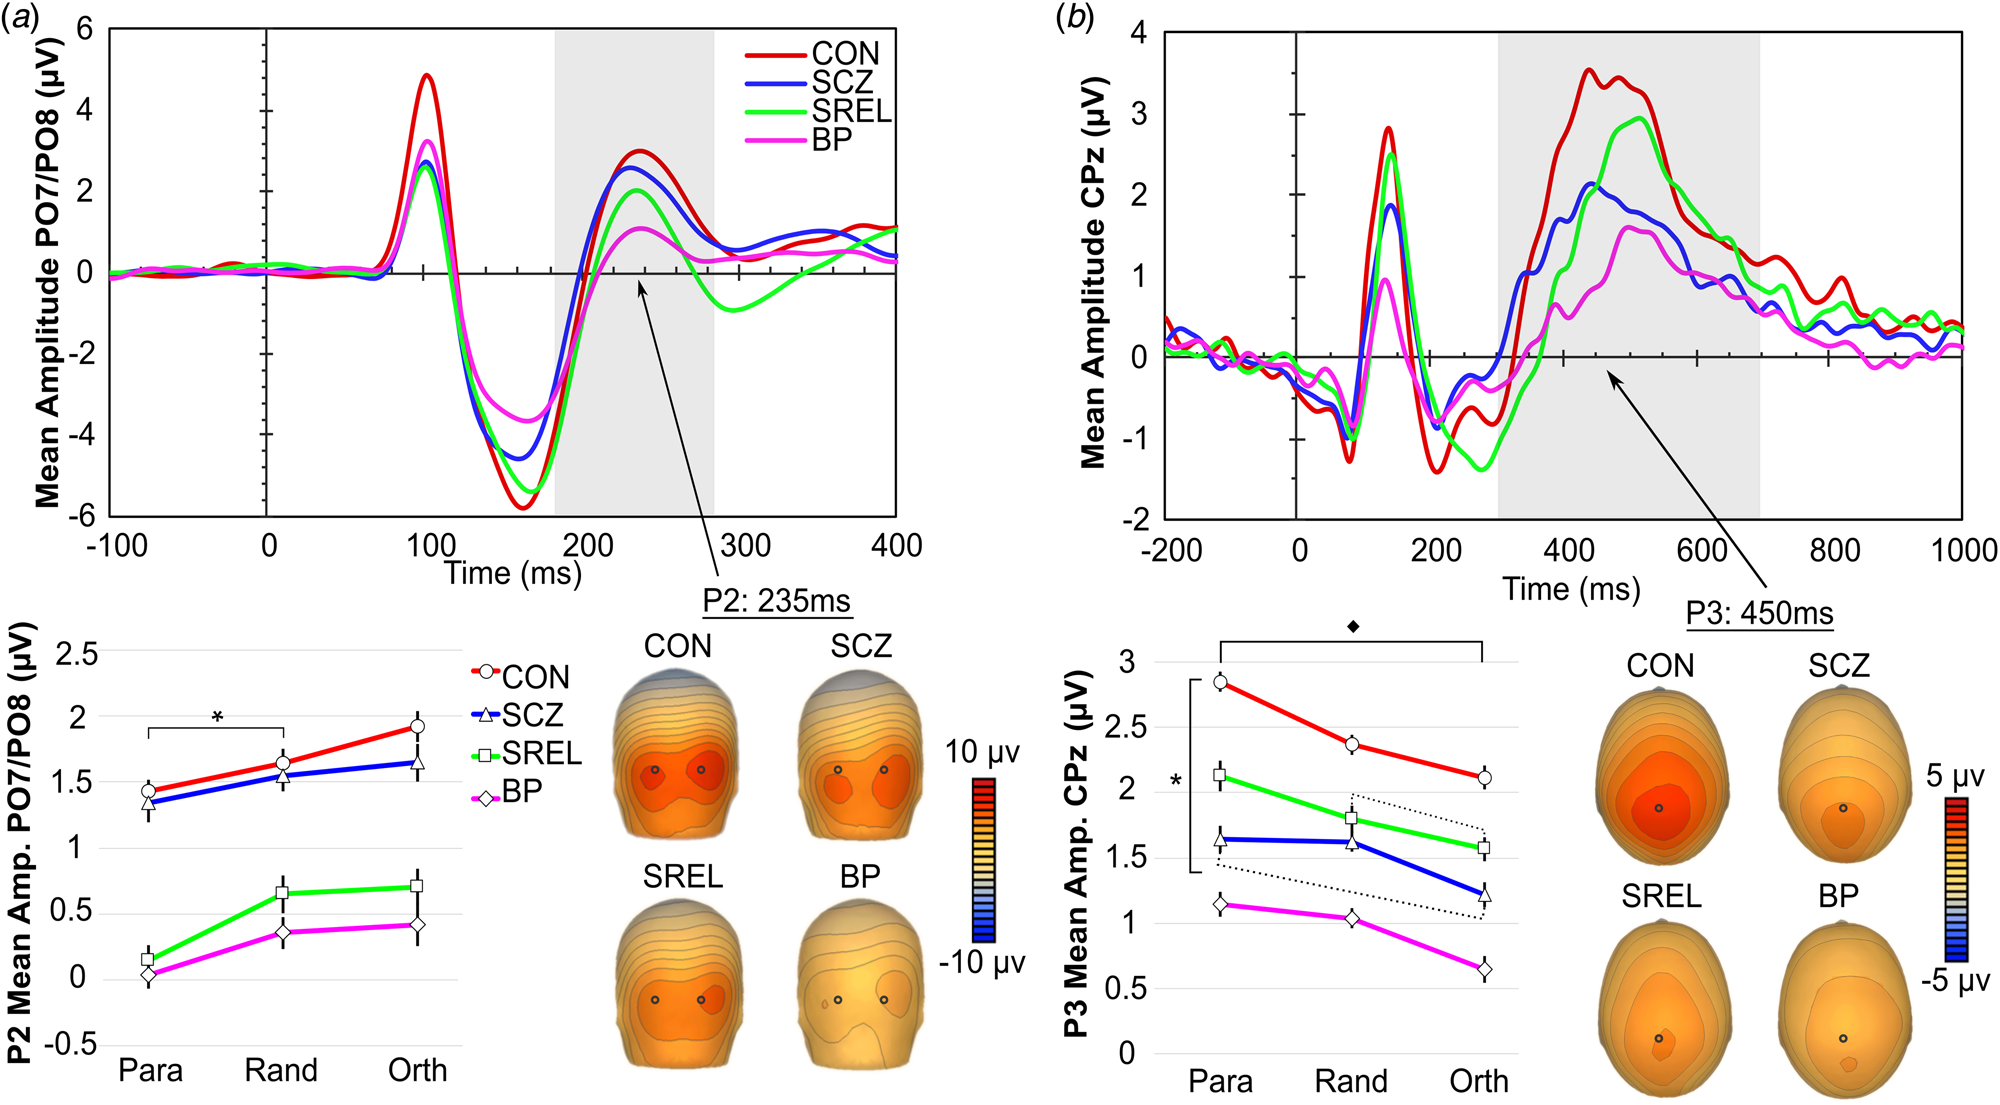
Main effects of flanker condition (ANOVA, F 2,101 = 9.80, p < 0.001) and group (ANOVA, F 3,102 = 3.22, p = 0.026) were found for the P2 component at sites PO7/PO8 (see Fig. 3a). Collapsed across groups, P2 amplitudes differed between parallel and random conditions (FDR corrected p = 0.002), and between parallel and orthogonal conditions (FDR corrected p = 0.002), but did not significantly modulate between random and orthogonal conditions (FDR corrected p = 0.504). This lack of modulation between random and orthogonal conditions matches behavioral findings in which the weakest flanker effects on contour detection were observed between random and orthogonal flanker conditions. Follow up pairwise comparisons of the group effect only revealed attenuated P2 amplitudes in BP compared to CON that did not withstand correction for multiple comparison.
P2 component and P3 components. (Panels a and b, top) Grand average PO7/PO8 and CPz waveforms for each group. (Panels a and b, bottom left) P2 and P3 mean amplitudes with flanker condition on the x-axis. (Panels a and b, bottom right) Topographical representation of occipital P2 and centroparietal P3 activation for each group. (Panel a) * indicates significant amplitude modulation across all groups between parallel and random flanker conditions (FDR corrected ps < 0.002). (Panel b) Black diamond indicates modulation of P3 amplitude between parallel and orthogonal conditions for all groups except for SCZ (FDR corrected p = 0.137). (Panel b) * indicates lower overall P3 amplitudes in BP and SCZ compared to CON (Tukey's HSD, ps < 0.019). (Panel b) Dotted lines indicate a lack of modulation between parallel and orthogonal flankers for SCZ, and a lack of modulation between random and orthogonal conditions for SREL. Error bars are within-subjects standard error of the mean with a Morey correction factor (see Fig. 2). Note: we did not quantify the earlier positive component apparent in the CPz grand average waveform because inspection of grand average topographies revealed this component to be the result of a dipole generated by the occipital N1 component.

Cognitive event-related potential: P3
For the P3 component at scalp site CPz (see Fig. 3a), we observed main effects of flanker (ANOVA, F 2,101 = 19.356, p < 0.001) and group (ANOVA, F 6,102 = 7.64, p < 0.001), but did not observe an interaction of group by flanker condition (ANOVA, F 6,204 = 1.03, p = 0.408). Collapsed across groups, participants showed the largest P3 amplitudes for contours with parallel flankers, smallest P3 amplitudes for orthogonal stimuli, and intermediate responses for the random condition (FDR corrected ps < 0.002). Irrespective of condition, SCZ (Tukey's HSD, p = 0.019) and BP (Tukey's HSD, p = 0.001) exhibited reduced P3 amplitudes as compared to CON. To test whether group differences in ability to allocate attention to stimuli were responsible for differences in P3 amplitudes, we correlated P3 amplitudes with BPRS distractibility ratings for each group. These correlations did not reach significance (ps > 0.05). Exploratory analysis of the simple main effects of condition on group revealed SCZ to be the only group that did not modulate P3 amplitude between the orthogonal and parallel conditions (FDR corrected p = 0.137). Additionally, SCZ and SREL failed to modulate P3 mean amplitude between the random and orthogonal conditions (FDR corrected ps > 0.05) in contrast with BP (FDR corrected p = 0.041) and CON (FDR corrected p = 0.038). This lack of modulation in SCZ and SREL aligns with behavioral findings in which SCZ and SREL showed a lack of facilitation in contour detection between random and orthogonal conditions. No significant effects of gender were observed in any of the ERP analyses with the exception of a P3 group by gender interaction (ANOVA, F 3,109 = 2.89, p = 0.039). Follow-up pairwise comparisons revealed this interaction to be driven by SREL in which females exhibited larger P3 amplitudes than males (FDR corrected p = 0.011).
Association between behavioral and ERP responses
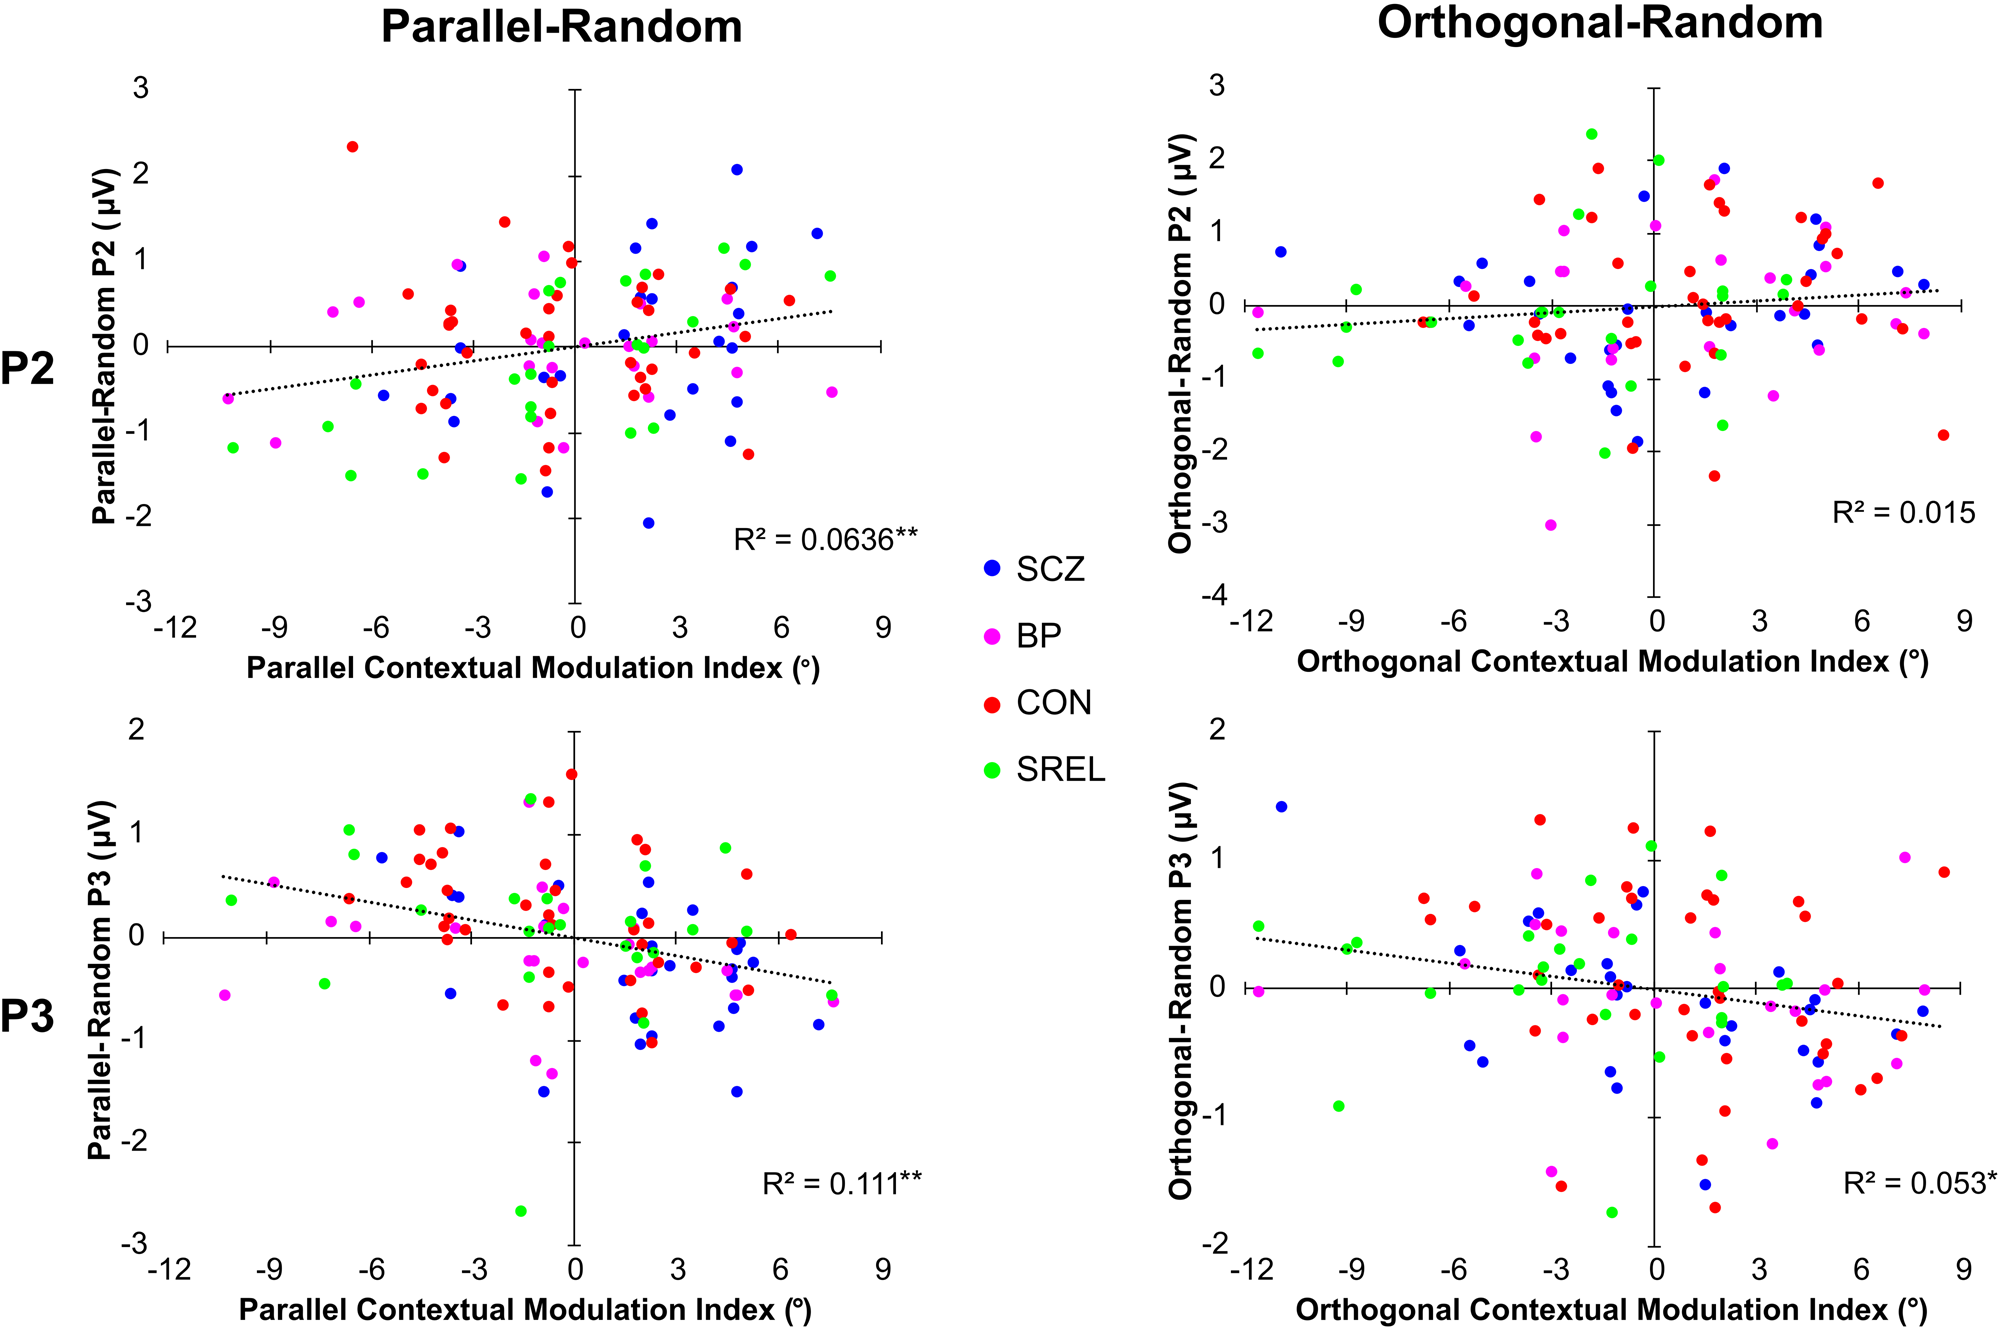
P2 and P3 amplitudes evoked in the random flanker condition were subtracted from orthogonal and parallel condition amplitudes in order to create ERP-based contextual modulation indices. These ERP contextual modulation indices were examined for associations with behavioral measures of flanker modulation of contour perception from the CGCT. Figure 4 depicts the relationships between perceptual and ERP modulation indices. Pearson correlations indicated a significant positive relationship between parallel-random P2 amplitudes and parallel-random modulation indices (r(108) = 0.252, FDR corrected p = 0.016), but did not indicate a significant relationship between orthogonal-random P2 amplitudes and orthogonal-random modulation indices (r(108) = 0.122, FDR corrected p = 0.203). Similar correlations were calculated for P3 amplitudes which revealed a significant negative relationship between parallel-random P3 mean amplitudes and parallel contextual modulation indices (r(108) = −0.333, FDR corrected p = 0.004), as well as orthogonal-random P3 mean amplitudes and orthogonal contextual modulation indices (r(108) = −0.230, FDR corrected p = 0.021). Notably, correlations with the perceptual modulation indices were in the opposite direction for the P2 and P3 ERP responses. Finally, we correlated ERP and behavioral contextual modulation indices with clinical symptom ratings (BPRS, SPQ, and SGI), but these correlations did not reach significance (FDR corrected ps > 0.05).
Associations between behavioral and ERP contextual modulation indices scatterplots of P2 and P3 mean amplitude modulation indices and behavioral contextual modulation indices. The trend line for each plot is calculated across groups. R 2 values with a single asterisk represent significance when alpha is set at 0.05 while two asterisks represent significance when alpha is set at 0.01.

Discussion
Summary
In the present study, we administered a contour integration and visual context modulation task to patients with SCZ, their first degree biological relatives, patients with BP, and healthy controls. We analyzed simultaneously recorded behavioral and ERP data to investigate the neurobiology of abnormal visual perception. Behavioral data were indicative of impaired contour integration (Silverstein & Keane, Reference Silverstein and Keane2011), and weakened contextual suppression in SCZ (Schallmo et al., Reference Schallmo, Sponheim and Olman2013). Furthermore, BP exhibited intermediate contour integration impairments, but not contextual processing impairments. These findings agree with theories that weakened surround suppression is specific to SCZ and not a product of broad cognitive impairment or general psychopathology (Tibber et al., Reference Tibber, Anderson, Bobin, Antonova, Seabright, Wright and Dakin2013).
Additionally, we replicated previous findings in which SREL exhibited normal contour integration performance (Schallmo et al., Reference Schallmo, Sponheim and Olman2013), but also observed that SREL exhibited limited contextual facilitation. Our results suggest that SCZ and SREL may share some features of aberrant contextual modulation, but contour integration itself is spared among SREL. Alternatively, it is possible that the observed lack of orthogonal modulation in SREL stemmed from a ceiling effect in which higher overall thresholds blunted the facilitation effect of the orthogonal flankers. However, thresholds for all subjects were far from the task ceiling value (45° jitter), and correlations between overall jitter thresholds and orthogonal modulation were not significant, indicating that higher thresholds did not limit facilitation. Interestingly, SREL exhibited normal contextual suppression unlike SCZ, suggesting a distinction in abnormal contextual modulation between SCZ and SREL.
EEG acquired during task performance provided a direct measurement of neural activity related to surround suppression and contour integration. The paucity of significant effects of group or condition for P1 and N1 components suggests that differences in task performance were not strongly reflected in brain activity within 200 ms after stimulus presentation. Instead, flanker and group effects in the P2 and P3 components suggest that deficits in surround suppression and contour integration occur at a later stage of neural processing, and may be related to higher-order perceptual processing (Bledowski et al., Reference Bledowski, Prvulovic, Hoechstetter, Scherg, Wibral, Goebel and Linden2004; Keane, Joseph, & Silverstein, Reference Keane, Joseph and Silverstein2014; Silverstein et al., Reference Silverstein, Harms, Carter, Gold, Keane, MacDonald and Barch2015). Moreover, we observed that P2 and P3 amplitudes were correlated with contextual modulation behavioral indices such that individuals for whom contour perception was more strongly affected by flanker orientation also showed greater P2 and P3 amplitude modulation between flanker conditions. Interestingly, the associations were positive for P2 and negative for P3 signals, reflecting opposing patterns of brain responses across flanker conditions. The opposing correlations indicate that P2 was largest during conditions in which context was facilitatory (i.e. orthogonal), suggesting an effect of grouping within contour elements. In contrast, P3 was largest during conditions in which context was suppressive (i.e. parallel), perhaps reflecting a context grouping effect. Notably, these results expand upon the ERP findings of Butler et al. (Reference Butler, Abeles, Silverstein, Dias, Weiskopf, Calderone and Sehatpour2013); in addition to reporting a similar set of ERP abnormalities, we show that such abnormalities are not dependent on higher-order object identification processes (as they are present for simple linear contours), suggesting extensive aberrations in perceiving simple stimuli.
Reduced P3 amplitudes at centroparietal midline sites in SCZ and BP, as compared to CON, are consistent with previous findings (Bramon et al., Reference Bramon, McDonald, Croft, Landau, Filbey, Gruzelier and Murray2005; Jeon & Polich, Reference Jeon and Polich2003; Johannesen, O'Donnell, Shekhar, McGrew, & Hetrick, Reference Johannesen, O'Donnell, Shekhar, McGrew and Hetrick2013; Luck et al., Reference Luck, Kappenman, Fuller, Robinson, Summerfelt and Gold2009; Maekawa et al., Reference Maekawa, Katsuki, Kishimoto, Onitsuka, Ogata, Yamasaki and Kanba2013; Ryu, An, Jo, & Cho, Reference Ryu, An, Jo and Cho2010; van der Stelt, Frye, Lieberman, & Belger, Reference van der Stelt, Frye, Lieberman and Belger2004), however further research is needed to clarify observed changes in P3 amplitude between visual context conditions. Existing literature suggests that P3 amplitude is affected by a variety of factors including frequency of stimulus presentation (e.g. rare v. common), stimulus/task complexity, information transmission, and attention allocation (Donchin & Coles, Reference Donchin and Coles1988; Johnson, Reference Johnson1986; Portin et al., Reference Portin, Kovala, Polo-Kantola, Revonsuo, Müller and Matikainen2000). Interestingly, our task design controlled for frequency of stimulus presentation, stimulus/task complexity, and information transmission (i.e. task difficulty). It is possible that differences in attention between groups were responsible for differing P3 amplitudes, but this appears unlikely due to our implementation of a 75% catch trial exclusion criterion and a lack of correlation between P3 amplitude and BPRS distractibility ratings.
Alternatively, there is a growing body of work investigating the P3 (referred to as the centroparietal positivity (CPP) in perceptual literature) as a supramodal, higher-order evidence accumulation mechanism (Kelly & O'Connell, Reference Kelly and O'Connell2013; O'Connell, Dockree, & Kelly, Reference O'Connell, Dockree and Kelly2012; Tagliabue et al., Reference Tagliabue, Veniero, Benwell, Cecere, Savazzi and Thut2019; Twomey, Murphy, Kelly, & O'Connell, Reference Twomey, Murphy, Kelly and O'Connell2015). Importantly, Tagliabue et al. (Reference Tagliabue, Veniero, Benwell, Cecere, Savazzi and Thut2019) reported that the CPP is dependent upon subjective perceptual experience (top-down processing) even after controlling for objective stimulus intensity. In the CGCT, SCZ was the only group that failed to significantly modulate P3 amplitude between flanker conditions which, given the CPP literature, may suggest aberrant high-level processing in SCZ. It is possible that SCZ required less top-down processing (smaller P3) to successfully identify the contour with parallel flankers given their diminished surround suppression (i.e. SCZ were less vulnerable to visual clutter created by parallel flankers). Thus, P2 may reflect intermediate-stage visual processing in the occipital cortex while P3 may reflect information accumulation and top-down processes within the parietal-frontal cognitive control network. Specifically in the CGCT, smaller and larger P2 responses may reflect suppression and facilitation of contour perception respectively, while smaller and larger P3 amplitudes may reflect lesser or greater top-down guided accumulation of sensory evidence respectively.
The current study provided novel neurophysiological correlates of well-documented visuoperceptual abnormalities in SCZ. These findings suggest that contour detection performance is affected by at least two distinct factors: an earlier process (P2) related to how local context affects the visibility of the contour, and a later process (P3) reflecting top-down guided reduction of visual clutter to accumulate perceptual evidence of a contour. We also probed the extent to which deficits in contour integration and contextual suppression are specific to SCZ. We found a more subtle deficit in contour detection performance in BP subjects as compared to SCZ that was reflected in intermediate and late latency ERPs. SREL subjects showed generally intact patterns of neural responses during visual contour perception, but did exhibit abnormally weak orthogonal facilitation of contour detection. Together, our findings point to specific neural deficits in later-stage visual processing in SCZ.
Supplementary material
The supplementary material for this article can be found at https://doi.org/10.1017/S0033291719003751.
Acknowledgements
The authors would like to thank Phil Burton for helping with task construction and analysis.
Financial support
This work was supported by a Merit Review Award (#01CX000227 to SRS) from the United States Department of VA Clinical Sciences Research and Development Program and by the National Institute of Mental Health of the National Institutes of Health under Award Numbers R24MH069675 and R01MH112583 to SRS.
Conflict of interest
None.
Ethical standards
The authors assert that all procedures contributing to this work comply with the ethical standards of the relevant national and institutional committees on human experimentation and with the Helsinki Declaration of 1975, as revised in 2008.