INTRODUCTION
Many aspects of parasite dynamics remain unknown. How parasite communities develop and what factors affect the turnover of parasite individuals and species during the lifespan of individual hosts is poorly understood. The most common method in long-term parasite studies is cross-sectional killing of hosts and examination of their gastrointestinal tract. As a result, the parasite studies on temporal changes tend to focus on the component population level (i.e. all the parasite populations in a host population; between-host populations (Bush et al. Reference Bush, Lafferty, Lotz and Shostak1997)), whereas the longitudinal studies on infrapopulations (i.e. parasite populations in individual hosts; within-host populations (Bush et al. Reference Bush, Lafferty, Lotz and Shostak1997)) are limited.
The general expectation is that the distribution of helminth parasites within the host population is overdispersed: many individuals are uninfected or lightly infected while minority of hosts are heavily infected and therefore responsible for a higher proportion of parasite transmission compared with others (Poulin, Reference Poulin1997; Hayward, Reference Hayward2013). Some individuals are simultaneously infected with multiple parasite species and there is also evidence of mixed infections from multiple strains of the same species (Dubey et al. Reference Dubey, Moura, Majumdar, Sundar, Velmurugan, Kwok, Kelly, Krecek and Su2009; Balmer and Tanner, Reference Balmer and Tanner2011; Griffiths et al. Reference Griffiths, Pedersen, Fenton and Petchey2011). Multiple-strain infections with negative effects seem to be common (Balmer and Caccone, Reference Balmer and Caccone2008) for two possible reasons: the so-called ‘vicious cycle’ of individuals in poor health getting infected and interactions between pathogens promoting simultaneous co-infection (Stephenson et al. Reference Stephenson, Latham and Ottesen2000). Co-infections, however, can also lower the total virulence of parasites (Alizon, Reference Alizon2013; Viney and Graham, Reference Viney and Graham2013).
The dynamics of component communities are well studied, but there are conflicting results on the stability of these communities: common helminth species appear to have long-term stability (Haukisalmi et al. Reference Haukisalmi, Henttonen and Tenora1988) and predictability (Behnke et al. Reference Behnke, Bajer, Harris, Newington, Pidgeon, Rowlands, Sheriff, Kuliś-Malkowska, Siński, Gilbert and Barnard2008a ), even over large spatial scales (De Roij and MacColl, Reference De Roij and MacColl2012), but there is also evidence for high turnover in parasite communities (Behnke et al. Reference Behnke, Bajer, Harris, Newington, Pidgeon, Rowlands, Sheriff, Kuliś-Malkowska, Siński, Gilbert and Barnard2008b ; Ebbert et al. Reference Ebbert, McGrew and Marchant2013). Infracommunity studies are uncommon as following the same host individuals over their lifespan is difficult. Despite these difficulties, there have been recent advances: Telfer et al. (Reference Telfer, Lambin, Birtles, Beldomenico, Burthe, Paterson and Begon2010) have shown that there are strong interactions between microparasite species within the infracommunity. Most of the macroparasite studies have concentrated on fecal egg counts (FECs) and hosts’ resistance to helminths. For example, ponies in seminatural settings have strong seasonal variation in FEC and complex within-individual dynamics in shedding of eggs (Wood et al. Reference Wood, Matthews, Stephenson, Slote and Nussey2013). One of the most detailed studies with wild animals was conducted with Soay sheep from St. Kilda (Clutton-Brock and Pemberton, Reference Clutton-Brock, Pemberton, Clutton-Brock and Pemberton2004), mostly on differences in FEC over individual life histories (e.g. Jones et al. Reference Jones, Crawley, Pilkington and Pemberton2005; Hayward et al. Reference Hayward, Wilson, Pilkington, Pemberton and Kruuk2009), but also in succession of nematode infracommunity after anthelminthic treatment (Craig et al. Reference Craig, Jones, Pilkington and Pemberton2009).
The effect of host hibernation on parasite infracommunities is poorly understood. A number of laboratory studies were performed in the early 20th century on helminths (reviewed by Barnes, Reference Barnes1970) with the general result of parasite elimination during host hibernation; however, there is also evidence to the contrary (Chute, Reference Chute1960; Coggings et al. Reference Coggings, Tedesco and Ruppercht1982). Simitch and Petrovitch (Reference Simitch and Petrovitch1954) induced hibernation in European ground squirrel (Citellus citellus) and noted that different helminth species survive for different periods of time. The mucosal lining of intestine atrophies during hibernation (Carey, Reference Carey1990) and the expectation is that available nutrients for helminths are reduced. The immune system seems to be strongly downregulated during host hibernation (Bouma et al. Reference Bouma, Carey and Kroese2010), though some intestinal immune functions are also upregulated (Kurtz and Carey, Reference Kurtz and Carey2007). There seems to be significant differences in the microbiota between active and hibernation seasons, but clear trends have yet to emerge (Sonoyama et al. Reference Sonoyama, Fujiwara, Takemura, Ogasawara, Watanabe, Ito and Morita2009; Carey et al. Reference Carey, Pike, Weber, Turner, Visser, Beijer-Liefers, Bouma, Kroese, Ruf, Bieber, Arnold and Millesi2012). A field study of alpine marmots (Marmota marmota) by Callait and Gauthier (Reference Callait, Gauthier, Heldmaier and Klingenspor2000) showed that helminths can overwinter in an intermediate host or the soil, but some manage to survive in the atrophied intestines of the infected marmots as well. Even bears, which have a higher body temperature than marmots during hibernation, seem to clear parasites prior to hibernation (Gau et al. Reference Gau, Kutz and Elkin1999). Hibernation in tropical regions is common, but it has not been studied in relation to the parasitism (Dausmann et al. Reference Dausmann, Glos, Ganzhorn and Heldmaier2005).
This study describes the temporal changes in the parasite communities of microchip-marked free-ranging rufous mouse lemurs (Microcebus rufus) both at the population-level and by tracking individuals longitudinally. The long lifespan of mouse lemurs in the wild (up to 9 years, Zohdy et al. Reference Zohdy, Gerber, Tecot, Blanco, Winchester, Wright and Jernvall2014.) makes the mouse lemur an eminently suitable system to examine longitudinal patterns in parasite infections. Furthermore, rufous mouse lemurs are facultatively hibernating primates, as individuals in good body condition often hibernate during the dry season (April–September) (Atsalis, Reference Atsalis2008). We studied nematode communities, as the previous studies with different mouse lemur species have shown that most of their gastrointestinal parasites are nematodes (Raharivololona and Ganzhorn, Reference Raharivololona and Ganzhorn2009, Reference Raharivololona and Ganzhorn2010). Due to the ongoing longitudinal study on mouse lemur senescence and for ethical reasons, we were not able to dissect mouse lemurs in order to examine adult nematodes. Instead, we developed an approach to survey fecal samples from recaptured mouse lemurs and identified operational taxonomic units (OTUs) and putative species (PS) of parasites via barcode sequencing of the small ribosomal subunit gene (Blaxter et al. Reference Blaxter, Mann, Chapman, Thomas, Whitton, Floyd and Abebe2005). This non-invasive method should provide a robust estimate of the actual nematode community in the mouse lemurs’ intestines (Gillespie, Reference Gillespie2006; Wilson et al. Reference Wilson, Grenfell, Pilkington, Boyd, Gulland, Clutton-Brock and Pemberton2014).
Our aims were to investigate nematode infection persistence in individual lemur hosts. Specifically we had the following research questions. (i) Is there a successional turnover of nematodes through time in within-host or between-host communities? (ii) Can we characterize the variability of nematode prevalence between or within years? (iii) Do nematode community go extinct during mouse lemur hibernation? We hypothesized that after possible hibernation, the nematode community would start succession from a blank state. This extinction would manifest as substantial differences in parasite communities from year to year. We predicted variation in nematode prevalence between years due to differing biotic and abiotic factors: namely warmer temperatures and higher rainfall should lead to higher prey densities and therefore to higher nematode prevalence. We also predicted an increasing prevalence during trapping seasons due to the succession of infracommunities.
MATERIALS AND METHODS
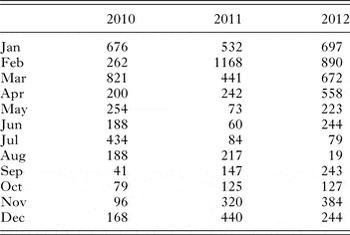
Fecal samples were collected from October 2010 to December 2012 in Ranomafana National Park in Southeastern Madagascar (21°16′S latitude and 47°20′E longitude). Ranomafana National park covers 43 500 ha of lowland to mountainous moist evergreen forest from 500 to 1500 m elevation. The rainy season is from December to March and the dry season from April to August but there is extensive variation in rainfall patterns between years (Table 1). Traps were set on alternating nights at two sites separated by the river Namorona. The first trap site located within the National Park along the Talatakely trail system within an area of secondary forest. The second trap site was located in the peripheral zone of the park in the campsite of Centre Valbio. The second site was cleared and regenerated over 10 years with both endemic and non-endemic trees (Wright and Andriamihaja, Reference Wright, Andriamihaja, Terborgh, van Schaik, Davenport and Rao2002). Trapping sites were separated by a river that is considered to be a dispersal barrier.
Rainfall (mm) in Ranomafana National Park 2010–2012

There were 19 trapping nights (October–November) in 2010, 75 nights in 2011 (September–December) and 85 nights in 2012 (August–December). Mouse lemurs are most active during the mating season and our sampling coincided with this season. Trapping success rates are known to be low in Ranomafana during the dry season when the mouse lemurs are assumed to be hibernating (Atsalis, Reference Atsalis2008). At each site, 50 live traps (22·2 × 6·6 × 6·6 cm; XKL, Sherman Traps Inc., FL, USA) were set along trails in pairs at 50 m intervals. Each trap was placed approximately 1·5 m above the ground on tree branches and baited with fresh banana 1 h before the sunset. The traps were checked 2 h after sunset, the mouse lemurs measured, samples collected and any previously unseen brown mouse lemurs were tagged with microchips (FECAVA Eurochips, Vetcare, Finland) to allow for later identification. The mouse lemurs were released on the same branch they were caught on as soon as possible. The median time from setting the traps to release for any individual was 4 h, while the maximum duration was 8 h.
Animal handling procedures were approved by the trilateral commission (CAFF/CORE) in Madagascar (permits: 115/10/MEF/SG/DGF/DCB.SAP/SCBSE, 203/11/MEF/SG/DGF/DCB.SAP/SCBSE and 203/12/MEF/SG/DGF/DCB.SAP/SCBSE) and the research ethics committee at Viikki campus, University of Helsinki.
DNA extraction
Nematodes were isolated from fecal matter using Baermann's method (Baermann, Reference Baermann1917). We followed the procedure by Gibbons et al. (Reference Gibbons, Jacobs, Fox and Hansen2014) without fixing the samples. Baermannisation has been shown to be less sensitive than other methods, but we found it to be more practical under field conditions (Rinaldi et al. Reference Rinaldi, Maurelli, Musella, Santaniello, Coles and Cringoli2010). Fecal matter was weighed and placed on a tissue (one half of 1-ply Kimwipe, Kimberly-Clark Europe Ltd., Surrey, UK). The tissue was folded, tied with string and placed on a sterile glass funnel with rubber tubing. The tubing was clamped and the funnel filled with 37 °C distilled water. The nematode larvae in the sample hatch and swim out from the sample to the water. After 2 days the clamp was released and the liquid collected in a microcentrifuge tube (2 mL, Sarstedt AG, Nümbrech, Germany). The sample was centrifuged for 5 min at 2800 rcf to collect all the larvae at the bottom of the tube and the supernatant discarded. The resultant pellet was spread over one or two microscope slides, depending on the size of the pellet, and examined under an optical microscope with 100× magnification. We quantified all nematode larvae in the samples twice. If the results differed we used the mean count rounded to nearest whole number. The number of larvae was assumed to be equal to the FEC. The larvae were then stored in 70% ethanol in an 18 °C freezer. We also surveyed a subset of fecal samples (n = 19) after nematode isolation in flotation liquid (concentrated MgSO4 solution) to validate that all nematodes were collected. We did not find any remaining nematode eggs or larvae in the subset.
We performed the following steps on samples containing nematodes in addition to five samples that had no observed nematodes for control purposes. For DNA extraction, the sample was washed with water, incubated for 2 h at room temperature in milliQ water and washed again with water. Cell lysis was performed by incubating the sample overnight in proteinase K and TE buffer at 56 °C. DNA was collected with isopropanol precipitation (Sambrook et al. Reference Sambrook, Fritsch and Maniatis1989) and washed with ethanol twice.
Amplicon amplifying and sequencing
The small ribosomal subunit gene (18S) was amplified using the primers from Bhadury and Austen (Reference Bhadury and Austen2010): 5′-AGRGGTGAAATYCGTGGAC-3′ and 5′-TCTCGCTCGTTATCGGAAT-3′. These primers amplify approximately a region of 450 bp within the 18S gene and are thought to be nematode-specific and universal for all nematodes. Phusion high-fidelity polymerase (Thermo Fisher Scientific, Inc, Waltham, MA, USA) was used with 1–5 μL of template. The PCR program was the following: initial denaturation at 98 °C for 2 min, then 30 cycles of denaturing at 98 °C for 15 s, annealing at 53 °C for 30 s and extension at 72 °C for 30 s and finishing with 10 min of final elongation in 72 °C. The success of PCR was visualized using a 1% agarose gel. The five control samples with no nematodes failed to amplify and were therefore not sequenced.
Amplicons were sequenced at the sequencing facility of Institute of Biotechnology, University of Helsinki using Roche 454 Genome Sequencer FLX. We aimed to produce at least 1500 sequences per sample.
Sequence analysis
Sequence analysis was performed with the Séance bioinformatics pipeline (ver. 0.1) for reference-based phylogenetic analysis (Medlar et al. Reference Medlar, Aivelo and Löytynoja2014). In brief, amplicons with an average quality of less than 25, or length less than 300 bp were discarded. Any reads that contained ambiguous bases, errors in the MID (barcode) or homopolymers longer than 8 bp were similarly discarded. Denoising was performed on each sample using Ampliconnoise (ver. 1.29) (Quince et al. Reference Quince, Lanzen, Davenport and Turnbaugh2011) and putative chimeric reads were identified using UCHIME (ver. 4.2.40) (Edgar et al. Reference Edgar, Haas, Clemente, Quince and Knight2011). All amplicons were then truncated to 250 bp.
After preprocessing, reads with a copy number greater than 5 were clustered into OTUs at 99% similarity. OTUs were labelled by performing a MegaBLAST search of the NCBI NR (non-redundant) database using the centroid sequence of each cluster as the query. Taxonomic labels were derived from the lowest common ancestor from the NCBI taxonomy of the top scoring BLAST hits. Clusters containing sequences from less than two samples were discarded.
Phylogenetic analysis was performed using Séance's phylogenetic placement approach. A reference phylogeny was inferred using RAxML (ver. 7.2.8) (Stamatakis, Reference Stamatakis2006) on the full-length rRNA 18S gene sequences from all 1320 nematode species found in the SILVA database (Small subunit reference version 115) (Quast et al. Reference Quast, Pruesse, Yilmaz, Gerken, Schweer, Yarza, Peplies and Glöckner2013). Séance uses the Pagan multiple sequence aligner (ver. 0.55) (Löytynoja et al. Reference Löytynoja, Vilella and Goldman2012) to extend the reference phylogenetic tree with the cluster centroid sequences.
We used both the OTU labels and phylogenetic placement-derived phylogeny to identify putative species. OTUs with non-nematode labels were removed. All nematode OTUs co-occurring with dipteran contamination were deemed to be a contamination due to parasites of dipterans laying eggs in samples during the nematode isolation by Baermann's method. OTUs with the same labels were merged into putative species: these often had ‘head-tail’ structure with one highly prevalent OTU co-occurring with several lower abundance OTUs.
Statistical testing
Parasite prevalence was tested with a logistic regression model where year, site and sex were independent variables. As we have repeated captures from the same individuals, we needed to use generalized estimating equations (Liang and Zeger, Reference Liang and Zeger1986). The FEC data and the number of putative species were transformed to van der Waerden normal scores to allow for using ANOVA for comparisons of year, sex and site effects (Conover, Reference Conover1999).
The mean first date of capture was tested with repeated measures ANOVA as the data was normally distributed and there were no signs of heteroscedasticity. The infection probability on the first catch was tested with logistic generalized estimating equations with year, site, sex and date used as independent variables.
For individual case histories, all the individuals caught at least twice in consecutive years with successful sequencing were considered. The random distribution of infection among the individuals was tested by calculating the number of times each putative species was found in each individual and randomizing this to all years. The individuals which had the same status, either presence or absence of a given putative species, was calculated for both, this was performed for 1000 iterations. The proportion of iterations with greater than or equal to the number of uniform pairs compared with the actual data was calculated. This proportion shows the possibility of having the current or stronger aggregation by chance.
We used two different approaches to test the putative species co-occurrence following the methods used by Fenton et al. (Reference Fenton, Knowles, Petchey and Pedersen2014). First, we did a χ 2-test to see if the patterns of occurrence in putative species differ from being randomly distributed. To take into account pseudoreplication due to the repeated samples from the same individuals, we chose from every individual one sample at random, tested the distribution and iterated it this procedure 100 times. To identify any confounding factors, we used longitudinal GLMs with site, sex, year and infection status from the previous month as independent variables and mouse lemur individuals as random effect.
The overdispersion of parasite aggregation was tested with the variance-to-mean ratio and standardized residuals were compared with the χ 2-distribution (Shaw and Dobson, Reference Shaw and Dobson1995). For the repeatability tests, the FEC were log-transformed and 10 added to all values. The repeatability of FEC is the ratio of the between-host variance component to the sum of the between-host and within-host components, also known as the intraclass correlation coefficient (Sokal and Rohfl, Reference Sokal and Rohfl1995).
Statistical tests were run using R together with the stats (R Core Team, 2013), psych (Revelle, Reference Revelle2015), lme4 (Bates et al. Reference Bates, Maechler, Bolker and Walker2014) and geepack (Højsgaard et al. Reference Højsgaard, Halekoh and Yan2006) packages. Graphs were generated using ggplot2 (Wickham and Chang, Reference Wickham and Chang2014). Rarefaction curves were generated using the vegan R package (Oksanen et al. Reference Oksanen, Blanchet, Kindt, Legendre, Minchin, O'Hara, Simpson, Solymos, Stevens and Wagner2013) using subsampling without replacement with 100 permutations (Gotelli and Colwell, Reference Gotelli and Colwell2001). The repeatability ratios were calculated using the R package rptR with an analysis of variance-based test (Nakagawa and Schielzeth, Reference Nakagawa and Schielzeth2010).
RESULTS
Operational taxonomic units
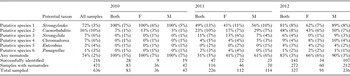
We caught a total of 136 unique individuals, of which 45% were female (Table 2). A total of 636 mouse lemurs’ fecal samples were collected, of which 38% were from females. Sixty per cent of the catches and 65% of unique individuals were from the Talatakely site. A total of 471 samples (74·1% of all samples) were positive for nematodes (Table 3).
The number of samples in the study. Total catches signifies the total sample number for all three trapping seasons (2010–2012), in two sites (Campsite, Talatakely) divided by sexes. Unique individuals means how many different individuals have been caught during that 1 year and individuals caught previous years signify how many of the unique individuals had been caught during previous years. First catch of the season is the mean date for the first catch of individuals: this was significantly later in females (females: Oct 13 vs males Sep 24) and Talatakely (Talatakely Oct 5 vs Campsite Sep 28) site, but there was no difference between years. This was not calculated for 2010 because sampling started later than in other years

The total prevalence of parasitic nematodes and the prevalences of putative species divided by years (2010–2012) and by sexes with the binomial errors. Prevalence percentages refer to all sampled mouse lemurs. Potential taxon is the lowest taxonomical level that the centroid sequence unequivocally belongs to based on BLAST search results

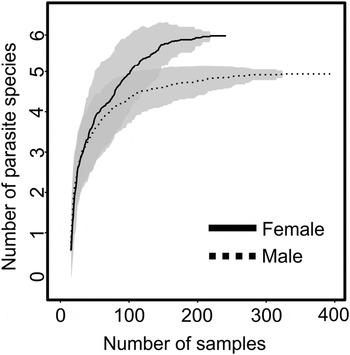
Amplification and sequencing succeeded in 243 samples resulting in 828 333 raw reads. After preprocessing, 511 687 sequences were retained for analysis. These sequences clustered into 29 OTUs. We removed 16 OTUs identified as non-nematodes, 10 of which were dipterans. Two OTUs had their closest match to nematode species known to be parasitic on dipteran parasites and, as they consistently co-occurred with the dipteran contamination, were removed. One OTU was identified as a soil-dwelling nematode species (Bursaphelenchus sp.) and was therefore considered to be contamination. Both Caenorhabditis (2 OTUs) and Panagrellus (1 OTU) clusters were retained despite being soil-dwelling nematodes, as the sequences were only 99% identical to these soil-dwelling taxa. Furthermore, the presence-patterns of Caenorhabditis were consistent with intestinal parasitism: after positive sampling the OTUs were present with probability 0·45 in the successive samples in comparison with 0·35 overall. 12 out of 102 samples with Caenorhabditis and all samples with Panagrellus were collected directly from mouse lemurs without contact to soil-contaminated surfaces. Ultimately, there were 10 OTUs determined to be mouse lemurs’ intestinal parasites, which were merged based on identical labels and phylogenetic placement forming 6 putative species in 216 individual mouse lemurs. The accumulation curve for these putative species is shown in Fig. 1, which shows the number of putative species plateaus in both sexes.
The accumulation curve for the putative parasite species for all samples shows the sampling has been sufficient. The shaded area represents the standard deviation in the random permutations of the data.

The raw sequence data are archived in the Short Read Archive (SRA) under project number SRP042187. The sample metadata is published in Figshare (doi: 10.6084/m9.figshare.1108080) and includes the correspondence between individual sequencing runs in SRA and mouse lemur captures.
Differences in intestinal component community between years, sex and site
At the host population-level, there were 2 highly prevalent putative species, numbered 1 and 2, which occurred every year in both sexes, while the other putative species were much rarer (Table 3). Parasite prevalence differences were statistically significantly across years: the prevalence was highest in 2010, lowest in 2011 (generalized estimating equations; odds ratio to 2010: 0·04, 95% confidence interval 0·003–0·39, Table S1) and relatively low in 2012 (OR: 0·08, CI: 0·007–0·84, Table S1). Males had higher nematode prevalence than females (OR: 2·1, CI: 1·1–3·9, Table S1), while the trapping site did not have a significant effect. The interaction terms were dropped during model selection and we could not test for individual putative species due to low goodness of fit (Tables S2–S8).
There was no significant effects of sex nor site to the number of putative nematode species or to FECs (ANOVA; PS, sex F(1,462) = 0·001, P = 0·972, site F(1,462) = 0·633, P = 0·633, interaction F(1,462) = 0·080, P = 0·777; FEC sex F(1,462) = 0·001, P = 0·972; site F(1,462) = 0·393, P = 0·531, interaction F(1,208) = 2·815, P = 0·0949). The mean number of putative species in all individuals was 1·52 ± 0·77 and the mean FEC 10·44 ± 21·01.
Temporal succession in intestinal nematode component community
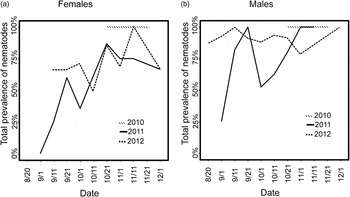
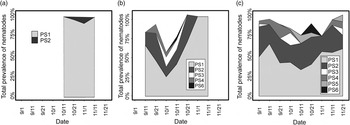
In 2011, there were two distinct peaks in nematode prevalence at the end of September and during November (Fig. 2a and b). This contrasts with 2012 when the peaks were less conspicuous: the parasite prevalence in males peak in mid-September but otherwise stays over 75%. Parasite prevalence in females had an upward trend peaking at 100% in mid-November 2012. In 2010, the trapping season was from mid-October to mid-November, but the prevalence was 100% throughout this period. The seasonal patterns of putative species community differ between the 2 years: the highest diversity of nematodes occurs in 2011 between the two prevalence peaks in early October (Fig. 3b), whereas in 2012 the diversity is more evenly spread over the trapping season (Fig. 3c). The diversity is lower in 2010 with only the most prevalent putative species 1 and 2 present (Fig. 3a). The variation in species number is dependent on the presence of the rare putative species (PS3–6) because PS1 is constantly present, whereas PS2 is absent only in November 2011 (Fig. 3b and c).
Prevalences of nematodes in a) females and b) males for 10-day periods shows differing trends between years. The prevalence is highest in the late season but early season has low prevalence in 2011 and high prevalence in 2012. We had samples for 2010 in only the late season.

Prevalence of different putative species in mouse lemurs for (a) 2010, (b) 2011 and (c) 2012 for the time periods in which we succeeded to sequence more than one fecal sample. The upper limit shows the total prevalence of nematodes and the colored areas show the proportional occurrence of different putative species. PS1 and PS2 are prevalent in all years, whereas the other putative species vary.

There was a statistically significant effect on sex (F(1,117) = 52·305, P < 0·001) and site (F(1,117) = 9·817, P = 0·002) on the first capture of the year (Table 2, Table S9). The lemurs were more likely to be infected on first capture in 2012 (logistic regression model; OR 4·6, CI: 2·0–10·5, Table S10) than in 2011 and the individuals caught previous years were less likely to be infected (OR: 0·33, CI: 0·12–0·97), though the significant interaction between age and sex means the old males were more likely to be infected than young females (OR: 9·3, CI: 2·1–41·0). There were no significant effects of the trapping site or the date of trapping. We did not include 2010 in this analysis due to the trapping starting later in the year.
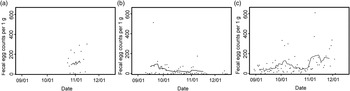
The variation in FEC during the season was high and the temporal trends differed between years: 2011 and 2012 had contrasting trends as FECs peaked early in the season in 2011 (Fig. 4b) and late in 2012 (Fig. 4c). In 2010, FECs were high overall (Fig. 4a).
The fecal egg counts for (a) 2010, (b) 2011 and (c) 2012 vary both in level and in overall trend between years. The daily mean fecal egg counts are plotted and the continuous line signifies the rolling 10-day mean.

Temporal succession of parasite infracommunity in individual mouse lemurs
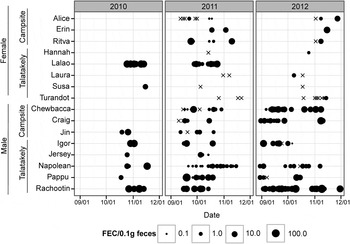
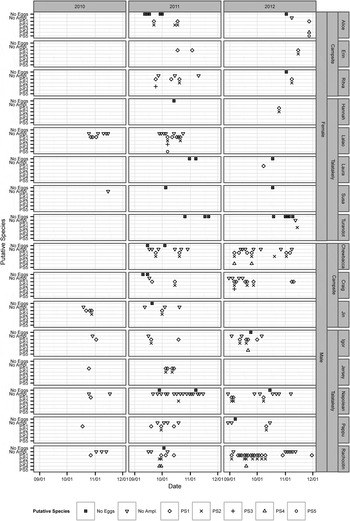
We mapped individual case histories for all lemur individuals caught in two or more years and where we were able to sequence the nematode community (n = 16, Figs 5 and 6). The putative species were randomly distributed (ratio of iterations with greater than or equal pairing 0·498). For single occurrences all of the putative species were uniformly distributed (PS1: 0·118, PS2: 0·500, PS3: 1·000, PS4: 0·338, PS5: 1·000 and PS6: 1·000) (Fig. 6). The infection data were highly redundant: all individuals for whom there were more than 3 successful amplifications, both putative species 1 and 2 were present every year, except for a single individual (Turandot) in 2012.
The temporal variation of fecal egg counts in individuals caught in two or more years is pervasive. Size of circle represents fecal egg counts on logarithmic scale. The crosses represent samplings that had no nematodes present.

The temporal variation in nematode community composition in the individuals caught in two or more years. The uppermost row represents samples which did not have nematodes present, the second uppermost row represents samples which had nematodes but the amplification was not successful and the consequent rows show presence of putative species at time points when the individuals were caught.

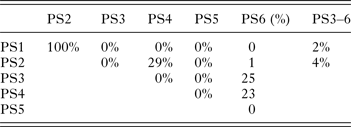
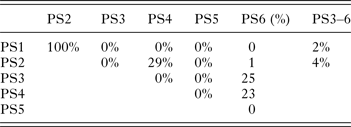
Putative species 1 and 2 were both present in the same samples significantly more often than random (Table 4), while other putative species pairs had much lower proportions of significant results. Previous infection did not seem to facilitate infection though, as there were no significant effects of having previous infection in predicting occurrences of either PS1 or PS2 (Tables S11 and S12).
Pairwise correlation matrix for the putative species. The percentage value is the proportion of iterations found to be significant with a χ 2 test. The only clearly significant correlation in occurrence was between putative species 1 and 2. All correlations were positive
The number of parasite species per host was not aggregated (the variance-to-mean ratio was 0·60, difference from Poisson distribution: χ 2 = 211, P 267 = 0·99) but FECs were strongly aggregated (VMR: 43. χ 2 = 10999, P 524 < 0·001). The within-year repeatability of FECs within individuals was 0·332 (intraclass correlation coefficient, P < 0·001) in 2011, while it was not statistically significantly different from zero in 2012 (P = 0·051) (Fig. 5). We could not perform the analysis for 2010 due to low number of samples.
DISCUSSION
Our data show that the mouse lemur population was parasitized by a relatively small number of intestinal nematode taxa (Table 3). The intestinal nematodes seemed to follow the expected pattern where a few of the parasite species are more abundant and more or less stable, while most of the species are rare (Stear et al. Reference Stear, Bairden, Bishop, Gettinby, Mckellar, Park, Strain and Wallace1998). The saturated species accumulation curve implies that we have adequately sampled the nematode parasites (Fig. 1; Dove and Cribb, Reference Dove and Cribb2006). Our results are not directly comparable with the two previous surveys of mouse lemur parasites conducted by Raharivololona and Ganzhorn (Reference Raharivololona and Ganzhorn2009, Reference Raharivololona and Ganzhorn2010), as the 18S sequences for morphologically identified Malagasy parasites are not available. Nevertheless, the total number of taxa and patterns of infection are similar between studies: both previous surveys found six different species, as we did, and the dominant species remained abundant throughout the survey period. The trapping effort was similar every night so we do not expect sampling bias, but the data from 2010 span a much shorter period than 2011 and 2012. Thus it is more difficult to make inferences regarding the situation in 2010.
Apart from the stable occurrence of putative species 1 and 2 in the component community, there were no sustained trends in the occurrence of putative species. In 2010, the parasite diversity was low throughout the trapping period, in 2011 the parasite diversity was the highest during the mating season in October, but in 2012 the rare putative species were present throughout the trapping period with no overall change in parasite diversity (Fig. 3c). The most abundant parasite, putative species 1, identified as belonging to the genus Strongyloides, appeared with high prevalence throughout the study. One potential reason for the high prevalence of Strongyloides is their free-living stage in the soil (Sandground, Reference Sandground1926), thus having a reservoir stage capable of infecting active mouse lemurs. Strongyloides is also capable of autoinfection to sustain their population (Nishigori, Reference Nishigori1928). Whilst not a perfect match, putative species 2 was highly similar to the soil-living Caenorhabditis elegans. The infections of putative species 2 were sustained and also occurred in cases where the feces were collected directly from mouse lemurs without contact with the soil. We therefore hypothesize that putative species 2 is a parasitic species from the family Rhabditidae (Anderson et al. Reference Anderson, Chabaud and Willmott2009).
Of the rare nematodes, putative species 3 was identified as belonging to the suborder Strongylida and putative species 4 to the species-rich class Chromadorea. Both of these taxons contain major groups of diverse parasitic nematodes (Anderson et al. Reference Anderson, Chabaud and Willmott2009). It is therefore difficult to speculate about their transmission mode. Putative species 5, identified as Enterobius is a genus known to infect primates. The typical transmission happens via the fecal–oral route but the species is also autoinfecting (Anderson et al. Reference Anderson, Chabaud and Willmott2009). Putative species 6 was a similar case to putative species 2 with closest sequence similarity to Panagrellus, a free-living nematode. This putative species could represent a parasitic species from the family Panagrolaimidae. The rare occurrence of these putative species could be caused by seasonal elimination of nematodes by mouse lemurs’ hibernation and weak infection in relation to the Strongyloides that has a free-living stage. Mouse lemurs rarely eat animals other than insects (Atsalis, Reference Atsalis2008), so parasites with indirect life cycles should be limited to those having insects as intermediate hosts.
The co-occurrence of putative species 1 and 2 was positively correlated (Table 4), but it is difficult to say whether this due to a species interaction as observational correlations are highly unreliable (Fenton et al. Reference Fenton, Knowles, Petchey and Pedersen2014). The current infection status was not significantly related to the infection status during the previous month, so there does not seem to be facilitation of infection between these species. Co-occurrence can be also due to factors other than parasite interaction, like heterogeneities among the sampled host population (Fenton et al. Reference Fenton, Viney and Lello2010).
Rainfall could explain the lower parasite prevalence in 2011 compared with 2012 (Fig. 2a and b). The rainfall from March to September was much lower in 2011 than in 2012 (1263·5 mm vs 2038·1 mm, Table 1). High rainfall has been shown to result in high insect abundance and high presence of insects in mouse lemur diets (Atsalis, Reference Atsalis2008). As juvenile lemurs are unlikely to go into prolonged hibernation because of their low-fat reserves (Atsalis, Reference Atsalis2008), their parasite levels might have stayed high all through the dry season, ensuring high parasite load at the start of the trapping season (Fig. 4c). The prevalence data for 2010 are not as reliable because they do not cover as long a time period, but rainfall during March–September was 2126 mm which supports our explanation and suggests that rainfall patterns during the dry season can lead to higher parasite prevalence.
There were both similarities and differences between sexes. Both FEC and parasite diversity were highly similar between males and females. This could be partly due to mouse lemur females and males having similar testosterone levels (Zohdy et al. Reference Zohdy, Gerber, Tecot, Blanco, Winchester, Wright and Jernvall2014). The effect of testosterone has been implicated as one of the main reasons males generally have lower immunocompetence (Klein, Reference Klein2004) and thus similar levels of testosterone can reduce differences in immunocompetence. The main difference between sexes was that nematode prevalence was higher in males in the early season (Fig. 2b). This is likely due to the sex-dependent activity patterns: the mean first catch of males was 3 weeks earlier than females (Table 2). Our first catch dates of females are similar than in previous studies (Atsalis, Reference Atsalis2008). The males are expected to wake up already in August as the early male activity is due to them preparing for the mating season (Atsalis, Reference Atsalis2008). Each individual tended to get nematodes quite quickly (Fig. 6), but the overall prevalence did not rise uniformly during the season as compared with beginning of the season. This is probably due to the staggered activity start times as well, and is suggestive that the drop in prevalence seen during October 2011 could be due to older individuals waking up from hibernation later than younger individuals (Fig. 2b).
While we expected that the mouse lemurs caught early in the season would not have nematode infection due to the nematode extinction during hibernation, the patterns were inconclusive (Fig. 5). Six out of 32 (19%) yearly capture series with nematodes, lacked nematodes in their initial capture (Fig. 5). It is perhaps noteworthy that four cases were old females that generally hibernate longer than males (Atsalis, Reference Atsalis2008). A previous study on grey mouse lemurs by Raharivololona and Ganzhorn (Reference Raharivololona and Ganzhorn2010) in Southern Madagascar has shown significantly lower parasite loads during the cold season, but this cannot be currently determined for our study animals due to them not going to traps during the hibernation season. Moreover, because our data were based on fecal samples, there remains a possibility that nematodes themselves, while surviving in the host, were dormant during hibernation.
There was remarkable variation in parasite presence in individual mouse lemurs through time: on some recaptures some lemur individuals did not shed any eggs though they had previously been infected (Fig. 6: e.g. Chewbacca in 2011) and some infections were present only ephemerally (Fig. 6: e.g. Rachootin in 2011). We could not verify the ground truth of whether these were actual changes in species composition or if this was only due to irregular egg shedding. Regardless, our findings highlight the fact that a single fecal sampling cannot be used as a representative of the total parasite diversity of a host species. Also, the distribution of putative species between hosts was not significantly different from a random distribution. Due to small sample size, it is difficult to draw conclusions, but this might be indicative of quite small differences in mouse lemurs’ susceptibility to the parasites studied.
We could not survey the adult parasites (see above) but had to use their eggs and larvae as a proxy. There is always a time lag between the infection and the start of egg shedding (Craig et al. Reference Craig, Pilkington and Pemberton2006), which is not known for these parasites. There is also heterogeneity in egg shedding depending on the host and parasite individuals (Grenfell et al. Reference Grenfell, Wilson, Isham, Boyd and Dietz1995; Dreyer et al. Reference Dreyer, Fernandes-Silva, Alves, Rocha, Albuquerque and Addiss1996; Uparanukraw et al. Reference Uparanukraw, Phongsri and Morakote1999) that may have an effect on the presumed correlation between appearance of eggs and larvae and the presence of adult nematodes. Thus, the egg counts do not necessarily represent the ratios of different species (Dobson, Reference Dobson1986) or infection intensity (Gillespie, Reference Gillespie2006). Nevertheless, as we only used the eggs as an indicator of presence, our results should be relatively accurate, only slightly underestimating the parasite prevalence. Also, our low measure of repeatability was comparable with that of a previous study (Fig. 5, Stear et al. Reference Stear, Bishop, Duncan, Mckellar and Murray1995).
Our study demonstrates the difficulty of collecting a sample size large enough for understanding parasite dynamics. The success rate for our method was low and highlights the problems experienced working with the minute amounts of DNA obtainable from nematodes in fecal matter. These issues will be discussed in detail elsewhere (high-throughput barcoding of fecal samples identifies the composition of parasitic nematode communities, Aivelo et al. in preparation). There is a clear need for further studies on multiple-parasite systems as the effects of parasite dynamics on their hosts can be as significant as the more commonly considered factors such as season or host age (Telfer et al. Reference Telfer, Lambin, Birtles, Beldomenico, Burthe, Paterson and Begon2010). The intestinal parasite community dynamics of mouse lemurs might be driven by the stability of Strongyloides infections as the temporally persistent parasites are expected to have the strongest influence on temporal dynamics of host–parasite interactions (Pilosof et al. Reference Pilosof, Fortuna, Vinarski, Korallo-Vinarskaya and Krasnov2013). Stear et al. (Reference Stear, Singleton and Matthews2011) have attributed similar findings of a robust nematode community in lambs as evidence for a long co-evolution between host and parasite.
In summary, we uncovered pervasive turnover and variation in egg shedding in infracommunities of mouse lemurs’ intestinal nematode parasites using barcoding of nematode larvae collected non-invasively from fecal samples. The component community remained remarkably stable both within and between years due to two abundant putative species, but there were differences in the patterns of prevalence between years.
SUPPLEMENTARY MATERIAL
To view supplementary material for this article, please visit http://dx.doi.org/10.1017/ S0031182015000438.
ACKNOWLEDGEMENTS
The authors thank the two anonymous reviewers for their comments. The authors also wish to thank the Madagascar National Parks, Madagascar Institute pour la Conservation des Ecosystèmes Tropicaux and the Institute for the Conservation of Tropical Environments and research station Centre Valbio for the logistical support, Andry Herman Rafalinirina, Victor Rasendry and Hannah Price for the help in the field work, Ritva Rice, Agnes Viherä and Raija Savolainen for assistance in the laboratory work, Lars Paulin in the BI sequencing laboratory and Jani Anttila for useful discussions.
FINANCIAL SUPPORT
This work was supported by grants from Suoma Loimaranta-Airila Fund, Research Foundation of Helsinki University, Otto A. Malm Foundation and Oscar Öflund Foundation to T.A. and Academy of Finland to J.J.