Introduction
Unprecedented impacts on the boreal biome are expected from global climate change in the 21st century (Gauthier et al. Reference Gauthier, Bernier, Kuuluvainen, Shvidenko and Schepaschenko2015). Average annual temperatures in the region are already up 1.5 °C and are expected to rise by another 4 °C to 11 °C by the century’s end. There is evidence that in Northern Europe, the temperature increase will have a beneficial effect on forest productivity in the northernmost (cooler) and wetter locations, while in southern (warmer), drier areas, effects on productivity will be negative (Ruiz-Pérez & Vico Reference Ruiz-Pérez and Vico2020). Soil water availability plays a key role in the boreal forests’ productivity. In Eastern Fennoscandia conditions, an increase in annual precipitation has been observed in all seasons since the beginning of the century (Nazarova Reference Nazarova2022). Biodiversity, species population dynamics, and phenology will be significantly impacted by these changes. The main threats that apply to biodiversity generally also apply to lichens (Scheidegger & Werth Reference Scheidegger and Werth2009).
Being poikilohydric organisms, lichens are unable to actively regulate their thallus water content (Proctor & Tuba Reference Proctor and Tuba2002). Ambient water availability has a significant impact on many lichen physiological processes, including growth and reproduction (Gauslaa Reference Gauslaa2014). Studies show that many lichen-forming fungi and their photobionts are adapted to repeated wetting and drying cycles (Honegger Reference Honegger, Gadd, Watkinson and Dyer2007).
Lichen distribution is also influenced by factors other than climatic conditions, particularly the substratum availability, which is important for epiphytic species. Currently in boreal forests, due to the increase in average annual temperatures, there has been a migration of temperate deciduous tree species northwards (Boisvert-Marsh et al. Reference Boisvert-Marsh, Périé and de Blois2014), as well as an increase in forest productivity (Kauppi et al. Reference Kauppi, Posch and Pirinen2014; Gauthier et al. Reference Gauthier, Bernier, Kuuluvainen, Shvidenko and Schepaschenko2015). The distribution of epiphytic lichen species in boreal ecosystems may be significantly impacted by these changes. Thus, long-term studies of epiphytic lichen populations from permanent plots in this northern (range-edge) region could contribute to information on species’ responses to climate change and would also make it possible to predict further adjustments within cenopopulations (i.e. the total individuals of a species within a single community of interacting organisms, or cenosis).
Lobaria pulmonaria (L.) Hoffm. is one of the model species in ecophysiological, ecological and conservation biological research (Scheidegger & Werth Reference Scheidegger and Werth2009; Frati & Brunialti Reference Frati and Brunialti2023; Ravera et al. Reference Ravera, Benesperi, Bianchi, Brunialti, Di Nuzzo, Frati, Giordani, Isocrono, Nascimbene and Vallese2023). It also often serves as an indicator species for natural forest landscapes (Scheidegger & Werth Reference Scheidegger and Werth2009). This cephalolichen grows on tree bark or mossy rocks, usually in old-growth forests characterized by ecological continuity. Due to air pollution and intensified forest management, the species’ abundance has declined in Europe over the past century (Scheidegger & Werth Reference Scheidegger and Werth2009; Paoli et al. Reference Paoli, Benesperi, Fačkovcová, Nascimbene, Ravera, Marchetti, Anselmi, Landi, Landi and Bianchi2019; Frati & Brunialti Reference Frati and Brunialti2023). Studies conducted in Italy have shown that climate change will have a negative impact on L. pulmonaria in the region (Benesperi et al. Reference Benesperi, Nascimbene, Lazzaro, Bianchi, Tepsich, Longinotti and Giordani2018; Nascimbene et al. Reference Nascimbene, Benesperi, Casazza, Chiarucci and Giordani2020). Modelling studies in Italy suggest that climate warming in arid regions would negatively affect the survival and development of young L. pulmonaria thalli (Di Nuzzo et al. Reference Di Nuzzo, Canali, Giordani, Nascimbene, Benesperi, Papini, Bianchi and Porada2022).
In 2014–2015, a series of permanent sample plots was established in Eastern Fennoscandia (Karelia) to study L. pulmonaria population characteristics (Ignatenko & Tarasova Reference Ignatenko and Tarasova2018, Reference Ignatenko and Tarasova2020). The dynamics of the species’ cenopopulations over a long period of time can be assessed using these baseline data. It is important to note that the northern part of this same region is the boundary of the L. pulmonaria range in Russia. Thus, on the Kola Peninsula, the lichen is very rare (Asming et al. Reference Asming, Belkina, Berlina, Bianki, Bobrov, Borovichev, Boyko, Demakhina, Denisov and Drugova2014) compared to the adjacent territories of Karelia (Artemyev et al. Reference Artemyev, Baryshev, Boychuk, Borovichev, Vetchinnikova, Gnatyuk, Gorbach, Danilov, Dyachkova and Efremov2020). One of the largest reserves of the species in the northern taiga subzone is located in the Paanajärvi National Park. In 2021, we conducted a repeated survey of L. pulmonaria cenopopulations on four permanent sample plots and quantified the content of the essential elements (C, N, P, S, K, Na, Ca, Mg, Cu, Fe, Mn, Zn) in thalli of different ontogenetic states, as well as in the bark of its host trees (Ignatenko et al. Reference Ignatenko, Nikerova and Ignatenko2024). The objective of this study was to document and analyze how the populations of L. pulmonaria have changed over the six-year period from 2015–2021.
Materials and Methods
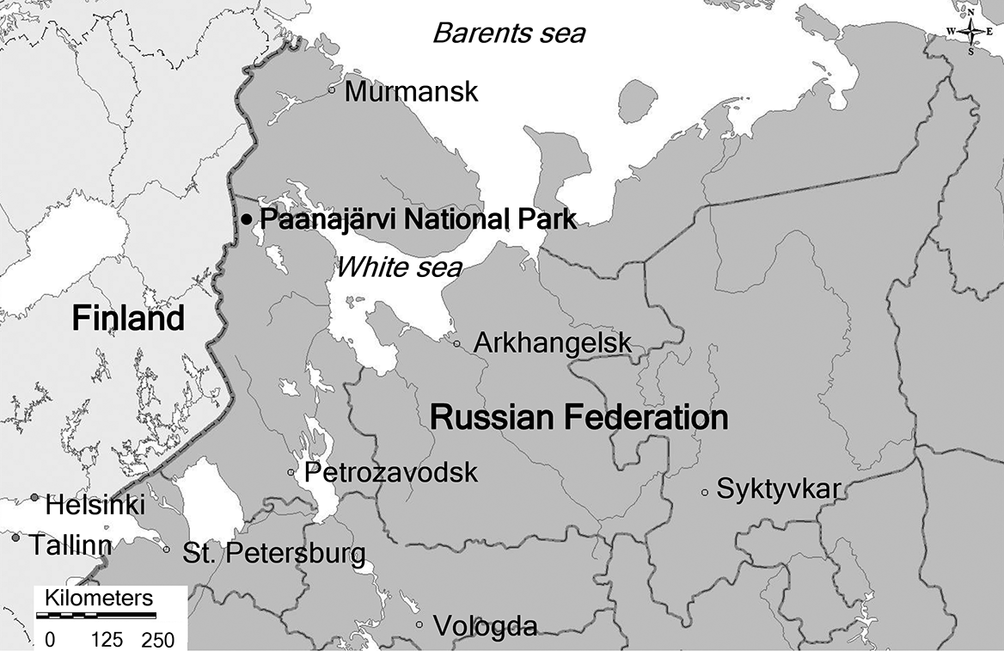
Paanajärvi National Park (area c. 1040 km2, founded in 1992) is in the north of Karelia (Russia) near the border with Finland (Fig. 1). This is the highest altitude part of the region, being composed of a plateau raised 200–300 m above sea level, bordered by separate mountain ranges where the highest mountain, Nuorunen, reaches 577 m (Gromtsev & Litinsky Reference Gromtsev and Litinsky2003).
The location of the study area (Paanajärvi National Park, Republic of Karelia, Russian Federation).

Figure 1. Long description
Anchored at the northwest, a bold dot marks Paanajärvi National Park near the Finland-Russian Federation border. To the west is Finland, with Helsinki labeled in the southwest. Southeast of the park is Petrozavodsk, further south is St. Petersburg, and to the east is Syktyvkar. North of the park is Murmansk, with the Barents sea above and the White sea to the east. Arkhangelsk is southeast of the White sea. The map outlines the Russian Federation, Finland, and Estonia, with Tallinn labeled in the southwest. A scale bar in the lower left shows distances up to 250 kilometers. Country borders are bold, and water bodies are shaded light gray.
The territory of the national park is located on the crystalline basement of the Fennoscandian shield. The complex geological structure has shaped a rugged topography and varied soil conditions. The denudation-tectonic low-mountain type of northern taiga landscape with a predominance of spruce occupies the entire park (Gromtsev & Litinsky Reference Gromtsev and Litinsky2003).
Paanajärvi National Park’s vegetation cover is mostly undisturbed, with little human impact. Locally, however, in the 19th and early 20th centuries, some forest was cut down along the shores of Lake Paanajärvi and the Olonga River, and there was slash-and-burn agriculture and more than a dozen villages and farmsteads. In their place, secondary birch forests formed, and small areas of meadows have been preserved (Elina & Kuznetsov Reference Elina and Kuznetsov2003).
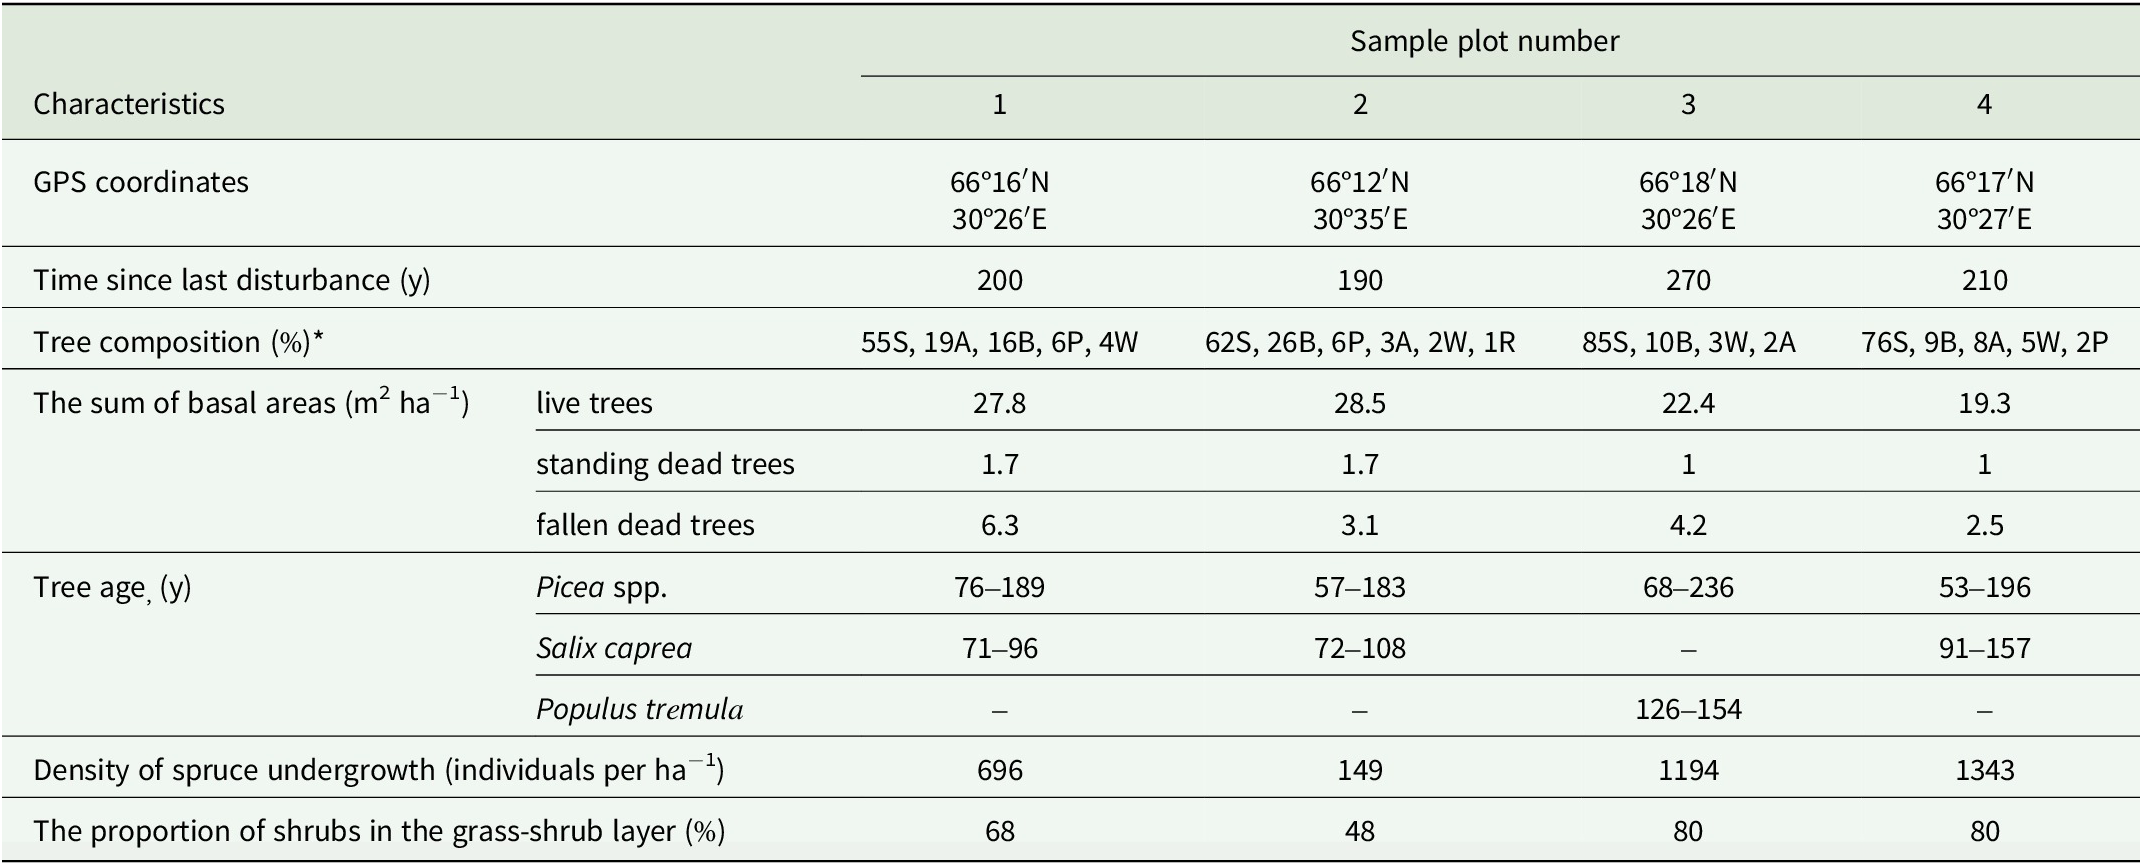
Data collection was carried out using a network of permanent sample plots (SP) measuring 1 ha, laid out according to standard geobotany protocols (Andreeva et al. Reference Andreeva, Bakkal, Gorshkov, Lyanguzova, Maznaya, Neshataev, Neshataeva, Stavrova, Yarmishko and Yarmishko2002) during the growing period of 2015 (Ignatenko & Tarasova Reference Ignatenko and Tarasova2020) and then again, from the exact same plot locations, in 2021. Four sample plots were selected in spruce forests with no major disturbances during the last 190 to 270 years (Table 1). The selection of locations for sample plots was based on a study of topographic maps, forest management plans and satellite images, as well as on the results of preliminary studies, where the presence of L. pulmonaria thalli was assessed. One of the criteria for selecting a forest community for sample plot establishment was the presence of L. pulmonaria thalli.
Characteristics of the studied forest communities of sample plots at Paanajärvi National Park, Republic of Karelia, Russian Federation.

Table 1. Long description
The table has columns for characteristics and four sample plots, numbered 1 to 4. GPS coordinates are: plot 1 at 66 degrees 16 minutes North, 30 degrees 26 minutes East; plot 2 at 66 degrees 12 minutes North, 30 degrees 35 minutes East; plot 3 at 66 degrees 18 minutes North, 30 degrees 26 minutes East; plot 4 at 66 degrees 17 minutes North, 30 degrees 27 minutes East. Time since last disturbance in years: plot 1 is 200, plot 2 is 190, plot 3 is 270, plot 4 is 210. Tree composition percentages use S for spruce, A for European aspen, W for goat willow, B for birch, P for Scots pine, R for rowan. Plot 1: 55S, 19A, 16B, 6P, 4W. Plot 2: 62S, 26B, 6P, 3A, 2W, 1R. Plot 3: 85S, 10B, 3W, 2A. Plot 4: 76S, 9B, 8A, 5W, 2P. Sum of basal areas in square meters per hectare for live trees: plot 1 is 27.8, plot 2 is 28.5, plot 3 is 22.4, plot 4 is 19.3. For standing dead trees: plot 1 is 1.7, plot 2 is 1.7, plot 3 is 1, plot 4 is 1. For fallen dead trees: plot 1 is 6.3, plot 2 is 3.1, plot 3 is 4.2, plot 4 is 2.5. Tree age in years for Picea species: plot 1 is 76 to 189, plot 2 is 57 to 183, plot 3 is 68 to 236, plot 4 is 53 to 196. For Salix caprea: plot 1 is 71 to 96, plot 2 is 72 to 108, plot 3 is not present, plot 4 is 91 to 157. For Populus tremula: plot 1 and 2 are not present, plot 3 is 126 to 154, plot 4 is not present. Density of spruce undergrowth in individuals per hectare: plot 1 is 696, plot 2 is 149, plot 3 is 1194, plot 4 is 1343. Proportion of shrubs in the grass-shrub layer in percent: plot 1 is 68, plot 2 is 48, plot 3 is 80, plot 4 is 80.
*Note: tree species, S = spruce (Picea spp.), A = European aspen (Populus tremula), W = goat willow (Salix caprea), B = birch (Betula spp.), P = Scots pine (Pinus sylvestris), R = rowan (Sorbus aucuparia ).
On each sample plot, geobotanical descriptions were noted, including the determination of general characteristics of forest communities, demographic parameters of the forest stand and individual trees, as well as a description of L. pulmonaria lichen thalli on the trunks. We studied only thalli > 1 cm2 on all substrata at a height of 0–2 m from the ground. The following characteristics of microhabitats were noted for thallus locations: trunk aspect (measured using a compass); height above the ground (measured using a tape measure); the inclination angle of the trunk surface (measured using a mountain compass). Using a 25 × 25 cm frame, the total area and necrotic area (cm2) for each thallus was marked, together with their ontogenetic states (Ignatenko et al. Reference Ignatenko, Tarasova and Markovskaya2020). The thalli in these ontogenetic states were characterised as: virginal 1 (v1), virginal 2a (v2a), virginal 2b (v2b), virginal 2c (v2c), fertile (fert), subsenile (s/sen) and senile (sen). Virginal 1 thalli have an adult shape, well-formed lobes with pitted depressions and ridges, with no soredia or other reproductive structures. The thalli range in size from 1.3 to 40 cm2, with a median of 3 cm2. In the series from virginal 2a to virginal 2c, the thalli increase in size, and the number of soralia on their surface increases, first along the edges and then along the internal ribs of the thallus. The thallus size in virginal 2a ranges from 3 to 119 cm2, with a median of 19 cm2; virginal 2b ranges from 19–330 cm2, with a median of 56 cm2; virginal 2c from 56–975 cm2, with a median of 340 cm2. Fertile thalli are large (median thalli area 856 cm2) with apothecia and many soralia. In the subsenile state, part of the thallus is destroyed; in the old areas there are isidia and lobules (regenerative structures that spread poorly), and in the senile state the thallus disintegrates, and many necrotic formations are observed on the remaining parts (Ignatenko et al. Reference Ignatenko, Tarasova and Markovskaya2020, Reference Ignatenko, Nikerova and Ignatenko2024). Subsenile thalli range in size from 6–1180 cm2, with a median of 75 cm2. Senile thalli range in size from 2–720 cm2, with a median of 30 cm2.
All statistical analyses were performed using PAST (version 4.0). The Shapiro-Wilk W-test was used to evaluate the type of data distribution. The statistical analysis was carried out using the Kruskal-Wallis test to determine analysis of variance (ANOVA), followed by paired comparison using the Bonferroni-adjusted Mann-Whitney U-test. All data in the diagrams and tables are presented as the mean and standard deviation (for normal data distribution) or the median, 25th and 75th percentiles (for non-normal data distribution). All graphs were created using Microsoft Excel 2020. Different letters show statistically significant differences at P < 0.05.
Statistical data analysis was also performed in the R environment using the following packages: tidyverse (Wickham et al. Reference Wickham, Averick, Bryan, Chang, McGowan, François, Grolemund, Hayes, Henry and Hester2019) for data manipulation, lme4 (Bates et al. Reference Bates, Mächler, Bolker and Walker2015) for linear mixed models, glmmTMB (McGillycuddy et al. Reference McGillycuddy, Warton, Popovic and Bolker2025) for generalized linear mixed models, DHARMa (Hartig Reference Hartig2016) for model diagnostics, vegan for multivariate analysis (Oksanen et al. Reference Oksanen, Simpson, Blanchet, Kindt, Legendre, Minchin, O’Hara, Solymos, Stevens and Szoecs2025), emmeans for post-hoc comparisons (Lenth Reference Lenth2017), and car for ANOVA tests (Fox & Weisberg Reference Fox and Weisberg2019).
For the thallus abundance analysis, generalized linear mixed models (GLMM) with negative binomial distribution were applied to account for overdispersion. Thallus area was analyzed using linear mixed models (LMM) following log-transformation. Models included year and sample plot as fixed effects, with tree identifier as a random effect. Ontogenetic structure was analyzed using permutational multivariate analysis of variance (PERMANOVA) with the Bray-Curtis distance and 9999 permutations. Post-hoc comparisons were conducted with false discovery rate (FDR) correction (Tukey’s test). Pairwise comparisons of ontogenetic stages between years were performed using Welch’s t-test. Statistical significance was assessed at P < 0.05.
All assays were performed at the Core Facility of the Karelian Research Centre of the Russian Academy of Science.
Results
Thallus sizes and numbers
Over six years, the total number of thalli > 1 cm2 in the four studied plots significantly increased from 321 to 525 (χ2 = 6.99, P = 0.008) (Table 2). From 2015 to 2021, the total thallus area of all individuals increased from 6.009 to 6.462 m2, while the median thallus size declined from 18.8 to 12.5 cm2. On some trunks, some thalli grew very close to each other, making it impossible to identify individuals. We called such a set of thalli a composite individual. The number of composite individuals remained constant at 11 (Table 2).
General characteristics of Lobaria pulmonaria cenopopulations of sample plots at Paanajärvi National Park, Republic of Karelia, Russian Federation.

Table 2. Long description
From left to right, columns are sample plot number, number of substratum units for 2015 and 2021, number of thalli or composite individuals for 2015 and 2021, and total thallus area in square centimeters for 2015 and 2021. Row 1: plot 1, substratum units 15 in 2015 and 14 in 2021, thalli 69 in 2015 and 91 in 2021, thallus area 12,259 in 2015 and 8,577 in 2021. Row 2: plot 2, substratum units 19 for both years, thalli 55/8 in 2015 and 97/8 in 2021, thallus area 30,322 in 2015 and 34,843 in 2021. Row 3: plot 3, substratum units 11 in 2015 and 10 in 2021, thalli 123 in 2015 and 215 in 2021, thallus area 7,359 in 2015 and 8,909 in 2021. Row 4: plot 4, substratum units 10 in 2015 and 11 in 2021, thalli 74/3 in 2015 and 122/3 in 2021, thallus area 10,130 in 2015 and 12,294 in 2021. Composite individuals are noted where thalli could not be distinguished.
*Note: composite individuals are recorded where it was not possible to distinguish individual thalli.
Ontogenetic cenopopulations structure
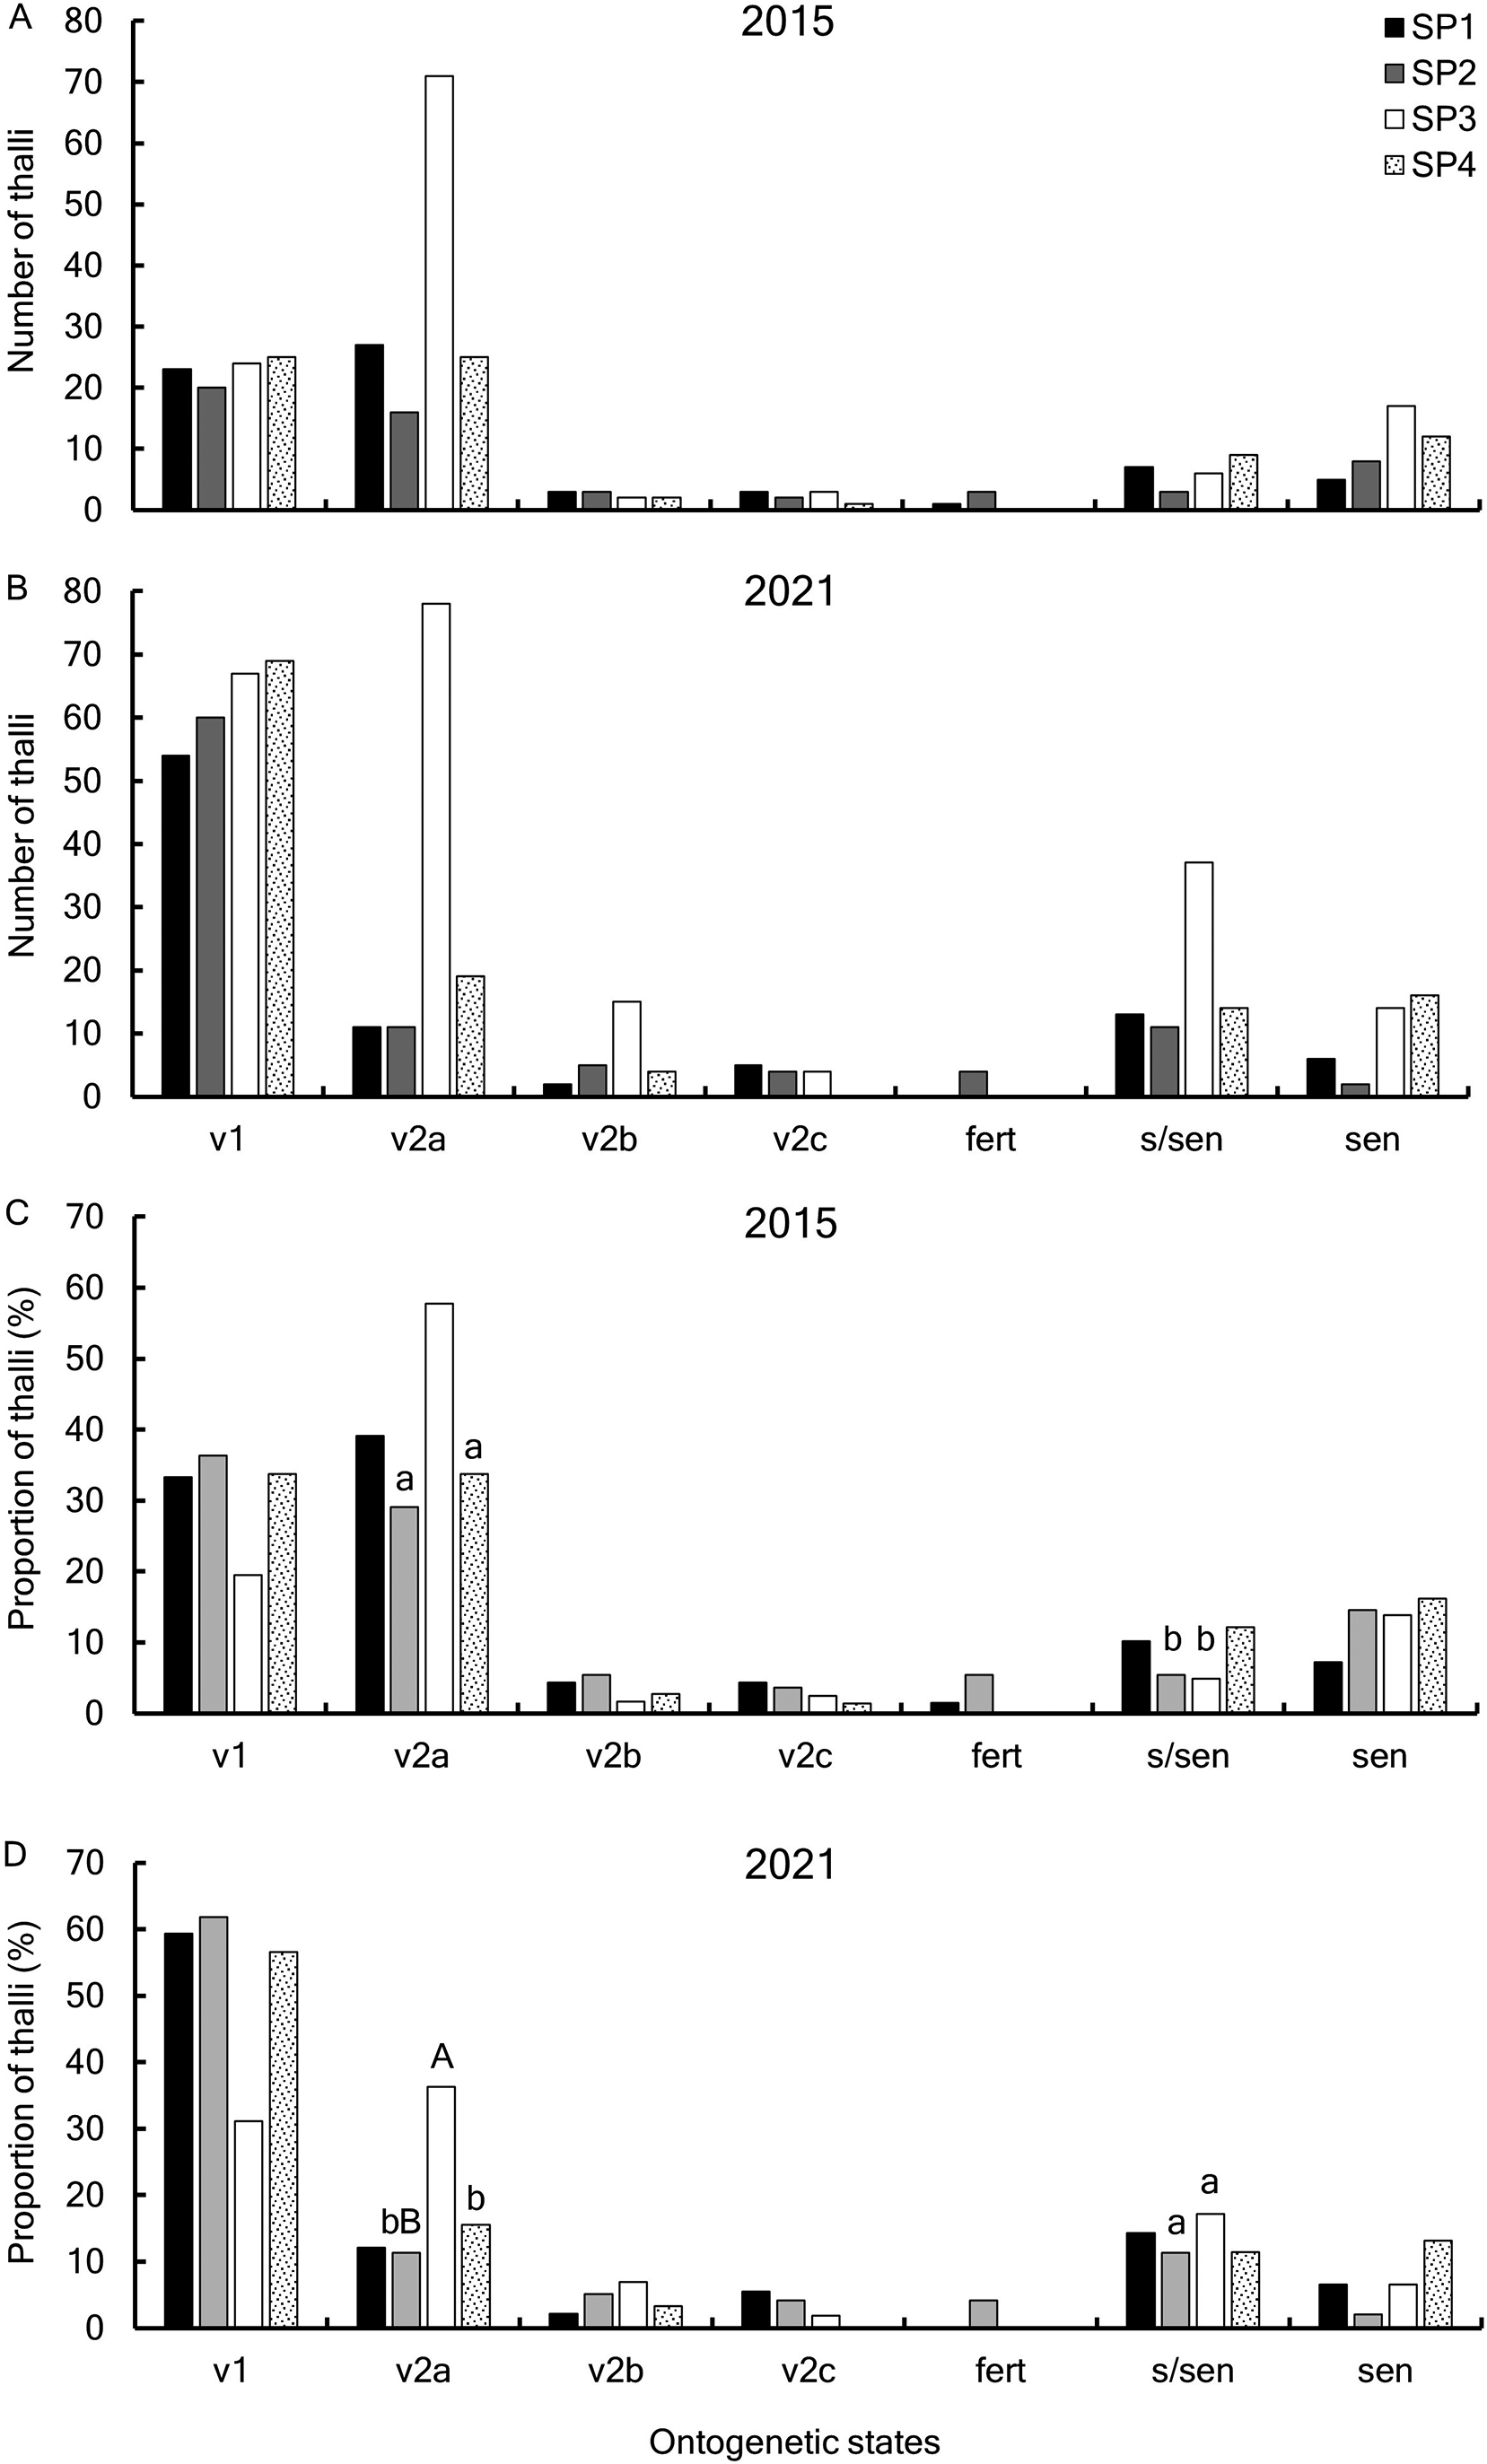
PERMANOVA analysis revealed statistically significant changes (R 2 = 0.119, P = 0.008) in the ontogenetic spectra structure over the past six years only at SP2. Pairwise comparisons between the two years using Welch’s t-test revealed a significant decrease in the portion of virginal 2a (v2a) thalli (P = 0.011) and a significant increase in subsenile (s/sen) thalli (P = 0.030) in SP2 (Fig. 2). In SP3, a significant increase in the portion of subsenile (s/sen) thalli was observed (P = 0.035), while in SP4, a significant decrease in the portion of virginal 2a (v2a) thalli was recorded (P = 0.028). The proportion of thalli producing apothecia (fert) was at a very low level in both years of the study (Fig. 2). Evaluation of individual ontogenetic states at all sample plots using one-way ANOVA showed that there were no statistically significant differences in 2015. In 2021, post-hoc analysis showed that only the proportion of virginal 2a (v2a) thalli was significantly higher in SP3 compared to SP2 (P = 0.006; Fig. 2).
Ontogenetic spectra of Lobaria pulmonaria cenopopulations. A & C, in 2015. B & D, in 2021. SP 1–4 = sample plot numbers from 1 to 4. Ontogenetic states: v1 = virginal 1; v2a = virginal 2a; v2b = virginal 2b; v2c = virginal 2c; fert = fertile; s/sen = subsenile; sen = senile. Small Latin letters indicate statistically significant differences (P < 0.05) between sample plots in different years (within one ontogenetic state). Large Latin letters indicate statistically significant differences (P < 0.05) between sample plots in the same year (within one ontogenetic state).
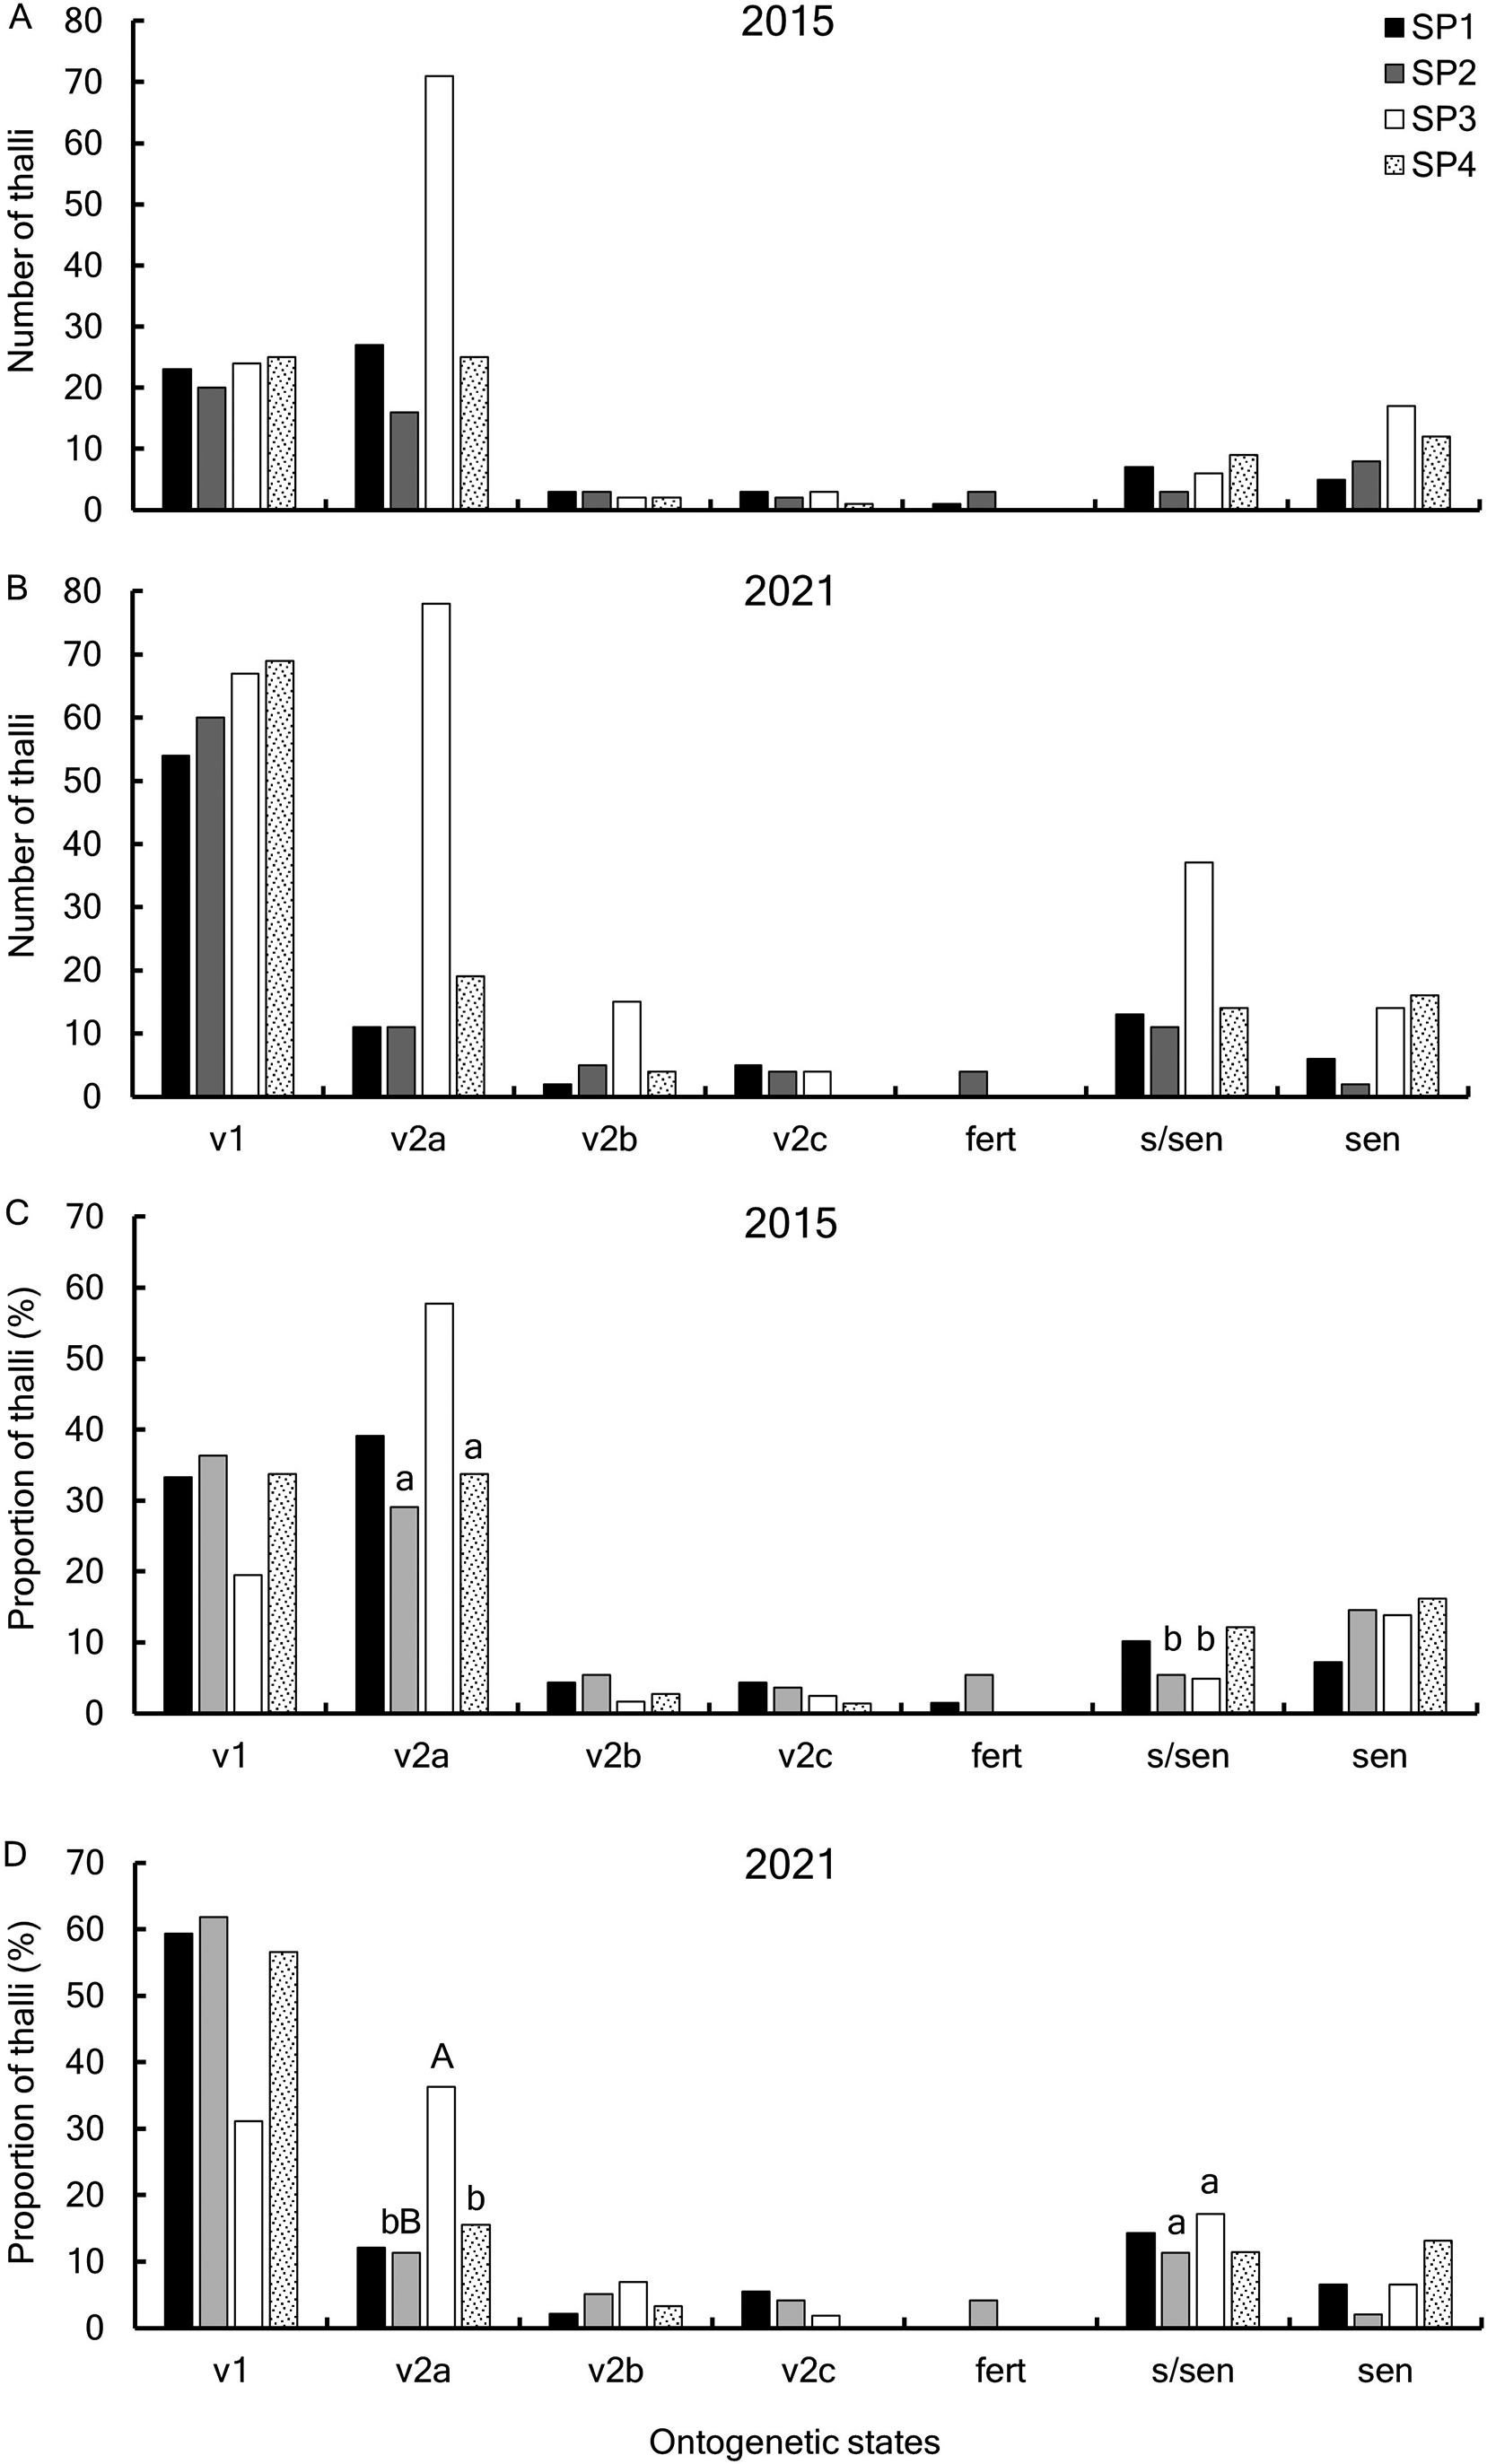
Figure 2. Long description
Top left panel A shows number of thalli for S P 1 to S P 4 in 2015 across ontogenetic states v 1, v 2 a, v 2 b, v 2 c, fertile, s slash sen, and senile. S P 3 has the highest v 2 a count. Top right panel B shows 2021 data, with S P 3 again highest in v 2 a, but s slash senile increases in S P 3. Bottom left panel C shows proportion of thalli for 2015, with S P 3 highest in v 2 a, and small letter a marking significant differences in v 2 a. S P 4 is highest in s slash senile, with b marking significance. Bottom right panel D shows 2021 proportions, S P 4 is highest in v 1, S P 3 in v 2 a, with large A and small b, b B, and a marking significant differences. All panels use the same ontogenetic state categories and sample plot legend.
Substratum confinement
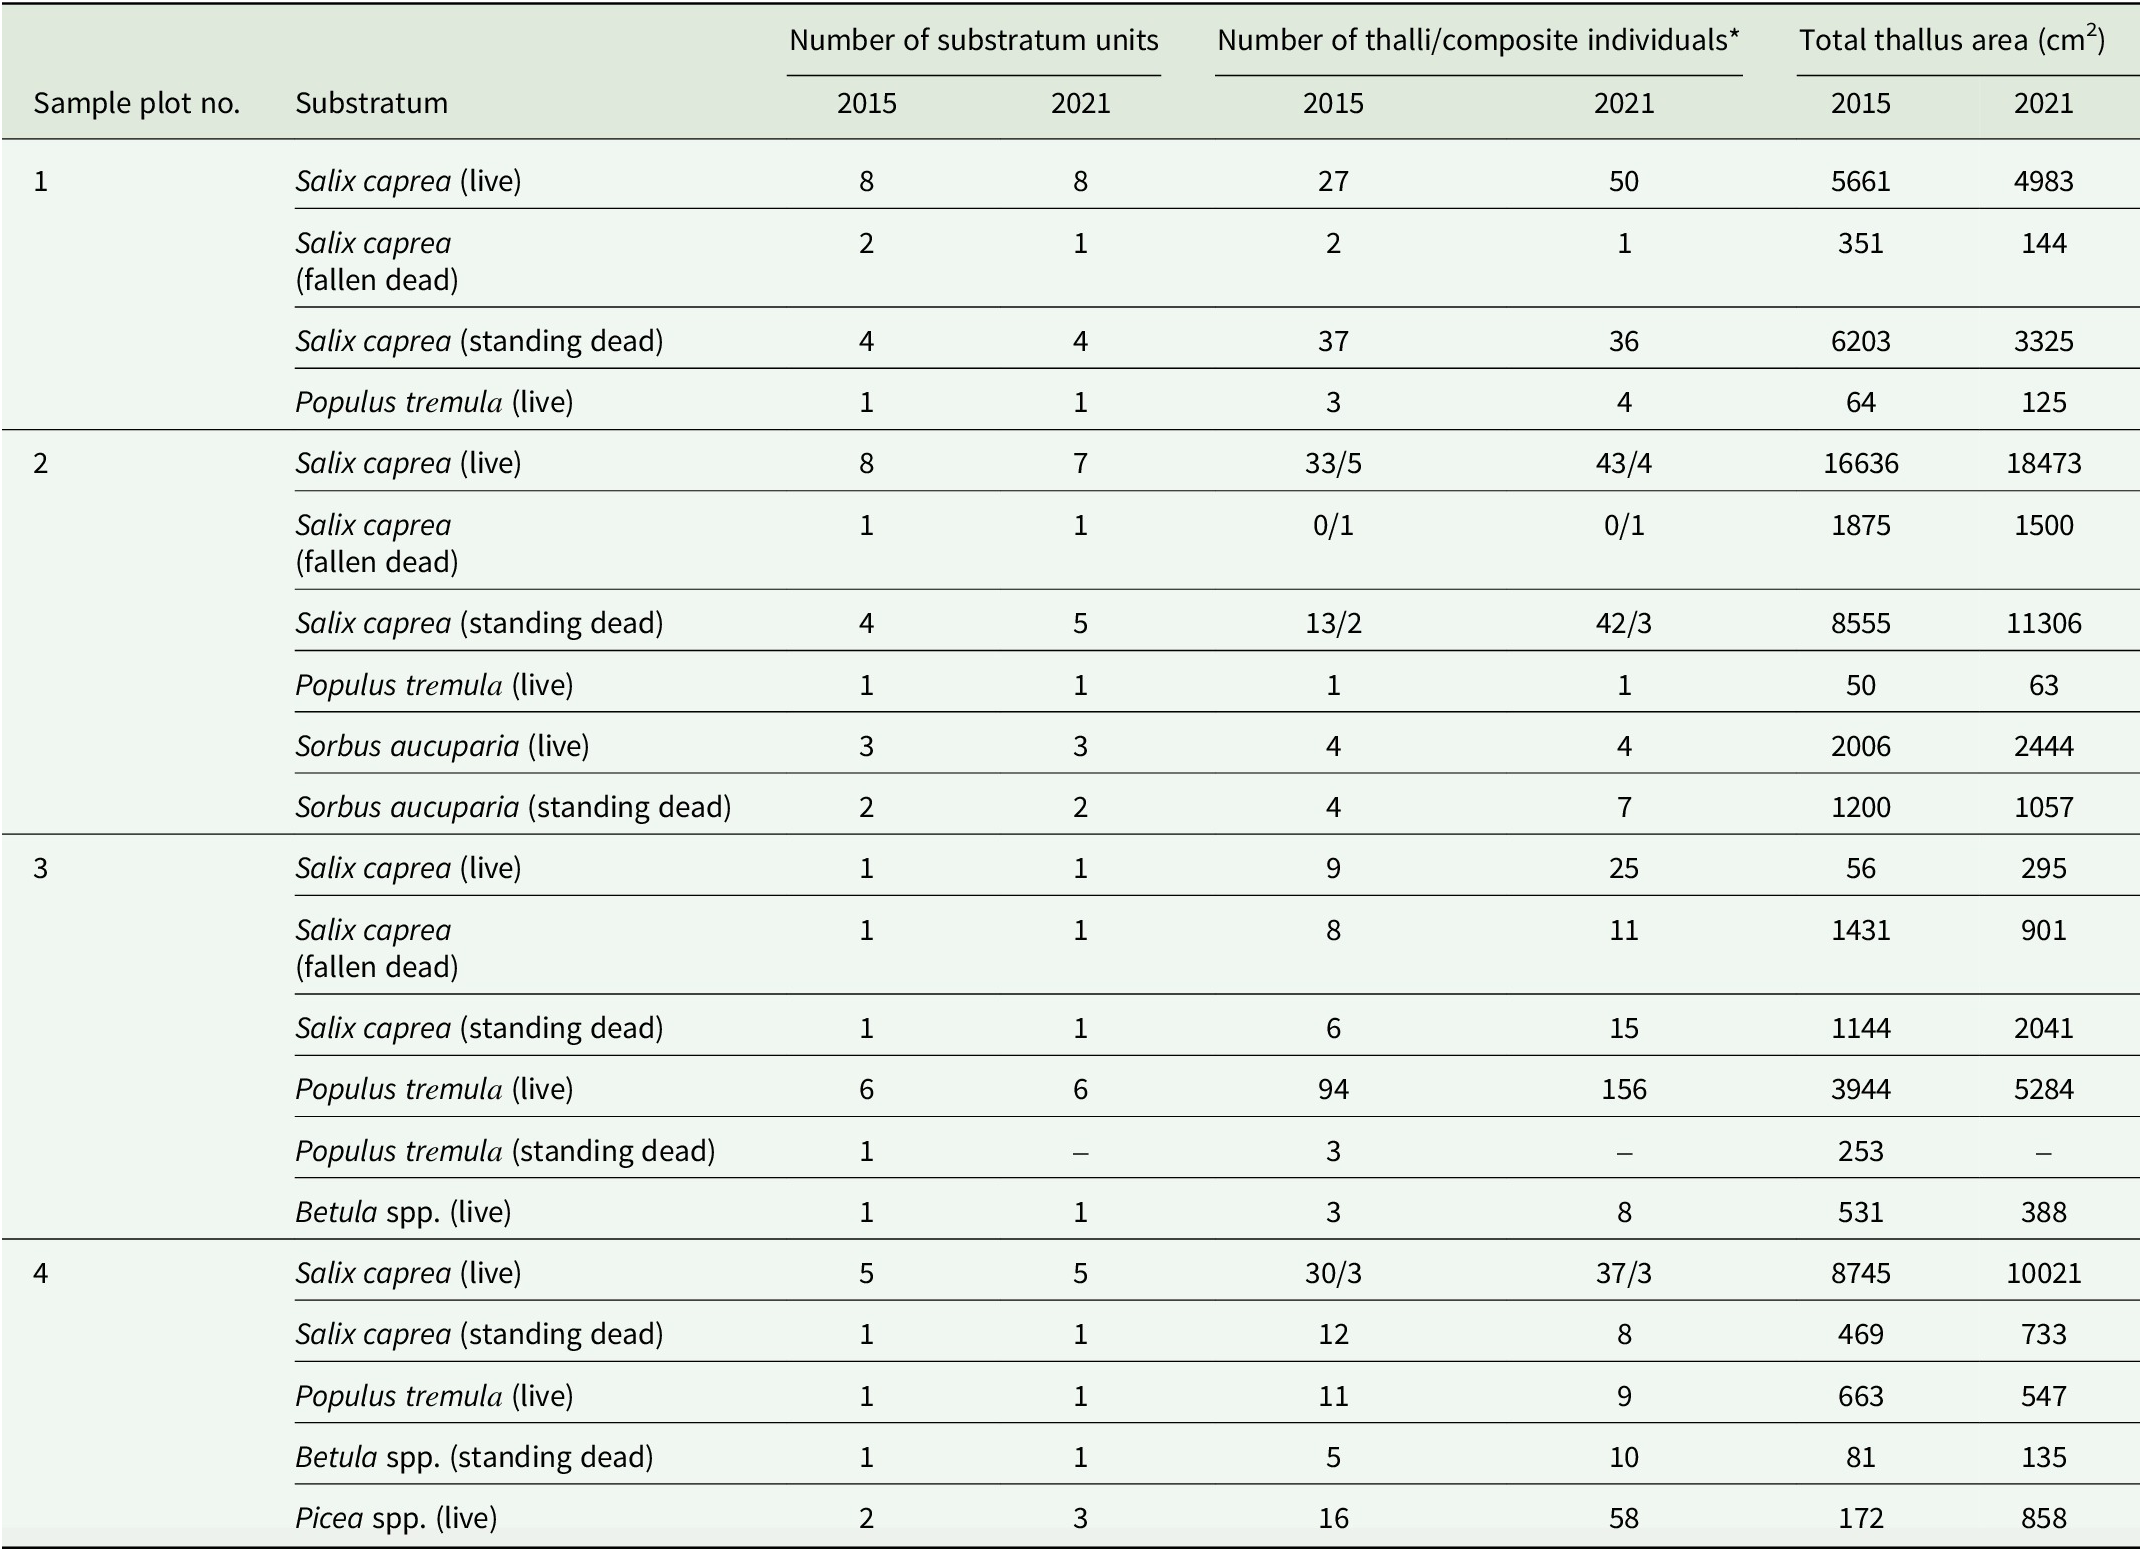
In the study area, L. pulmonaria occurred on the trunks of living and dead trees of Salix caprea, Populus tremula, Sorbus aucuparia, Betula spp. and Picea spp., as well as on fallen trees of S. caprea and P. tremula (Table 3). The main substrata were S. caprea living and dead trees, and P. tremula living trunks. Over six years, the number of thalli on S. caprea standing dead trunks increased by 7%, and on S. caprea and P. tremula living trunks by 58% and 56%, respectively (Table 3). By 2021, two dead trees had fallen; all thalli had died on one tree, while some had died and some had partly degraded on the other. Based on the tree composition (Table 1), the most common deciduous trees in the forests studied were Betula spp. (16%); less common were P. tremula (8%) and S. caprea (3%). Lobaria pulmonaria thalli were recorded on almost all S. caprea trunks present in sample plots. It should be noted that in the undergrowth among deciduous trees, S. aucuparia and Betula spp. predominated, with P. tremula and S. caprea being very rare.
Types of Lobaria pulmonaria substrata in the studied forest communities of sample plots at Paanajärvi National Park, Republic of Karelia, Russian Federation.
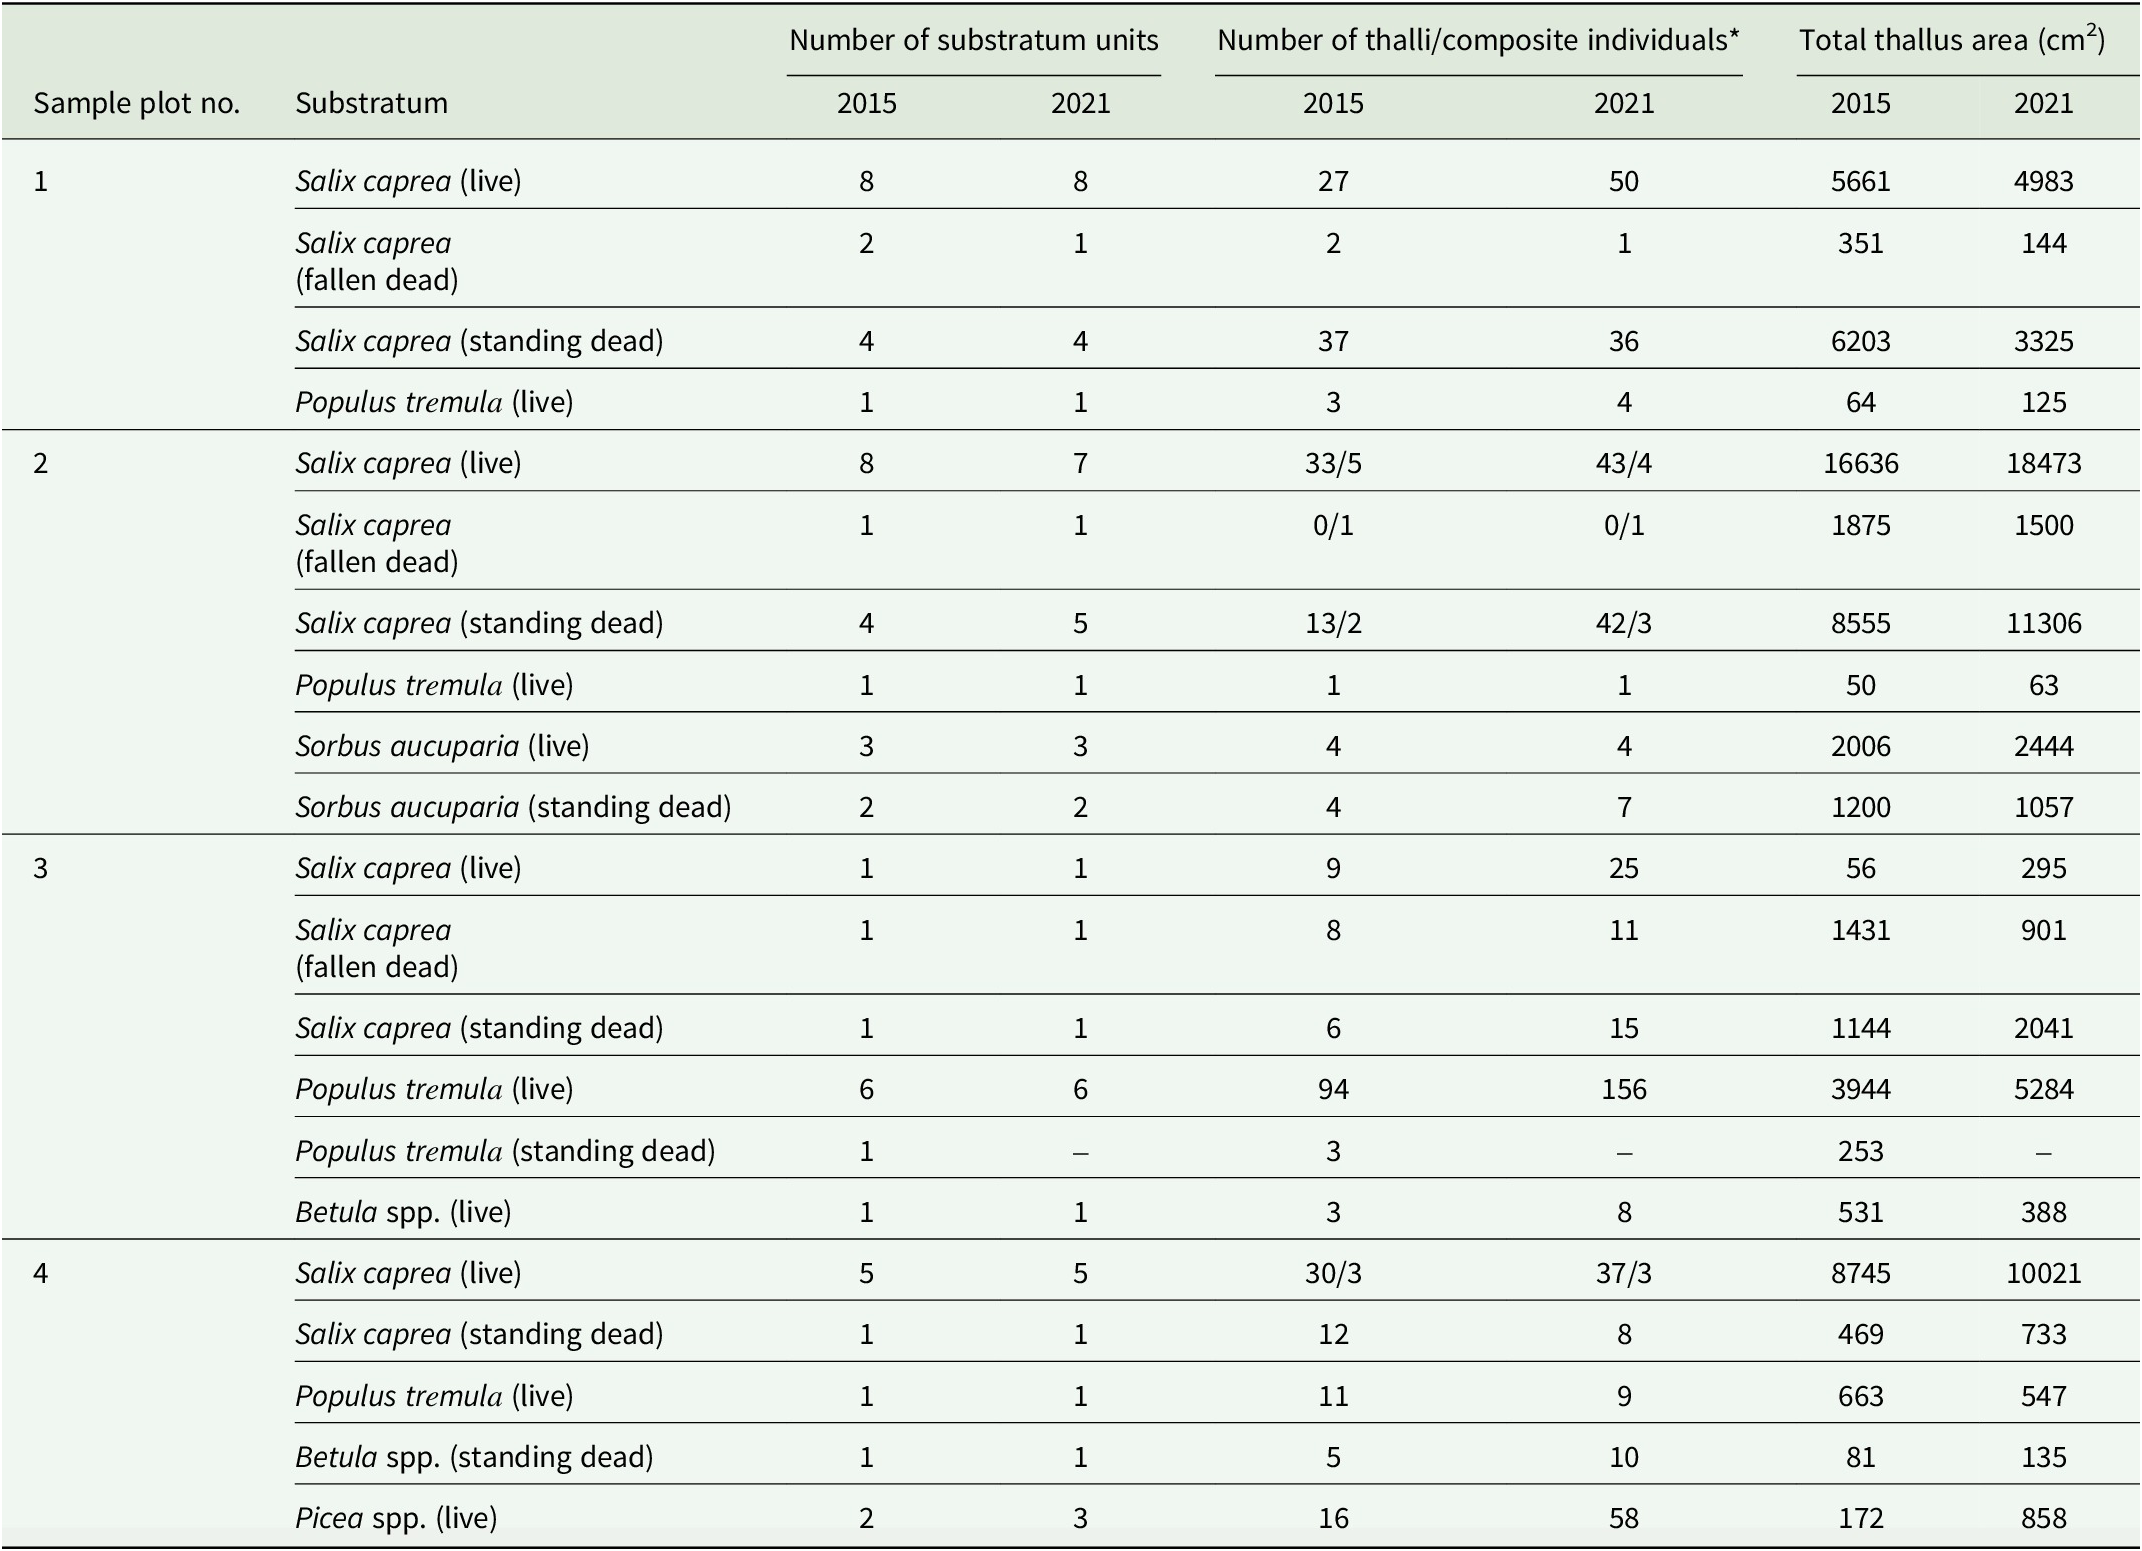
Table 3. Long description
From the top, the table lists four sample plots, each with substrata types such as Salix caprea (live, fallen dead, standing dead), Populus tremula (live, standing dead), Sorbus aucuparia (live, standing dead), Betula spp. (live, standing dead), and Picea spp. (live). For each substratum, columns show number of substratum units, number of thalli or composite individuals, and total thallus area in square centimeters for 2015 and 2021. For example, in plot 1, Salix caprea (live) had 8 units in both years, with thalli counts increasing from 27 to 50 and thallus area decreasing from 5661 to 4983. In plot 2, Salix caprea (live) had 8 units in 2015 and 7 in 2021, with thalli/composite individuals listed as 33/5 in 2015 and 43/4 in 2021, and thallus area increasing from 16636 to 18473. Some entries use a slash to indicate composite individuals where individual thalli could not be distinguished. Dashes indicate missing data. The table footnote clarifies that composite individuals are recorded where individual thalli could not be separated.
*Note: composite individuals are recorded where it was not possible to distinguish individual thalli.
Lichen colonization on new trunks was rarely observed. Only at SP4 were thalli recorded on a new tree, the branches and trunk of a Picea. Composite individuals (see above) and thalli with apothecia were found only on S. caprea trunks (Table 3).
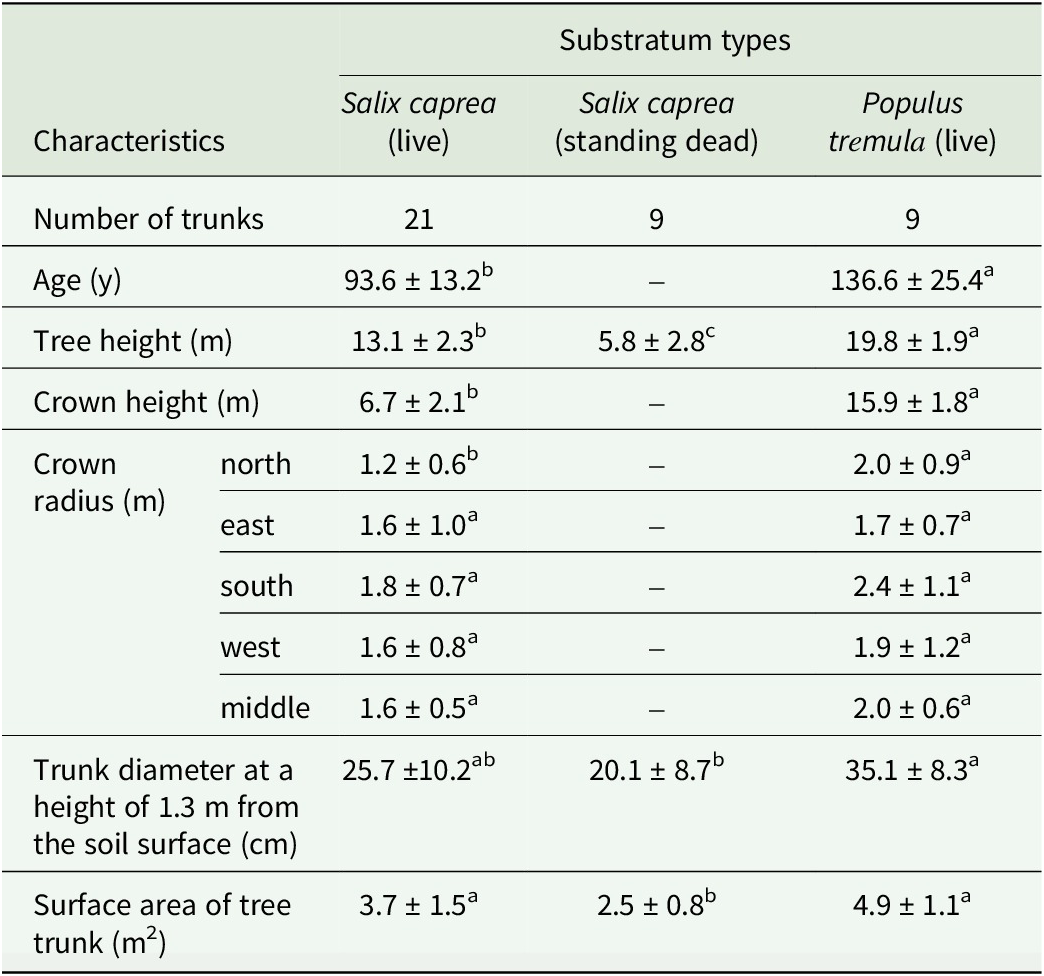
The demographic characteristics of L. pulmonaria on the main substratum types (S. caprea living and dead trunks and living P. tremula trunks) differed in age, tree and crown heights, trunk diameter at a height of 1.3 m from the soil surface, and trunk surface area (Table 4).
Characteristics of the main Lobaria pulmonaria substrata in the studied forest communities at Paanajärvi National Park, Republic of Karelia, Russian Federation. Measurements are given as mean ± standard deviation. Significant results (P < 0.05) are indicated with different letters.
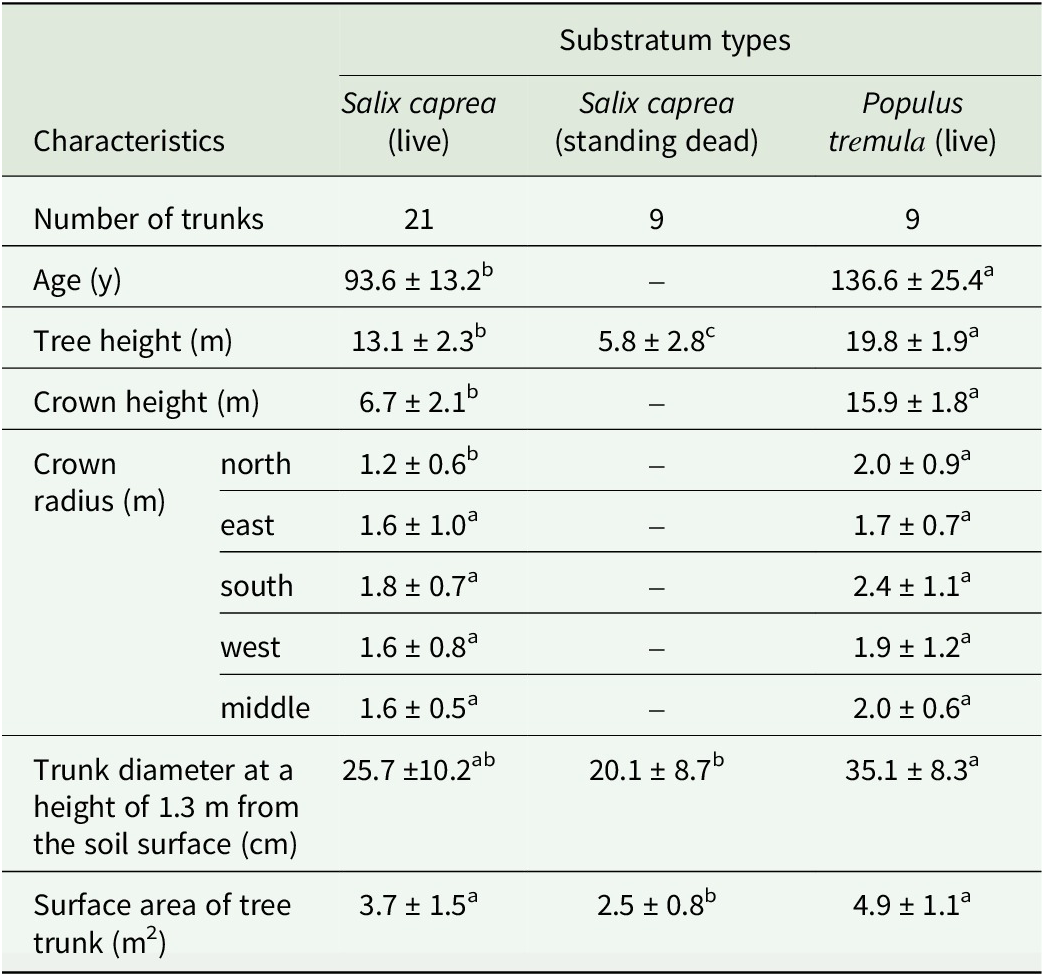
Table 4. Long description
The table has three main columns for substratum types: Salix caprea live, Salix caprea standing dead, and Populus tremula live. The first row lists number of trunks: 21 for Salix caprea live, 9 for Salix caprea standing dead, and 9 for Populus tremula live. Age is 93.6 plus or minus 13.2 years for Salix caprea live (b), not available for Salix caprea standing dead, and 136.6 plus or minus 25.4 years for Populus tremula live (a). Tree height is 13.1 plus or minus 2.3 meters for Salix caprea live (b), 5.8 plus or minus 2.8 meters for Salix caprea standing dead (c), and 19.8 plus or minus 1.9 meters for Populus tremula live (a). Crown height is 6.7 plus or minus 2.1 meters for Salix caprea live (b), not available for Salix caprea standing dead, and 15.9 plus or minus 1.8 meters for Populus tremula live (a). Crown radius is subdivided by direction: north is 1.2 plus or minus 0.6 meters for Salix caprea live (b), not available for Salix caprea standing dead, and 2.0 plus or minus 0.9 meters for Populus tremula live (a); east is 1.6 plus or minus 1.0 meters for Salix caprea live (a), not available for Salix caprea standing dead, and 1.7 plus or minus 0.7 meters for Populus tremula live (a); south is 1.8 plus or minus 0.7 meters for Salix caprea live (a), not available for Salix caprea standing dead, and 2.4 plus or minus 1.1 meters for Populus tremula live (a); west is 1.6 plus or minus 0.8 meters for Salix caprea live (a), not available for Salix caprea standing dead, and 1.9 plus or minus 1.2 meters for Populus tremula live (a); middle is 1.6 plus or minus 0.5 meters for Salix caprea live (a), not available for Salix caprea standing dead, and 2.0 plus or minus 0.6 meters for Populus tremula live (a). Trunk diameter at 1.3 meters height is 25.7 plus or minus 10.2 centimeters for Salix caprea live (ab), 20.1 plus or minus 8.7 centimeters for Salix caprea standing dead (b), and 35.1 plus or minus 8.3 centimeters for Populus tremula live (a). Surface area of tree trunk is 3.7 plus or minus 1.5 square meters for Salix caprea live (a), 2.5 plus or minus 0.8 square meters for Salix caprea standing dead (b), and 4.9 plus or minus 1.1 square meters for Populus tremula live (a). Superscript letters indicate statistically significant differences at P less than 0.05.
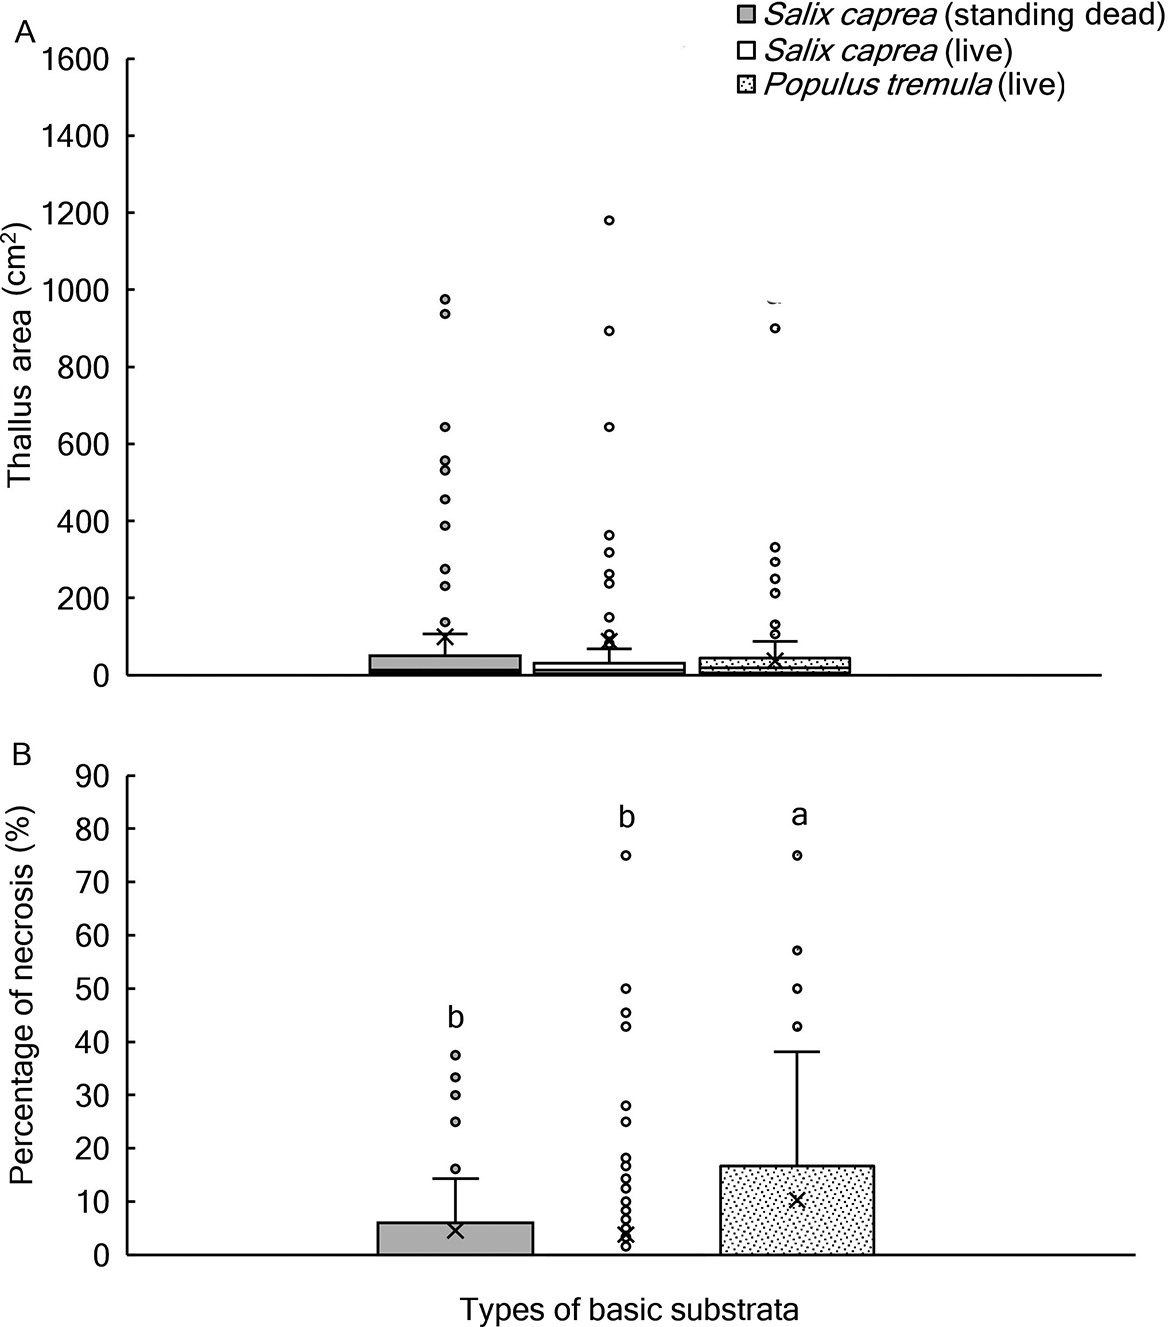
The median thallus area of L. pulmonaria on P. tremula (18.8 cm2) and S. caprea (12.5 cm2) trunks did not significantly differ (Kruskal-Wallis test; P = 0.34), and tree viability did not affect thallus size (Fig. 3A). In contrast, the necrotic area was larger in lichen thalli growing on P. tremula compared to thalli colonizing living and dead S. caprea (Fig. 3B).
Boxplots showing characteristics of the lichen Lobaria pulmonaria on the main types of substratum in 2021. A, thallus area. B, percentage of necrosis. Box plot limits indicate the 25th and 75th percentiles. Centre lines and crosses within the box plot represent the medians and averages, respectively. Whiskers extend to 1.5 times the interquartile range from the 25th and 75th percentiles. Outliers are represented as individual open circles outside the whiskers. Significant results (P < 0.05) are indicated with different letters.
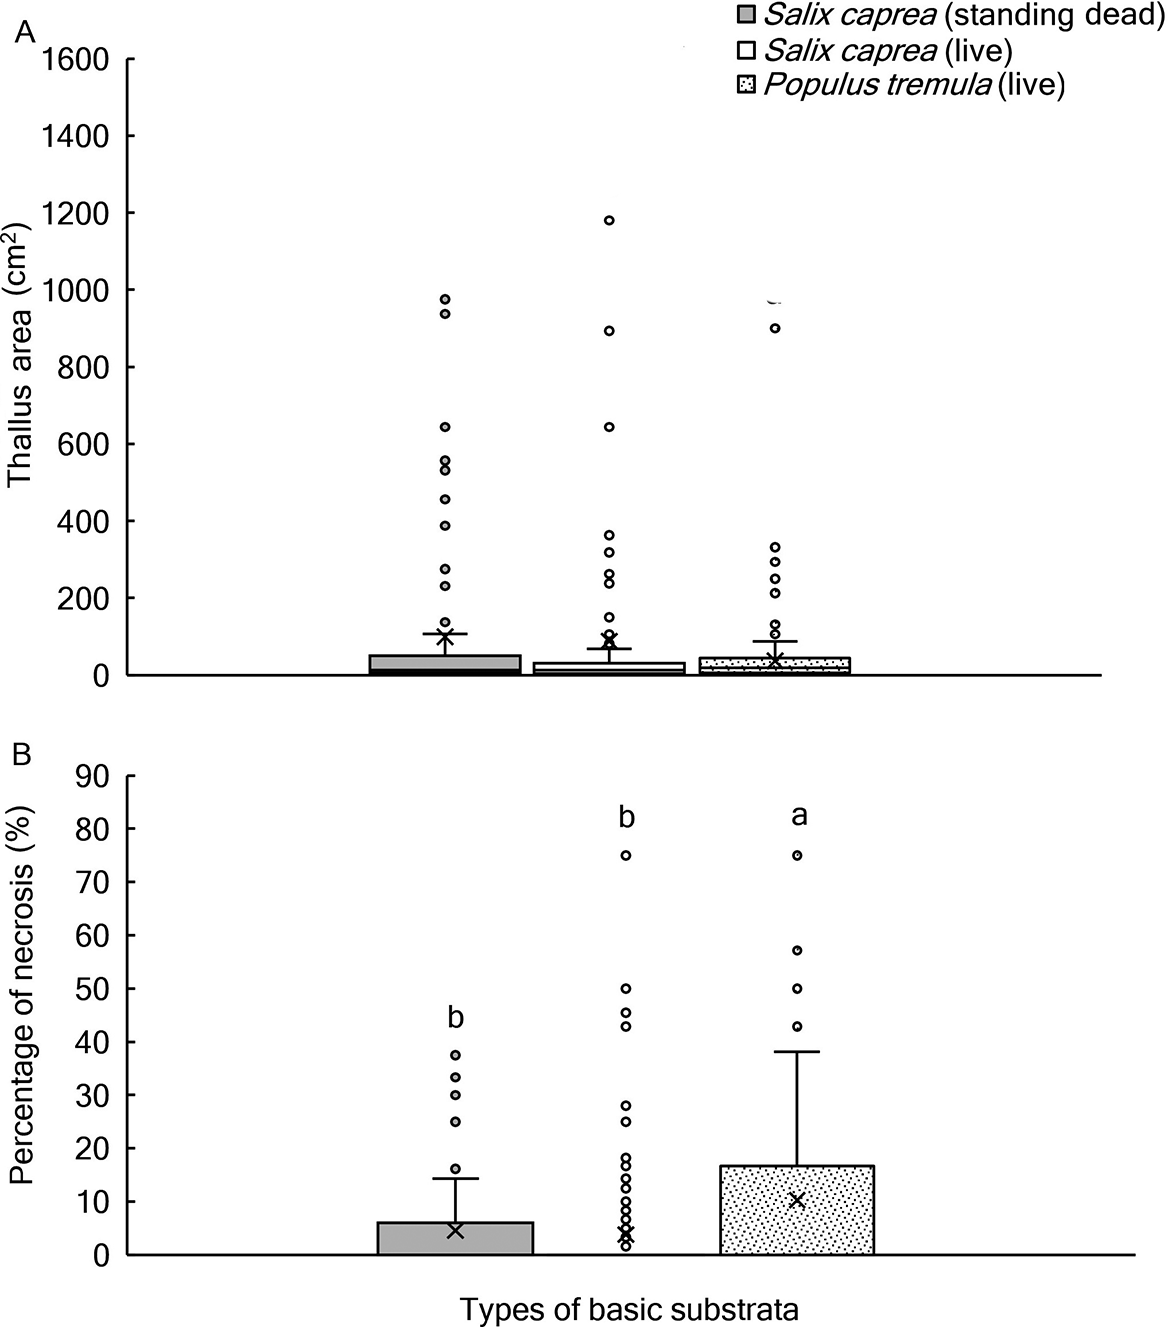
Figure 3. Long description
Panel A at the top displays thallus area in square centimeters on the y-axis and types of basic substrata on the x-axis. Three boxplots represent Salix caprea standing dead, Salix caprea live, and Populus tremula live. All three substrata show similar median thallus areas, with most data clustered below 200 square centimeters and numerous outliers extending up to 1600 square centimeters. The legend at the top right identifies the fill patterns for each substratum type. Panel B at the bottom shows percentage of necrosis on the y-axis and the same substratum types on the x-axis. Salix caprea standing dead and Salix caprea live have lower median necrosis percentages, both marked with the letter b, while Populus tremula live has a higher median necrosis percentage, marked with the letter a. Outliers are shown as open circles above the whiskers. Boxplot elements include the 25th and 75th percentiles as box limits, medians as center lines, averages as crosses, and whiskers extending to 1.5 times the interquartile range. Significant differences are indicated by different letters above the boxes.
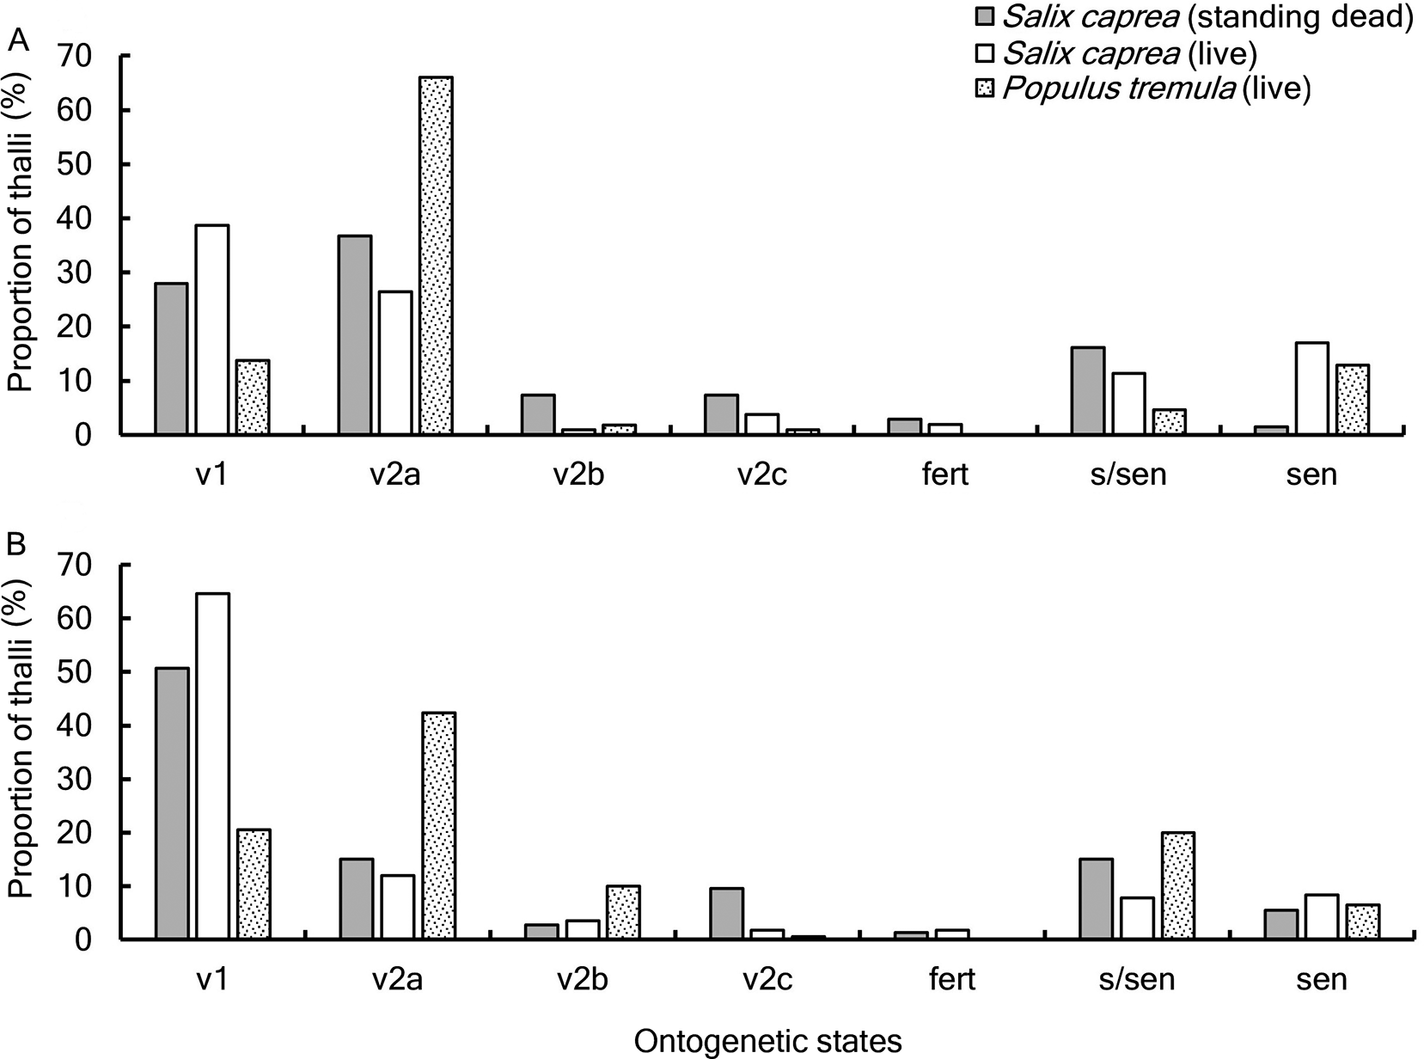
Evaluation of L. pulmonaria ontogenetic spectra on the main substratum types revealed similar patterns: an increase in the proportion of virginal 1 (v1) thalli and a decrease in virginal 2a (v2a) thalli over six years (Fig. 4). Interestingly, the proportion of subsenile thalli (s/sen) on P. tremula trunks had increased four times compared to 2015.
Ontogenetic spectra of the lichen Lobaria pulmonaria on the main substratum types. A, in 2015. B, in 2021. Ontogenetic states: v1 = virginal 1; v2a = virginal 2a; v2b = virginal 2b; v2c = virginal 2c; fert = fertile; s/sen = subsenile; sen = senile.

Figure 4. Long description
Panel A at the top shows data from 2015. The x axis lists ontogenetic states from left to right as v1, v2a, v2b, v2c, fert, s slash sen, sen. The y axis is labeled proportion of thalli in percent, ranging from 0 to 70. For each state, three bars represent Salix caprea standing dead (solid gray), Salix caprea live (open), and Populus tremula live (dotted). In 2015, v2a shows the highest proportion for Populus tremula live, while v1 is highest for Salix caprea standing dead and live. Subsenile and senile states have moderate values, especially for Populus tremula live. Panel B at the bottom shows data from 2021 with the same axes and bar patterns. In 2021, v1 is dominant for Salix caprea standing dead and live, while v2a is highest for Populus tremula live. Subsenile and senile states have increased for Populus tremula live compared to 2015. Fertile and v2c states remain low across all substrata and years. The legend at the top right defines the bar patterns.
Characteristics of microconditions
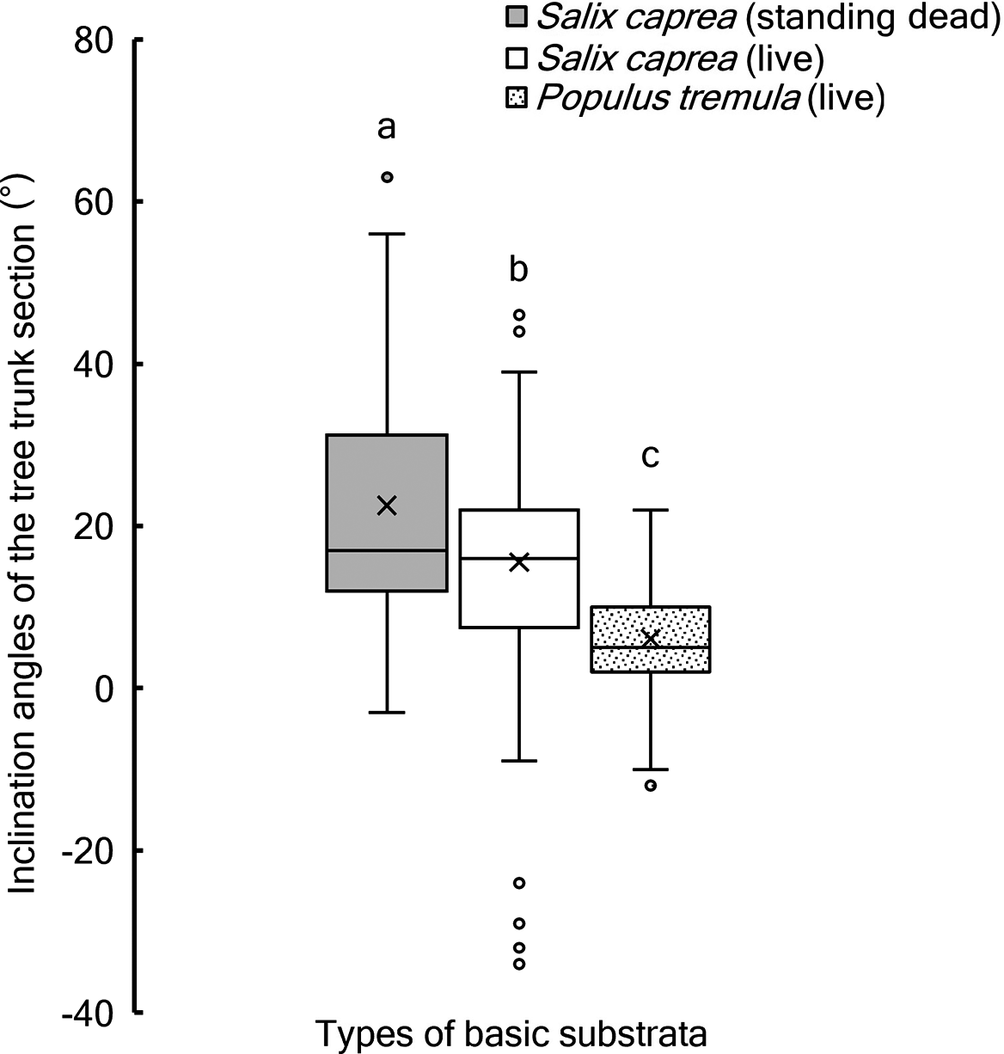
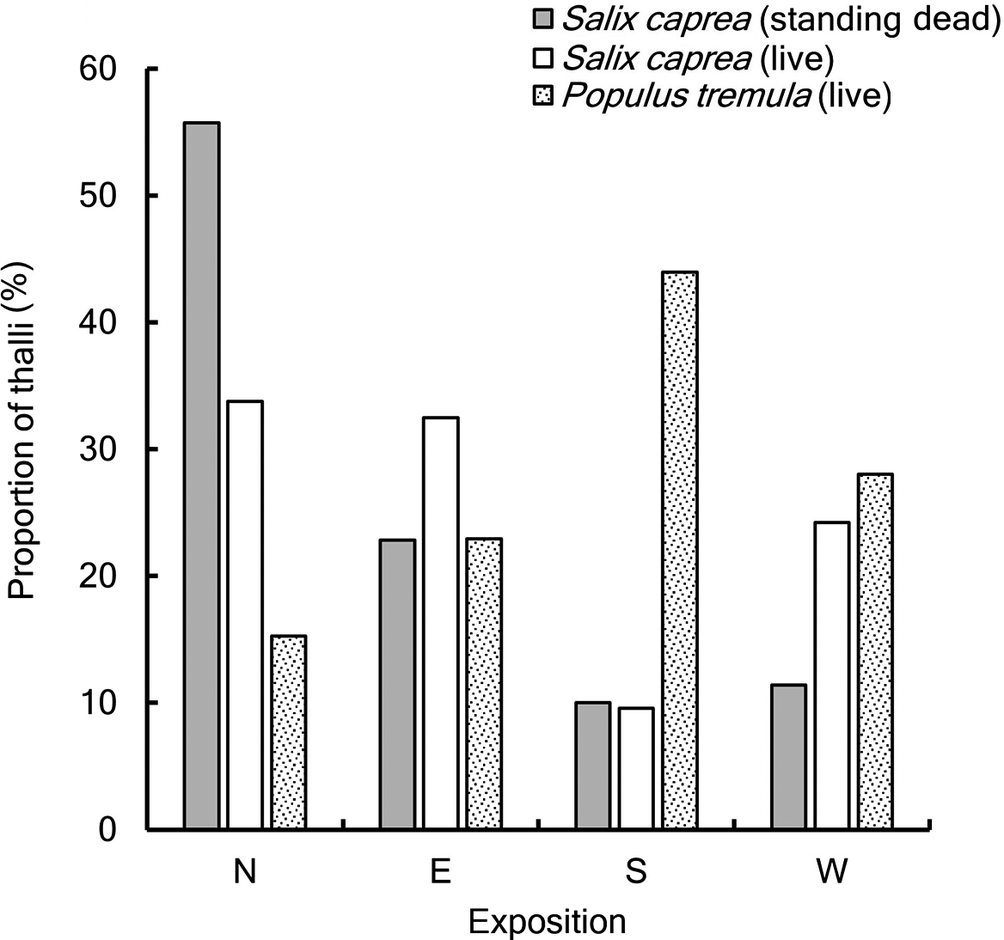
The angle of the tree trunk in the lichen microhabitat varied widely, from −34° to +64°, and differed significantly across the three main substrata (Fig. 5). The distribution of L. pulmonaria across aspects of the trunk showed that thalli were most often found on dead S. caprea on the northern part, while on living trees they were found on the northern and eastern sides (Fig. 6). On living P. tremula trunks, 44% of thalli grew on the southern part of the trunk. Thalli were recorded on the trunks and branches of woody substrata at a height of 11–198 cm. On dead S. caprea, most thalli (81%) occurred at a height of 100–180 cm, whereas on living S. caprea and P. tremula trunks more than 80% of thalli grew 80–160 cm above the ground. On a small number of trunks, L. pulmonaria occurred higher than 2 m above the ground (not considered).
Inclination angles of the tree trunk section of the main tree species substrata where Lobaria pulmonaria was recorded. Box plot limits indicate the 25th and 75th percentiles. Centre lines and crosses within the box plot represent the medians and averages, respectively. Whiskers extend to 1.5 times the interquartile range from the 25th and 75th percentiles. Outliers are represented as individual open circles outside the whiskers. Significant results (P < 0.05) are indicated with different letters.

Figure 5. Long description
Y axis is labeled Inclination angles of the tree trunk section in degrees, ranging from minus 40 to 80. X axis is labeled Types of basic substrata with three categories from left to right: Salix caprea standing dead (solid gray), Salix caprea live (white), and Populus tremula live (dotted). Each box plot shows the 25th to 75th percentiles as box limits, medians as horizontal lines, and averages as crosses. Whiskers extend to 1.5 times the interquartile range. Outliers are shown as open circles above and below the whiskers. The leftmost box plot (Salix caprea standing dead) has the highest median and average, labeled ‘a’. The middle plot (Salix caprea live) has intermediate values, labeled ‘b’. The rightmost plot (Populus tremula live) has the lowest values, labeled ‘c’. Significant differences are indicated by different letters above each box. The legend in the upper right explains the fill patterns for each substrate type.
Distribution of Lobaria pulmonaria thalli on different trunk aspects of the main tree species substrata. N = north; E = east; S = south; W = west.

Figure 6. Long description
The x-axis lists trunk aspects as N, E, S, W from left to right. The y-axis shows proportion of thalli in percent from 0 to 60. For N, Salix caprea standing dead is about 57 percent, Salix caprea live about 35 percent, Populus tremula live about 15 percent. For E, Salix caprea standing dead is about 22 percent, Salix caprea live about 33 percent, Populus tremula live about 22 percent. For S, Salix caprea standing dead and live are both near 10 percent, Populus tremula live is about 45 percent. For W, Salix caprea standing dead is about 12 percent, Salix caprea live about 23 percent, Populus tremula live about 25 percent. Legend at top right identifies bar patterns for each species and status.
Discussion
Lobaria pulmonaria is a model species for studying the population dynamics and distribution of old-growth forest lichens (Öckinger et al. Reference Öckinger, Niklasson and Nilsson2005; Scheidegger & Werth Reference Scheidegger and Werth2009; Öckinger & Nilsson Reference Öckinger and Nilsson2010; Belinchón et al. Reference Belinchón, Harrison, Mair, Várkonyi and Snäll2017). In north-eastern Fennoscandia, L. pulmonaria mainly colonizes two tree species, P. tremula and S. caprea (Kuusinen Reference Kuusinen1996; Gu et al. Reference Gu, Kuusinen, Konttinen and Hanski2001; Ignatenko & Tarasova Reference Ignatenko and Tarasova2018, Reference Ignatenko and Tarasova2020). Previously, other authors conducted large-scale studies on a 50 km2 area in central-eastern Finland to assess the dynamics of a L. pulmonaria metapopulation over a ten-year period (Belinchón et al. Reference Belinchón, Harrison, Mair, Várkonyi and Snäll2017). The conclusion was that the future lichen metapopulation size was determined by the number of host trees located in partly shaded open forest, not isolated from occupied trees, and by the rotation time of these host trees. The authors also noted that local extinctions were mainly deterministic, set by tree mortality, but also owing to forestry logging, and that colonization of L. pulmonaria on new substrata occurred very rarely. Importantly, this work only assessed the occurrence of L. pulmonaria on P. tremula and S. caprea trunks, and measured limited environmental conditions of the lichen microhabitat. Previous studies (Ignatenko & Tarasova Reference Ignatenko and Tarasova2018, Reference Ignatenko and Tarasova2020) have demonstrated the need to study the population structure of L. pulmonaria by taking into account the characteristics of the wider forest community, as well as parameters of the host trees including microhabitats.
Over the past six years, the number of L. pulmonaria thalli larger than 1 cm2 increased by an average of 1.6 times per 1 ha, and the total thallus area increased by 0.11 m2 ha−1. One of the possible reasons for the detected increase in the number of thalli could be the growth and development of juvenile-immature thalli. These were not recorded in 2015 since their area was less than 1 cm2, but they had transitioned to virginal states by the time of the second survey in 2021. In a study of subcenopopulations growing in the middle taiga forests of Karelia (old-growth spruce forests), we calculated the approximate number of thalli in the juvenile-immature states that were formed on one P. tremula trunk (Ignatenko et al. Reference Ignatenko, Tarasova and Markovskaya2020). It was established that c. 2900 thalli could live on one tree (R. Ignatenko & V. Tarasova, unpublished data). This indicates that, under favourable microclimatic conditions in old-growth spruce forests, many juvenile-immature thalli of L. pulmonaria could form on the substratum surface.
The identification of different life stages contributes to a better understanding of population structure formation of lichen species and allows us to predict their development (Mikhailova & Vorobeichik Reference Mikhailova and Vorobeichik1999; Suetina Reference Suetina2001; Ignatenko et al. Reference Ignatenko, Tarasova and Markovskaya2020, Reference Ignatenko, Nikerova and Ignatenko2024). It is interesting to note that significant changes in the ontogenetic structure were revealed only in SP2. Moreover, when analyzing the graphical data, similar trends were observed in SP1 and SP4.
Lobaria pulmonaria reproduces and spreads mainly by vegetative diaspores, while fruiting bodies appear rarely (Gauslaa et al. Reference Gauslaa, Lie, Solhaug and Ohlson2006; Edman et al. Reference Edman, A-M and Villard2008; Jüriado et al. Reference Jüriado, Liira, Csencsics, Widmer, Adolf, Kohv and Scheidegger2011). It has been suggested that apothecia were formed only in genetically heterogeneous populations (Zoller et al. Reference Zoller, Lutzoni and Scheidegger1999). Using molecular genetic methods, it has been established that L. pulmonaria vegetative propagules spread over a 15–30 m distance (Jüriado et al. Reference Jüriado, Liira, Csencsics, Widmer, Adolf, Kohv and Scheidegger2011). According to Öckinger et al. (Reference Öckinger, Niklasson and Nilsson2005), over a nine-year study period the mean distance between a colonized tree and its nearest occupied neighbour was 35 m. Sexually reproduced spores could be dispersed over 100–1000 m distances (Werth Reference Werth2010; Ronnås et al. Reference Ronnås, Werth, Ovaskainen, Várkonyi, Scheidegger and Snäll2017). In our study, thalli with apothecia were recorded only in one cenopopulation (SP2). We have previously shown that in the Eastern Fennoscandia territory, the proportion of generative thalli in the ontogenetic spectrum of cenopopulations in the northern taiga subzone forest communities was one third of that in the middle taiga subzone (Ignatenko & Tarasova Reference Ignatenko and Tarasova2020). It is crucial to highlight that during the relichenization process, a fungus that formed from an ascospore could combine with an alga that had a genotype distinct from the alga of the mother thallus, and this could contribute to an increase in lichen adaptive properties (Zoller et al. Reference Zoller, Lutzoni and Scheidegger1999; Mikryukov et al. Reference Mikryukov, Mikhailova and Scheidegger2010). Accordingly, the presence of a fertile thallus in cenopopulations could be the key to its sustainable existence.
We assume that L. pulmonaria cenopopulations have been growing in the studied forests for a long time. This may be indicated by the presence of thalli of different ontogenetic states and large composite individuals in the cenopopulations. The regeneration of L. pulmonaria thalli in Paanajärvi National Park cenopopulations may be due to climate change. According to the literature (Georgiev & Nazarova Reference Georgiev and Nazarova2015; Filatov et al. Reference Filatov, Baklagin, Efremova, Nazarova and Palshin2019; Nazarova Reference Nazarova2022, Reference Nazarova2024), Eastern Fennoscandia has seen warmer temperatures and increased rainfall almost every year since the 1990s. Northern Karelia has recently had an average of 148 days per year with average daily temperatures above 5 °C, against a norm of 134 days (Georgiev & Nazarova Reference Georgiev and Nazarova2015). Ellis & Coppins (Reference Ellis and Coppins2007) presented models for the impact of climate change on the Lobarion epiphyte community in Scotland. Increased average annual temperature and winter precipitation were predicted to positively affect the physiological activity of the Lobarion community (photosynthetic capacity and N2-fixation).
Only one newly colonized (thalli > 1 cm2) tree was recorded in the studied area over the six years: Picea branches and trunk in a spruce forest experiencing the last disturbance 210 years ago. It is known from the literature that branches of young conifers can act as a substratum when in the dripzone of large old P. tremula trees (Goward & Arsenault Reference Goward and Arsenault2000; Gauslaa & Goward Reference Gauslaa and Goward2012), since various compounds are leached from the upper part of the tree crown. With further precipitation falling on the crowns of neighbouring young conifers, they are enriched with certain elements, and the pH level increased (Gauslaa et al. Reference Gauslaa, Goward and Pypker2020). Thus, the lower branches of young Picea trees acted as a temporary substratum, which increased the potential of the lichen to further spread into the forest community. In our study, only SP4 recorded the presence of L. pulmonaria thalli on the branches and trunks of young Picea trees near old P. tremula and S. caprea trees which harboured the lichen. The rare colonization of L. pulmonaria thalli on this substratum type is probably due to the lower density of spruce undergrowth and the sporadic spread of P. tremula and S. caprea in Paanajärvi National Park’s old-growth forests.
It is worth noting that S. caprea and P. tremula are widespread throughout Karelia (Kravchenko Reference Kravchenko2007). Our previous studies have shown that in the middle taiga blueberry spruce forests, S. caprea was part of the tree stand in 10% of the forests studied, while in the northern taiga subzone this was 78% (Ignatenko & Tarasova Reference Ignatenko and Tarasova2018, Reference Ignatenko and Tarasova2020). Our literature review revealed no detailed data on this tree’s distribution in Eastern Fennoscandian forests. Aspen forests in Karelia are formed only in the middle taiga subzone (Volkov Reference Volkov2008). In the northern taiga subzone, P. tremula is part of the forests as an associated species. Our study showed that the proportion of the main L. pulmonaria substrata in the stand was very low and on most of them the lichen thalli were already growing. At the same time, new S. caprea and P. tremula trees, colonized by L. pulmonaria, appear only in very rare cases. One of the fundamental habitat characteristics of epiphytic lichens is the inclination angle of the tree’s trunk surface, and the inclination angle of the trunk sections where lichen thalli were recorded differed significantly between the two tree species on which they were predominantly recorded (S. caprea and P. tremula). The smaller (on average three times smaller) inclination angle of P. tremula trunks compared to S. caprea trunks could at least partly explain the rather large difference in thallus number (and/or composite individuals) and their total area on these two substrata. Higher values of these indicators were typical for S. caprea trees, which were characterized by more inclined trunks. Studies have indicated that sunlit, upward-facing tree surfaces collect 2–3 times more atmospheric moisture than shaded, downward-facing surfaces, facilitating lichen spore adhesion (Barkman Reference Barkman1958; Gorshkov Reference Gorshkov1986, Reference Gorshkov1991).
Epiphyte distribution on tree trunks was partly determined by the trunk’s compass direction. Lichens were usually unevenly distributed along the tree trunk, which was due to different light aspect, temperature and humidity conditions in the different cardinal directions (Barkman Reference Barkman1958; Gorshkov Reference Gorshkov1986). Lobaria pulmonaria thalli growing on the north side of P. tremula trunks (Hazell & Gustafsson Reference Hazell and Gustafsson1999), and on boxes for transplantation covered with the bark of S. aucuparia (Gauslaa et al. Reference Gauslaa, Ohlson, Solhaug, Bilger and Nybakken2001), have higher viability and survival rates than those growing on the south side. This could be partly explained by increased insolation, which leads to photodestruction of the photosynthetic apparatus (Gauslaa & Solhaug Reference Gauslaa and Solhaug1999; Shelyakin et al. Reference Shelyakin, Zakhozhiy, Dalke, Dymova, Malyshev and Golovko2021). In our experiments, the proportion of necrosis in the total area of the L. pulmonaria thalli was significantly higher in lichens growing on P. tremula trunks. Lobaria pulmonaria thalli were most often found on southern aspects of P. tremula trunks, but on the northern and eastern aspects of S. caprea living trees. Probably, on large P. tremula trees with a fairly spreading crown, greater light availability for L. pulmonaria thalli on the southern trunk side comes with sufficient moisture retained by the spreading crown and flowing down the tree trunk to provide adequate growing conditions.
The data obtained on the occupied microhabitat on the trunks, in combination with the data on the area and necrotic proportion of L. pulmonaria thalli, as well as ontogenetic characteristics, indicate that more favourable conditions for thalli growth and development were available on S. caprea trunks. This was also supported by the fact that composite individuals were recorded only on living and dead S. caprea trunks.
Conclusion
The presence of large composite individuals, an increase in the total thallus area of all individuals and the total number of thalli, and changes in the ontogenetic structure over the period 2015–2021 indicate the stable existence of L. pulmonaria cenopopulations growing in the old-growth forests of Paanajärvi National Park. At the same time, the rare colonization of new substrata and the death of trees on which the lichen lives, together with the decrease in the number or complete absence of generative thalli, raises concerns about the state of these cenopopulations in the future. However, changing climate conditions in the Eastern Fennoscandia northern taiga forests may facilitate the growth and development of the main L. pulmonaria substratum types. This will support the stable existence of L. pulmonaria cenopopulations.
Acknowledgements
The authors express their gratitude and appreciation to their teacher, Dr Victoria N. Tarasova. We thank the administration and staff of the Paanajärvi National Park and personally thank the head of the department for scientific work and environmental education, Anastasia V. Protasova, for her help in organizing and conducting field research under the scientific cooperation agreement. The authors are especially grateful to Kseniya M. Nikerova for the English translation. We are sincerely grateful to Dr Susan Will-Wolf, Associate Editor, The Lichenologist Editorial Office, and the reviewers for their valuable comments and suggestions. We thank Anastasiya K. Pomeranets for her assistance in statistical data processing. The study was carried out under state order to the Karelian Research Centre of the Russian Academy of Sciences (Forest Research Institute of KarRC RAS).
Author ORCID
Roman Ignatenko, 0000-0001-9608-9465.
Competing Interests
The authors declare none.