Cardiac magnetic resonance has been widely used for myocardial scar and perfusion assessment and evaluation. T1 mapping is a recently developed imaging analysis method that allows quantitative assessment of myocardial T1 values obtained using MRI. Reference Taylor, Salerno and Dharmakumar1 In the past, delayed-contrast MRI was commonly used to evaluate myocardial damage, but it allowed assessment of local lesions alone and not the entire myocardium. The advantages of T1 mapping are that it measures T1 values across the entire myocardium, which is ideal for the evaluation of diffuse lesions, and that it can be used in patients with renal dysfunction because it does not involve the use of a contrast medium. It is reported to be useful in evaluating myocardial damage in patients with cardiomyopathy or after chemotherapy. Reference Reiter, Reiter and Kräuter2–Reference Martin-Garcia, Diaz-Pelaez and Lopez-Corral4
However, T1 mapping requires a breath-holding sequence, and children who are examined under sedation cannot hold their breath. Hence, the imaging is performed under free-breathing. It is possible to prevent blurring of images secondary to the heart’s movement with motion correction; however, free-breathing causes more significant distortion than breath-holding due to the respiratory motion. Reference Slomka, Fieno and Ramesh5 Since paediatric cardiac patients, such as those with CHD or cardiomyopathy, may develop myocardial damage from an early age, it would be useful if the myocardial properties could be assessed under free-breathing. Therefore, it is important to know the differences in T1 values between free-breathing and breath-holding images. In the present study, we investigated the free-breathing effect by comparing myocardial T1 values obtained under breath-holding and free-breathing.
Materials and methods
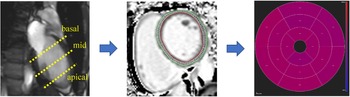
Among the patients who had undergone cardiac MRI at the Asahikawa Medical University hospital since April 2020, 22 were included in the study after T1 mapping of the myocardium was carried out during breath-holding and free-breathing. Twelve patients had heart disease, two had undergone chemotherapy for haematological disease, and eight were healthy subjects. The breakdown of patients with heart disease was as follows: 3 patients were post-operative for tetralogy of Fallot, 1 patient was post-operative for double outlet right ventricle, 1 patient was post-operative for transposition of the great artery, 1 patient was post-operative for total anomalous pulmonary venous return, 1 patient was post-operative for ventricular septal defect, 1 patient was post-operative for tricuspid atresia, 1 patient had ventricular septal defect, 1 patient had post-myocarditis, and 1 patient had WPW syndrome. The patients had to be old enough to hold their breath during the test; therefore, we targeted students from middle school and above. The volunteers performed an echocardiogram to confirm that there were no abnormalities in heart function or intra-cardiac structures. Vital signs were monitored during the examination. Patients underwent cardiac MRI in a 3.0 Tesla whole-body scanner (MAGNETOM Vida 3.0 T; Siemens Healthcare, Erlangen, Germany) equipped with dual-source, parallel radiofrequency transmission, and 18-element cardiac phased-array coils for radiofrequency reception. The Modified Look-Locker Inversion recovery sequence was used for T1 mapping. Basal, mid, and apical-ventricular short-axis slices were scanned, and myocardial T1 values were obtained. Reference Messroghli, Radjenovic and Kozerke6 Other scan parameters were field of view – 360 mm, matrix size – 256 × 144, acceleration factor – 2, repetition time – 2.53 ms, echo time – 1.06 ms, slice thickness – 8 mm, flip angle – 35°, and shot mode – true fast imaging with steady-state precession pulse sequence, using the 5(3)3 scheme. The images required for T1 mapping were taken in three short-axis slices (basal, mid, and apex) and measured during breath-holding and free-breathing (Figs 1 and 2). After visual inspection of the images, motion correction was implemented for cardiac movement and cross sections were compared for significant deviations between the two different breathing modes. The workstation (cvi42; ENTORESS, Mie, Japan) was used for analysis, and the region of interest settings for T1 measurements were carefully performed to exclude the endocardial blood pool, myocardium, or adjacent tissues. The T1 values were classified according to the American Heart Association 16-segment model. Reference Cerqueira, Weissman and Dilsizian7
Analysis methods. The images required for T1 mapping were taken in three short-axis slices (basal, mid, and apical) and measured T1 values.

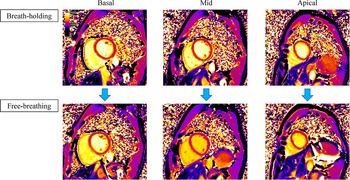
T1 mapping for each section. Images of T1 mapping for each section. The upper row is a breath-holding image, and the lower row is a free-breathing image.

All parameters are expressed as mean ± standard deviation (SD) values. The Shapiro–Wilk normality test was used to check the normal distribution of the data. Statistical differences were determined using the paired-samples t-test. A p-value < 0.05 indicates statistical significance. Statistical analysis was performed using the Statistical Package for the Social Sciences version 24.0 (IBM Corp., Armonk, New York, United States of America).
This study was performed according to the 2013 Declaration of Helsinki and the current ethical guidelines. It was approved by our institutional ethics board (Approval No. 19,250). Informed consent was obtained from all the patients or their legally authorised representatives.
Results
Table 1 shows the demographic data of the patients. One patient with post-operative total anomalous pulmonary venous return was excluded because deep breathing caused large artefacts in the images taken during free-breathing that could not be analysed. The mean age of the patients was 21.6 ± 7.1 years, and 47.6% were males. The mean height and weight were 163.6 ± 9.1 cm and 58.5 ± 13.7 kg, respectively. The mean heart rate was 71.7 ± 14.8 bpm.
The demographic characteristics

Data are given as mean and standard deviation.
The T1 values for breath-holding and free-breathing are shown in Table 2. The mean T1 values during breath-holding were 1211.1 ± 39.0 ms, 1209.7 ± 37.4 ms, and 1228.9 ± 52.5 ms in the basal, mid, and apical regions, respectively, and the mean T1 values during free-breathing were 1165.1 ± 69.0 ms, 1103.7 ± 55.8 ms, and 1112.0 ± 81.5 ms in the basal, mid, and apical regions, respectively. The Shapiro–Wilk normality test confirmed that each sample followed a normal distribution. The lower T1 values were observed during free-breathing than during breath-holding in almost all segments (basal: p = 0.008, mid: p < 0.001, apical: p < 0.001). The mean change in T1 values during free-breathing and breath-holding in each cross section was 3.1, 7.8, and 7.7% for the basal, mid, and apical regions, respectively (Fig 3a–c). Differences by sex were also examined. In both sexes, the lower T1 values were observed during free-breathing than during breath-holding in almost all segments. In the Bland–Altman analysis, the measurements in the basal region were randomly arranged around 0, indicating only random error. The measurements in the mid and apical regions often showed values higher than 0, indicating a fixed error. This indicated the presence of a higher degree of bias for T1 values during breath-holding than during free-breathing. (Fig 4a–c).
T1 mapping data

Data are given as mean and standard deviation.
( a–c ) T1 values for each section. Graphs of T1 values at each cross section for breath-holding and free-breathing. Free-breathing T1 values showed a lower than those of breath-holding in almost all segments. Comparing the mean values of each cross section, T1 values were lower by 3.1% for basal, by 7.8% for mid, and by 7.7% for apical as a result of free-breathing than those of breath-holding. * p < 0.05, † p < 0.01.

( a–c ) Bland–Altman Curve between breath-holding and free-breathing images. ( a ) Basal region, ( b ) mid region, and ( c ) apical region.

To ensure our methods’ reproducibility, we examined the intra-observer and inter-observer differences in the T1 values in the LV basal, mid, and apical walls. Strong correlation was observed between intra-observer and inter-observer values (r = 0. 95 and r = 0. 96, respectively).
Discussion
In the present study, we found that free-breathing T1 values in all cross sections of the basal, mid, and apical regions were lower by approximately 3–8% than those of breath-holding T1 values.
T1 mapping provides a quantitative estimate of the myocardial properties and is useful for evaluating myocardial fibrosis and oedema. Reference Taylor, Salerno and Dharmakumar1 Echocardiography and CT cannot quantitatively and objectively assess myocardial characteristics. In addition, although conventional delayed-contrast MRI is used for determining localised myocardial fibrosis, it is difficult to assess the entire myocardium. Thus, we think that T1 mapping can assess the entire myocardium and any potential damage quantitatively and will help monitor the progression of myocardial damage. In children, breath-holding cardiac MRI is difficult to perform unless manually ventilated under tracheal intubation and the examination is performed during free-breathing under sedation with intravenous anaesthesia. Therefore, it is essential to understand the changes in the T1 values due to respiration. In the present study, we found that free-breathing T1 values in all cross sections were 3–8% lower than breath-holding T1 values. Figure 2 shows clear changes in T1 images in the mid and apical regions between breath-holding and free-breathing. This indicates that T1 values in the basal region may be clinically assessable.
Myocardial T1 values are known to be affected by magnetic fields, heart rate, and respiratory motion. Reference Kellman and Hansen8 In this study, we found that respiration reduced the myocardial T1 values. Respiratory motion is known to cause errors in the pixel-by-pixel estimation of T1, degrading the final map. Reference Xue, Shah and Greiser9 Moreover, the motion artefact of the heart reduces T1 values. Reference Rauhalammi, Mangion and Barrientos10,Reference Dabir, Child and Kalra11 Since the movement of the diaphragm affects the movement of the myocardial wall, we think that this artefact may lower the myocardial T1 values. Our results suggest that the mid and apical regions are strongly affected by the artefacts caused by respiration, resulting in lower T1 values, whereas the basal region is less affected by respiration. Hence, myocardial T1 values in the basal region can be evaluated even in children. Bush et al reported that using the prospective motion correction strategy to measure T1 values during free-breathing produced results that were comparable to those during breath-holding to lessen the impact of breathing. It may be important to consider this method in children. Reference Bush, Pan and Jin12
The first limitation of this study is the small number of cases. In order to generalise this result, we need to accumulate more cases by performing large prospective studies. Second, the mean age of our sample population is more reflective of adolescent/adult patients, and there were no cases of ventilated children. Thus, it is unclear whether these results apply to infants and young children. Third, because free-breathing inevitably causes positional deviations in the measurement area, we used motion correction for visual checks. We tried to perform measurements in the same cross-sectional area; however, the results can be affected by even slight positional deviations.
In our study, we found that free-breathing T1 values in all cross sections were approximately 3–8% lower than breath-holding T1 values. It may be difficult to accurately assess myocardial T1 values with free-breathing, except in the basal region, because of underestimation. This should be taken into consideration when interpreting myocardial T1 values in children with CHD.
Acknowledgements
We would like to thank Editage (www.editage.com) for English language editing.
Financial support
This research did not receive specific grants from any funding agency, or commercial or non-profit entities.
Conflicts of interest
The authors declare that they have no conflicts of interest.
Ethical standards
This study was approved by the Asahikawa Medical University Institutional Review Board. All study participants provided informed consent.