1 Introduction
Over the last decade, many approaches are concerned with the extension of reinforcement learning (RL) to multi-agent systems (MAS) (Tuyls & Nowé, Reference Tuyls and Nowé2005; Dowling et al., Reference Dowling, Cunningham, Curran and Cahill2006; Busoniu et al., Reference Busoniu, Babuska and De Schutter2008). Adopting a decentralized point of view offers several potential advantages such as speed-up, scalability and robustness (Stone & Veloso, Reference Stone and Veloso2000). In addition, RL methods do not need any a priori knowledge about the dynamics of the environment, which can be stochastic and nonlinear. An RL agent learns by trial-and-error with its environment. The agent receives a scalar reward signal called reinforcement as performance feedback. RL methods rely on dynamic programming and have been studied extensively in the single-agent framework, where well-understood algorithms with good convergence properties are available (Kaelbling et al., Reference Kaelbling, Littman and Moore1996; Sutton & Barto, Reference Sutton and Barto1998). By using RL in MAS, we could get the best of both methods: autonomous and adaptative agents that can learn to resolve complex problems in a decentralized way.
Unfortunately, there are still many challenging issues in applying RL to MAS (Yang & Gu, Reference Yang and Gu2004). One difficulty is the loss of theoretical guarantees. Indeed convergence hypotheses of the single-agent framework frequently become invalid in multi-agent environments. For instance, the presence of multiple concurrent learners makes the environment non-stationary from a single agent's perspective, which is a commonly cited cause of difficulties in multi-agent learning systems (Bowling & Veloso, Reference Bowling and Veloso2000; Banerjee et al., Reference Banerjee, Sen and Peng2004; Abdallah & Lesser Reference Abdallah and Lesser2008). Another challenge is the difficulty of defining a good learning goal for the multiple RL agents (Busoniu et al., Reference Busoniu, Babuska and De Schutter2008). The matter of the communication between agents is also an important point: even if the use of communication can reduce some undesirable effects of locality in MAS (Mataric, Reference Mataric1998), exchanged information must be relevant to be efficient (Tan, Reference Tan1993; Balch & Arkin, Reference Balch and Arkin1994). Finally, a fundamental issue faced by agents that work together is how to efficiently coordinate themselves such that a coherent joint behavior results (Fulda & Ventura, Reference Fulda and Ventura2007).
Despite these difficulties, several successful applications of decentralized RL have been reported, like the control of a robotic manipulator (Busoniu et al., Reference Busoniu, Babuska and De Schutter2006), multi-robot cooperative transportation tasks (Wang & de Silva, Reference Wang and de Silva2008) or urban traffic control (Kuyer et al., Reference Kuyer, Whiteson, Bakker and Vlassis2008). We have an interest in practical applications in robotics, where multiple cooperative robots are able to complete tasks more quickly and reliably than one robot alone. We especially focus on learning algorithms in fully cooperative MAS. In such environments, the agents share common interests and the same reward function; the individual satisfaction is also the satisfaction of the group. The learning goal is thus well defined as maximizing the common discounted return. We focus on non-communicative agents called independent learners (ILs) that are unable to observe the actions of the other agents (Claus & Boutilier, Reference Claus and Boutilier1998). This choice is particularly pertinent given our objective of robotic applications with numerous agents, where the assumption of joint action observability is hard to satisfy.
Various RL algorithms have been proposed in the literature for ILs and fully cooperative MAS. Most of these algorithms were designed for specific tasks. However, in practice, their performances can greatly vary between successful and unsuccessful coordination of the agents. Moreover, the literature does not supply cross comparison between these methods. So an explanation of why and when these algorithms are able to work effectively and how they may prevent coordination issues is lacking.
This paper contributes to analyze the underlying conditions that lead each algorithm to address some coordination issues. We detail five problems responsible of the non-coordination of ILs in fully cooperative MAS. Then we provide a comprehensive review of RL algorithms for ILs in fully cooperative games from the viewpoint of these problems. A uniform notation is proposed that stresses common points between some of these methods. We also provide an empirical comparison through applications to a variety of non-trivial test environments designed to demonstrate the ability of the different approaches. Results allow us to analyze the strengths and weaknesses of reviewed algorithms according to properties of the environment and coordination problems. The analysis presented in this paper may be used as a tool to choose appropriate methods to specific tasks and to facilitate the development of new algorithms in fully cooperative games.
This paper is organized as follows: necessary background is given in Section 2. Section 3 addresses the ILs coordination problems, and Section 4 reviews RL algorithms based on Q-learning for ILs in fully cooperative games. Section 5 presents experimental results and an analysis versus coordination problems of the different approaches and Section 6 concludes the paper.
2 Background
In this section, we introduce some background materials that will be used throughout the paper.
2.1 Fully cooperative Markov games
Markov gamesFootnote 1 are the foundation for much of the research in multi-agent RL. Markov games are a superset of Markov decision processes and matrix games, including both multiple agents and multiple states.
Definition 1A Markov game (Shapley, Reference Shapley1953) is defined as a tuple <m, S, A 1, …, Am, T, R 1, …, Rm> where:
• m is the number of agents (or players);
• S is the finite set of states;
• Ai is the finite set of actions available to the agent i (and A= A 1× ⋯ × Am the joint action set);
• T : S × A× S ↦ [0;1] is the transition function such that ∀s ∈ S, ∀a ∈ A,

•
the reward function for agent i.

 the reward function for agent i.
In a Markov game, all agents are supposed to observe the complete state s. The transition and reward functions depend on the joint action. The transition function T gives the probability that action a in state s at time step t will lead to state s′ at step t + 1:

Note that joint actions and sets of joint action are typeset in bold throughout the paper, for example, a and A.
If all agents receive the same rewards (R 1 = ⋯ = Rm = R) the Markov game is fully cooperativeFootnote 2: a best-interest action of one agent is also a best-interest action of every agent.
2.2 Individual and joint policies
Definition 2An individual policy (or strategy) πi : S × Ai ↦ [0;1] for an agent i specifies a probability distribution over actions, that is, ∀ai ∈ Ai P(ai,t = ai | st = s) = πi(s, ai). The set of possible policies for the agent i is noted Δ(S, Ai).
Let π be the joint strategy of all the agents and π−i the joint strategy of all the agents except agent i. We shall use the notation 〈π i, π−i〉 to refer to the joint strategy where agent i follows πi while the other agents follow their policy from π−i.
2.3 Pareto-optimal Nash equilibrium
First, we define for each state s the long-term expected gain for agent i, that is the expected sum of future rewards when all the agents follow π from state s at time t:

where γ ∈ [0;1] is a discount factor and ri ,t is player i's payoff at time t.
From a game-theoretic point of view, two common concepts of equilibrium are used to define solutions in games. The first one is called Nash equilibrium (Nash, Reference Nash1950; Osborne & Rubinstein, Reference Osborne and Rubinstein1994).
Definition 3A joint policy π* defines a Nash equilibrium in a Markov game iff, for each agent i:

Thus, no agent can improve its long-term gain by unilaterally deviating from a Nash equilibrium. A Markov game can have more than one Nash equilibrium. However, a Nash equilibrium is not always the best group solution. For this the concept of Pareto-optimality is useful.
Definition 4A joint policy  Pareto-dominates another joint policy π, written
 , iff in all states:

Definition 5If a joint policy  is not Pareto-dominated by any other joint strategy, then
 is Pareto-optimal.
So a Pareto-optimal solution is one in which no agent's expected gain can be improved upon without decreasing the expected gain of any other agent. There are many examples of general-sum games where a Pareto-optimal solution is not a Nash equilibrium and vice-versa (e.g. the prisoner's dilemma). However, in fully cooperative games, every Pareto-optimal solution is also a Nash equilibrium as a corollary of the definition. There is no other joint strategy that delivers a higher payoff to any agent, hence nothing can be gained from unilateral deviation either.
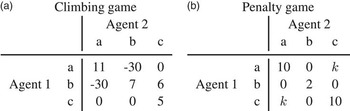
A good way to understand these concepts is to use simple matrix games. Matrix games can be seen as single-state Markov games. Matrix games are useful to put cooperation situations in a nutshell. For example, the matrix game in Figure 1a has two Nash equilibria corresponding to the joint strategies 〈a, a〉 and 〈b, b〉. The joint strategy 〈a, a〉 defines the only Pareto-optimal Nash equilibrium.
The climbing and penalty games (Claus & Boutilier, Reference Claus and Boutilier1998) are fully cooperative matrix games. Each agent chooses between three actions a, b and c. Both agents receive the payoff written in the corresponding cell

2.4 Summary
In this paper, we are interested in fully cooperative Markov games, where the common objective is defined as finding a Pareto-optimal Nash equilibrium, also called optimal equilibrium. Indeed, the policies that define Pareto-optimal Nash equilibria maximize the expected sum of the discounted rewards in the future for all agents. However, there can be several Pareto-optimal Nash equilibria so some coordination mechanisms on a single equilibrium are necessary.
3 The independent learner coordination problem
The main difficulty in the cooperative ILs framework is the coordination of ILs: how to make sure that all agents coherently choose their individual action such that the resulting joint action is Pareto-optimal? The coordination is a complex problem, which arises from the combined action of several factors. The analysis introduced in this section leads to a decomposition of the ILs coordination problem into major challenges. This analysis is restricted to games that do not allow threats and time-dependent games. Indeed, we focus on stationary and cooperative Markov games, so the transition and the reward functions are not time dependent. However, the agents’ strategies are subject to change with time. As the agents have to cooperate, they do not have any interest in threatening with their teammates. But they have to change their own policy to improve their rewards. So the other agents have to adapt to this change. Actually, from one agent's perspective, the local process is not stationary. The non-stationarity problem is one of the five challenges that are detailed in this section.
3.1 Independent learners
Claus and Boutilier (Reference Claus and Boutilier1998) distinguish two fundamental classes of learning agents: ILs and joint-action learners. The former cannot observe the rewards and actions of the other agents. Joint action learners, on the contrary, are capable of perceiving (a posteriori) their actions and/or their rewards, for instance in Littman (Reference Littman2001), Hu and Wellman (Reference Hu and Wellman2003) and Banerjee et al. (Reference Banerjee, Sen and Peng2004) to name a few. Recently, Bab and Brafman (Reference Bab and Brafman2008) proposed a comprehensive empirical study conducted on various joint action learning algorithms.
However, in many practical applications it is not reasonable to assume the observability of the actions of the other agents (Melo & Lopes, Reference Melo and Lopes2007). Most agents interact with their surroundings by relying on sensory information and action recognition that is often far from trivial. In this paper, we focus on ILs, these being more universally applicable. Without observations of the other agents’ actions and rewards, the IL approach raises some specific problems. On the other hand, it brings the benefit that the size of the state-action space is linear with the number of agents.
For instance, in the case of reinforcement learners, each agent i stores a local action-value function Qi(s, ai), which only depends on state s and on its own action ai. Qi(s, ai) is an estimation of the expected sum of future rewards when taking action ai from state s at time t and following π from then on:

This approach results in big storage and computational savings in the action-space. For example, with seven agents and six actions per agent only 42 Q-values have to be stored per state rather than 67 Q-values for joint-action learners.
In fully cooperative games, each agent may assume that the other agents will learn to act in the best-interest of the group. Under this optimistic assumption, Lauer and Riedmiller (Reference Lauer and Riedmiller2000) showed that ILs must find the optimal local action-value function to act optimally from the global perspective. But it is not a sufficient condition. It can happen that every agent selects an action that maximizes its own local Q-function, but that the combination of all agents’ elementary actions is not Pareto-optimal. This problem is the first challenge that ILs have to face to. We shall explore this issue more thoroughly in the following.
3.2 The Pareto-selection problem
We define the Pareto-selection problem as whenever there are at least two incompatible Pareto-optimal equilibria.
Definition 6Two equilibria πand  are incompatible iff,

This definition means that if one agent takes an action from a first equilibrium and the other agents from another one, the long-term expected gain is reduced.
The penalty game (Figure 1b) is usually chosen to illustrate the Pareto-selection problem. In this game:
• If k ≠ 10, there are two Pareto-optimal equilibria (〈a, a〉 and 〈c, c〉 if k < 10; 〈a, c〉 and 〈c, a〉 if k > 10); the set of individually optimal actions for each agent is then {a, c}; simply choosing an individual optimal action does not guarantee that the resulting joint action will be optimal as there are four resulting joint actions and only two of them are optimal; the equilibria are incompatible.
• If k = 10, there are four Pareto-optimal equilibria (〈a, a〉, 〈c, c〉, 〈a, c〉, 〈c, a〉); the set of individually optimal actions for each agent is always {a, c}, but there is no Pareto-selection problem as all the combinations of individual actions is a Pareto-optimal equilibrium; the equilibria are compatible.
Therefore, a Pareto-selection problem occurs when the mix of two Pareto-optimal equilibria is not Pareto-optimal anymore. This is somewhat stricter than the standard game-theoretic term, which refers to the task of selecting an optimal equilibrium from a set of (possibly sub-optimal) potential equilibria. Our definition is closer in spirit to the one of Fulda and Ventura (Reference Fulda and Ventura2007).
We can notice that the Wolpert's Collective Intelligence model (Wolpert & Tumer, Reference Wolpert and Tumer1999) aims to avoid the Pareto-selection problem by structuring the game, ensuring that actions that are locally good are always globally good. This method defines two key reward properties that are crucial to produce cooperative MAS in which agents acting to optimize their own agent rewards will also optimize the provided global reward (Wolpert & Tumer, Reference Wolpert and Tumer2001; Agogino & Turner, Reference Agogino and Turner2005). The first property concerns making sure the agents do not work at cross-purpose and align their rewards with the global reward. The second property, the ‘learnability’, measures the sensitivity of an agent's utility to its own actions as opposed to actions of others, which is often low in fully cooperative Markov games.
In the general case, for an IL, finding its optimal individual actions is not sufficient to find the optimal joint actions. An equilibrium-selection mechanism is required. The Pareto-selection problem is not the only challenge for ILs. As an agent is not aware of actions of the other agents, if the result of its individual action changed, it does not know if a teammate changed its policy or if some of them took an exploratory action or if the game is merely stochastic. We shall explore these issues in the following section.
3.3 The non-stationarity problem
ILs ignore the presence of the other agents in the system. That is, each agent can treat the other agents as part of its environment. The transition probabilities associated with the action of a single agent from one state to another are not stationary and change over time as the action choices of the other agents change. These choices are probably influenced by the past history of play, and so the history of play influences the future transition probabilities when revisiting a state. Therefore, from a single agent's perspective, the environment no longer appears Markovian and stationary (Bowling & Veloso, Reference Bowling and Veloso2000).
The Markov assumption and the stationarity property are critical to convergence guarantees for most single-agent learning algorithms (Sutton & Barto, Reference Sutton and Barto1998). This violation of basic assumptions requires specific techniques to learn effective policies in this context.
3.4 The stochasticity problem
In addition to be non-stationary from a single agent's perspective, the game itself can be non-deterministic. In practical applications, stochastic rewards or stochastic transitions can be induced by various phenomena as measurement noises, unobservable factors in the state space, etc.
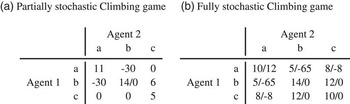
When the game is stochastic, the problem is to distinguish between different sources that cause the variation in the observed rewards. The variation can be due to the noise in the environment or to the behaviors of the other agents. For instance, in the partially stochastic climbing game (Figure 2a), an IL must distinguish if distinct rewards received for the action b are due to various behaviors of the other agent or to stochastic rewards. Especially the agent must learn that the average reward of the joint action 〈b, b〉 is 7 and thus that the action b is sub-optimal.
Stochastic variations of the climbing game proposed by Kapetanakis and Kudenko (Reference Kapetanakis and Kudenko2002). The probability of each reward is 50%

3.5 The alter-exploration problem
The exploration–exploitation trade-off requires RL algorithms to strike a balance between the exploitation of the agent's current knowledge and the exploration of new actions to improve that knowledge. The balance between exploration and exploitation is crucial for the efficiency of single-agent RL algorithms (Sutton & Barto, Reference Sutton and Barto1998; Singh et al., Reference Singh, Jaakkola, Littman and Szepesvari2000). It is also a necessity in MAS but the exploration of an agent induces noise in received rewards of the group.
So as to quantify the noise due to the exploration in a game, the concept of global exploration must be pointed out. The global exploration is the probability that at least one agent explores. It can be formulated using the individual exploration rate of each agent.
Property 1.Let an n-agents system in which each agent explores according to a probability ε. Then the probability that at least one agent explores is ψ = 1–(1–ε)n. ψ is named the global exploration.
Complications arise from the fact that the exploration of an agent can destabilize the learned policies of other ILs. For example, the exploration of an agent can lead to penalties and then it can influence the learned individual policies of the other agents. Moreover, it can cause the ‘destruction’ of the optimal policy of an IL (Laurent et al., Reference Laurent, Matignon and Le Fort-Piat2010). Indeed, an exploration action does not mean that an agent has changed its policy, so if the others adapt themselves to this different behavior too quickly, they may generate instabilities in their turn. This vicious circle, that we called the alter-exploration problem, is a strong challenge for IL.
A way of overcoming this problem could be that the agents explore or exploit in unison (Brafman & Tennenholtz, Reference Brafman and Tennenholtz2003). Another method is that RL algorithm must be robust against alter-explorations, that is, it allows the learning of individual policies while another agent is exploring. For this purpose, on the one hand, specific mechanisms can be defined to update the individual policy. On the other hand, pertinent choices of algorithm parameters may be advocated according to the global exploration.
The alter-exploration problem becomes more marked when the game presents specific equilibria called shadowed equilibria.
3.6 The shadowed equilibrium problem
The term of shadowed equilibrium has been introduced by Fulda and Ventura (Reference Fulda and Ventura2007) to describe the Pareto-selection problem. The formal definition we propose here is closer to the concept described by Panait et al. (Reference Panait, Tuyls and Luke2008).
Definition 7.An equilibrium defined by a policy  is shadowed by a policy
 in a state s iff:

An equilibrium is shadowed by another one if there exists one agent i that receives a very low gain by unilaterally deviating from this equilibrium and if this gain is lower than the minimal gain when deviating from the other equilibrium.
For instance, in the climbing game (Figure 1a, page 4), 〈a, a〉 defines a Pareto-optimal Nash equilibrium and 〈b, b〉 a sub-optimal Nash equilibrium. Mis-coordination penalties are linked to these equilibria but there are no mis-coordination penalties associated with action c. Indeed, the expected gain if one agent deviates unilaterally from a Nash equilibrium is inferior to the lowest expected gain if one agent deviates unilaterally from 〈c, c〉. Thus, in the climbing game, the Nash equilibria are shadowed by the joint action 〈c, c〉.
A non-shadowed joint action as 〈c, c〉 is potentially tempting for ILs. For instance, let agent 2 follow a policy π 2 such that it chooses its actions with equal probability. Then, the expected gain for agent 1 is

The theoretical–optimal individual action is a but the action c has the highest current action-value due to the exploration policy of agent 2.
The shadowed equilibrium problem is hard to overcome even in small matrix game. Thus, an additional mechanism is required to avoid sub-optimal policy caused by shadowed equilibria in the learning of ILs.
3.7 Summary
In this paper, we focus our study on cooperative ILs. In such a framework, the main issue is that the learners manage to coordinate. We have identified five factors which may be responsible of the non-coordination of the agents: the Pareto-selection problem, the non-stationarity problem, the stochasticity problem, the alter-exploration problem and the shadowed equilibrium problem. This classification may not be exhaustive because the general problem of coordination is complex in large games. However, we shall show that the presence or the absence of one of these factors decides on the success of following RL algorithms.
4 Related works in reinforcement learning
Various approaches have been proposed in the literature to overcome coordination problems in multi-independent-learners systems. Especially, several modifications to the Q-learning algorithm (Watkins & Dayan, Reference Watkins and Dayan1992) have been proposed for multi-agent environments. In this section, related works dealing with Q-learning variants for ILs are reviewed. The choice of the Q-learning algorithm results from its well-understanding that allows us to focus exclusively on how these algorithms address some coordination issues. We propose a uniform notation that has never been suggested for these algorithms and that stresses common points between some of them. Besides, explicit mechanisms used to resolve mis-coordination problems are detailed for each algorithm.
4.1 Decentralized Q-learning
Q-learning (Watkins & Dayan, Reference Watkins and Dayan1992) is one of the most used algorithm in the single-agent framework because of its simplicity and robustness. That is also why it was one of the first RL algorithm applied to multi-agent environments (Tan, Reference Tan1993). The update equation for agent i is

where Qi(s, ai) is the current estimation of the action-value function of agent i, s′ is the new state, ai is the agent's chosen action, r = R (s,〈ai, a −i〉) is the received reward, α ∈ [0;1] is the learning rate and γ ∈ [0;1] the discount factor.
Concerning the exploration–exploitation issue, the most popular undirected exploration methods are ε-greedy and softmax exploration strategies. An agent following the ε-greedy method selects a uniformly random action with probability ε and otherwise follows its greedy policyFootnote 3 based on Qi. Softmax computes the agent's individual policy πi using a Boltzman distribution:

where τ is the temperature parameter. High-temperature values encourage exploration.
In decentralized Q-learning, no coordination problems are explicitly addressed. However, it has been applied with success in some applications (Sen et al., Reference Sen, Sekaran and Hale1994; Sen & Sekaran, Reference Sen and Sekaran1998; Busoniu et al., Reference Busoniu, Babuska and De Schutter2006; Wang & de Silva, Reference Wang and de Silva2006; Tumer & Agogino, Reference Tumer and Agogino2007, Reference Tumer and Agogino2010). The relative success of this algorithm can be related to the choice of the exploration strategy. Most works concerning decentralized Q-learning use a greedy in the limit with infinite exploration (GLIE) strategy. GLIE strategy (Singh et al., Reference Singh, Jaakkola, Littman and Szepesvari2000) is a popular single-agent method that decreases the exploration frequency over time so that each agent should converge to a constant policy. However, few authors justify this choice in MAS. According to Claus and Boutilier (Reference Claus and Boutilier1998), this method can allow ILs to overcome some mis-coordination problems by reducing the simultaneous exploration of agents, namely the concurrent exploration. However, the use of a GLIE strategy does not ensure convergence to an optimal equilibrium (Claus & Boutilier, Reference Claus and Boutilier1998) and the key difficulty of this method is that the convergence relies on the choice of decaying parameters, as illustrated in Section 5.1.2.
4.2 Distributed Q-learning

Lauer and Riedmiller (Reference Lauer and Riedmiller2000) proposed the distributed Q-learning (Algorithm 1) that addresses three factors that can cause mis-coordination. The algorithm is based on ‘optimistic independent agents’. Such agents optimistically assume that all other agents will act to maximize their reward. Thus they neglect the penalties and update the evaluation of an action only if the new evaluation is greater than the previous one. This optimistic update avoids sub-optimal policies caused by shadowed equilibria.
In the case of multiple optimal joint actions in a state, an additional procedure for coordination is used to solve the Pareto-selection problem. This equilibria selection mechanism is a social convention (Boutilier, Reference Boutilier1996), which places constraints on the possible action choices of the agents. The central idea is to update the current policy πi only if πi is not greedy anymore. Thus the policy of an agent remains constant if no improvement occurs.
The combination of these both mechanisms has the other interesting property to allow simultaneously the learning of individual policies and exploration. The individual policies cannot be ‘destroyed’ by exploration. Thus, distributed Q-learning is robust against the alter-exploration problem.
In addition, it is proved that this algorithm finds optimal policies in deterministic environments for cooperative Markov games. However, this approach may not converge to optimal policies in stochastic environments.
4.3 Hysteretic and lenient learners
Some works in the literature are interested in varying the ‘degree of optimism’ of the agents. Optimistic learners, used in distributed Q-learning, always ignore penalties in the update because they are supposed to be only caused by actions of exploration of the others. Thus, in stochastic games where penalties are also due to the noise in the environment, optimistic learners overestimate real Qi values.
To avoid this overestimation in stochastic games, we introduced hysteretic learners (Matignon et al., Reference Matignon, Laurent and Le Fort-Piat2007). The idea is that the agents should not be altogether blind to penalties at the risk of ignoring the noise due to environment. But they must be chiefly optimistic to reduce oscillations in the learned policy. Based on Q-learning, the hysteretic Q-learning uses two learning rates α and β for the increase and the decrease of Qi-values. The update equation for agent i is


where α>β to obtain chiefly optimistic learners. The main objectives of these two learning rates are to handle stochasticity and to minimize the effect of shadowed equilibria. By applying this algorithm in various test environments, we observe that the use of a GLIE strategy is required.
Panait et al. (Reference Panait, Sullivan and Luke2006) are interested in varying the degree of optimism of the agents over time. Indeed, being optimistic may be useful at early stages of learning to identify promising actions. They use lenient learners in their algorithm, called lenient multi-agent RL. In case of lenient learners, agents are exploring at the beginning so most selected actions are poor choices and ignoring penalties is therefore justified. Nevertheless, it may lead to an overestimation of actions, especially in stochastic domains where rewards are noisy. And once agents have explored, it becomes interesting to achieve accurate estimation of actions. So the agents are initially lenient (or optimistic) and the degree of leniency decreases as the action is often selected. A temperature is associated with each action so that the degree of leniency may be proportional to the temperature. At each selection of an action, its associated temperature decreases and the agent is then less lenient concerning the evaluation of this action. A GLIE exploration strategy must also be used. So lenient multi-agent RL has a set of parameters for decaying the lenience degree and another one for decaying the exploration probability. These sets of parameters pose inter-parameter dependencies. The main drawbacks of this method are that parameter tuning is difficult and that it is only proposed for matrix games.
4.4 Win-or-learn fast policy hill climbing (WoLF PHC)

The WoLF PHC algorithm works by applying the WoLF principle to the PHC algorithm (Bowling & Veloso, Reference Bowling and Veloso2002).
The PHC algorithm is a simple extension of Q-learning, which performs hill-climbing in the space of policies. Q-values are maintained just as in normal Q-learning. In addition, the algorithm maintains the current policy. The policy is improved by increasing the probability that it selects the greedy action according to a learning rate δ.
The WoLF heuristic uses two learning rates to adjust the policy: δw and δl depending on whether the agent is currently winning or losing. This determination is done by comparing whether the current expected value of the policy πi is greater than the current expected value of the average policy  . If the current expected value is lower, then the agent is losing; otherwise it is winning. When the agent is winning, a low learning rate is chosen because there are no reasons for the agent to change its policy. When the agent is losing, a high learning rate is used to quickly adapt its policy to other players’ strategies. Practically, learning parameters are chosen such as δl > δw. The full algorithm is shown in Algorithm 2.
This approach and its variants (Banerjee & Peng, Reference Banerjee and Peng2003; Bowling, 2005) have been designed for competitive games. However, WoLF PHC could be used in a cooperative task as well. The variable learning rate has the effect to minimize the influence of poor actions of other agents on the agent's own learning. So WoLF PHC is basically robust against the alter-exploration problem. The fact that this algorithm explicitly represents the policy independently of the value function may be a way to prevent Pareto-selection problems. The WoLF PHC convergence to optimal policies has been demonstrated empirically on a number of zero-sum and general-sum stochastic games (Bowling & Veloso, Reference Bowling and Veloso2002).
4.5 Recursive frequency maximum Q-value

Kapetanakis and Kudenko (Reference Kapetanakis and Kudenko2002, Reference Kapetanakis and Kudenko2004) proposed to bias the probability of choosing an action with the frequency of receiving the maximum reward for that action. Their algorithm, named Frequency Maximum Q-Value (FMQ), performs well in partially stochastic matrix games with a well chosen GLIE strategy. However, we showed in a previous paper that the FMQ is not robust against the alter-exploration problem (Matignon et al., Reference Matignon, Laurent and Le Fort-Piat2008). We developed an improved version of FMQ, called recursive FMQ, that is more robust and requires less parameters to tune (a GLIE strategy is not required anymore).
As the FMQ algorithm, the recursive FMQ algorithm has common points with both decentralized and distributed Q-Learning algorithms. As we can see in Algorithm 3, both Qi and Qi ,max tables are computed. The frequency, noted Fi(a), is an estimation of the occurrence of receiving the maximum reward when the action a is done. The frequency is recursively computed using a learning rate αf so as to obtain a frequency robust against alter-exploration.
The key idea is to evaluate the actions using a linear interpolation based on the occurrence frequency and bounded by the Qmax and Q values. Thus, actions evaluations fluctuate between optimistic and mean evaluations according to the stochasticity of the game, that is estimated with the occurrence frequency. Especially, if the game is deterministic and the agents manage to coordinate on an optimal joint action, frequencies of individual optimal actions will be close to 1 and agents will be then optimistic. The principle is closest in spirit to lenient learners (cf. Section 4.3) given that the degree of optimism of the agents can change. But concerning lenient learners, the degree of optimism inevitably decreases, although here, if the agents manage to coordinate in a deterministic environment, they stay optimistic. So they are bound to converge to the optimal joint action in deterministic environments. With this aim in view, the recursive FMQ uses the same equilibria selection mechanism as distributed Q-Learning.
The recursive FMQ algorithm was designed to overcome all coordination problems in partially stochastic matrix games. Its main drawback is that it is only suited to solve matrix games.
4.6 Implicit coordination with list index
Lauer and Riedmiller (Reference Lauer and Riedmiller2004) proposed an implicit mechanism that allows ILs to distinguish between different joint actions without knowing what exactly the joint actions are. The key idea of implicit coordination is to maintain Qi values in list-based data structures instead of tables. It allows to use index to reference a joint action. Thus, with the assumption that every agent independently selects the same index, joint action values are implicitly computed by ILs. Thanks to the distinction between joint actions; the algorithm overcomes all mis-coordination challenges. The algorithm and its theoretical proof of convergence are in Lauer and Riedmiller (Reference Lauer and Riedmiller2004). However, an obvious limitation is its application in Markov games because of the combinatorial explosion of the number of joint actions and so of the size of the lists. The authors developed a reduced-lists algorithm that still appears difficult to apply in large multi-state games. The use of function approximators with implicit coordination is also discussed in Gabel and Riedmiller (Reference Gabel and Riedmiller2006).
4.7 Synthesis
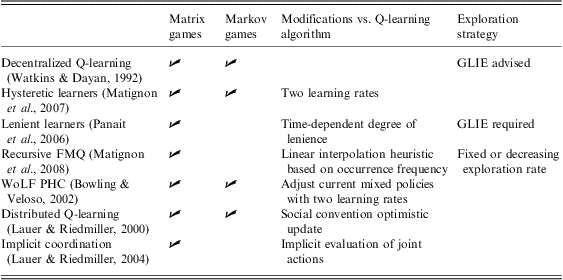
Table 1 summarizes the characteristics of reviewed RL algorithms for ILs in cooperative games. For each algorithm, modifications made regarding decentralized Q-learning are specified. The review proposed in this section explains how these modifications aim at overcoming some mis-coordination factors, yet only some of them are theoretically justified. Anyway, an analysis of the real abilities of these methods is required to go into detail concerning this study, especially concerning algorithms that have no theoretical guarantees. In the next section, various experimental benchmarks are presented to illustrate how modifications are able to work effectively and to show real strengths and weaknesses of each method.
Characteristics of reviewed RL algorithms for ILs in cooperative games
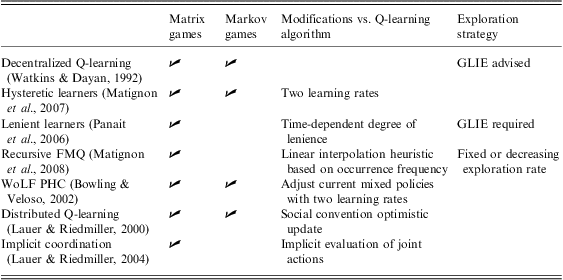
RL = reinforcement learning; IL = independent learner; GLIE = greedy in the limit with infinite exploration; FMQ = frequency maximum Q-value; WoLF PHC = win-or-learn fast policy hill climbing.
We also point out the exploration strategy recommended by the authors or that is more effective in practice. It must already be noticed that a GLIE strategy is difficult to set and requires much domain knowledge, as it will be shown in Section 5.
In the following experimentations, we concentrate on a selection of these methods. Notably, we will not study lenient learners because parameter tuning is too difficult and the results of this method are empirically found to be equivalent to FMQ (Panait et al., Reference Panait, Sullivan and Luke2006). We shall also ignore implicit coordination as its fundamental principle is impractical in multi-state games and because its abilities do not need to be illustrated given that it has a theoretical proof of convergence.
5 Experimental results and analysis
This section describes experiments with various non-trivial test environments. The benchmarks include various levels of difficulty according to the number of agents (two and more), the number of states (single and multi-state games), the state observability (full or incomplete) and coordination problems (shadowed equilibria, Pareto-selection, deterministic or stochastic environments). They were designed to cleverly combine these challenges and for each benchmark, we describe accurately how each challenge is present.
These benchmarks allow us to compare the performance of reviewed algorithms according to the properties of the environment and the coordination issues. We compare decentralized Q-learning, distributed Q-learning, WoLF PHC, hysteretic learners and recursive FMQ. Note that recursive FMQ is only tested in matrix games as it has not been designed for multi-state games. These algorithms are examined with the aim to get a clear view of their realistic performances with respect to the difficulties of the benchmarks.
The experiments have been conducted using BOSARFootnote 4, a library we developed. BOSAR was designed to study and develop RL algorithms. BOSAR is implemented in C/C++ programming language and supplies documentation and interfaces for Matlab–Simulink. BOSAR is free, open source software (GNU GPL licence) available at http://www.lab.cnrs.fr/openblockslib. All algorithms and benchmarks used in this article are implemented in BOSAR.
5.1 Matrix games
We first present experiments in matrix games, and then proceed with the sensitivity of the algorithms to the parameters of the GLIE strategy.
5.1.1 Penalty and climbing games
First, we apply the algorithms to the cooperative matrix games presented in Figures 1 and 2 (pages 4, 6). These games have received considerable attention from the community (Claus & Boutilier, Reference Claus and Boutilier1998; Lauer & Riedmiller, Reference Lauer and Riedmiller2004; Carpenter & Kudenko, Reference Carpenter and Kudenko2005; Kapetanakis et al., Reference Kapetanakis, Kudenko and Strens2005; McGlohon & Sen, Reference McGlohon and Sen2005; Verbeeck et al., Reference Verbeeck, Nowé, Parent and Tuyls2007) as they remain challenging for state-of-the-art algorithms despite their apparent simplicity. Indeed, even a simple game with two players and few actions can be challenging if agents are unaware of the game and independent (Abdallah & Lesser, Reference Abdallah and Lesser2008). Moreover, they are interesting because they pose specific problems to learn to coordinate. All mis-coordination factors can easily be identifiable and combined in these games (cf. Section 3). So using these games is a preamble to Markov games study and makes the analysis and understanding of coordination techniques easier.
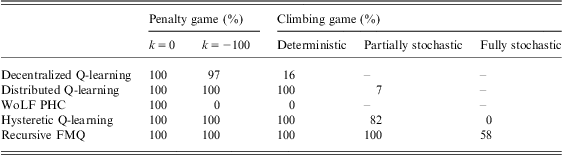
Table 2 shows the percentage of trials converging to the optimal joint action according to the algorithm and the game. Results were obtained with the best chosen and tuned action selection strategy in order to achieve the best results of convergence (cf. Appendix A). This parameter tuning is based more on intuition and trial-and-error than on theoretical results. We can notice that
Percentage of trials that converged to the optimal joint action (averaged over 500 trials)
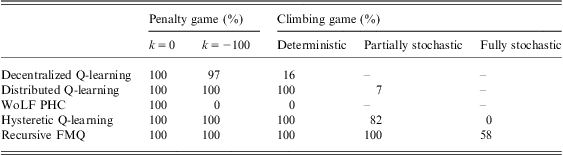
WoLF PHC = win-or-learn fast policy hill climbing; FMQ = frequency maximum Q-value.
A trial consists of 1000, 3000 or 5000 repetitions of the game according to the algorithm and the action selection strategy used (chosen parameters are specified in Appendix A). At the end of each trial, we determine if the greedy joint action is the optimal one. Entries marked with ‘–’ indicate it has not been tested.
• all algorithms find the optimal joint action in the penalty game with k = 0, where there is only a Pareto-selection problem. However, decentralized and hysteretic Q-learning do not have explicit mechanism to resolve Pareto-selection. Presumably this satisfactory behavior stems from the GLIE strategy that plays an implicit equilibria selection role by reducing the noise due to the concurrent exploration;
• with decentralized Q-learning the agents manage to coordinate depending on the structure of the game and on the chosen exploration strategy. It does not overcome shadowed equilibria in the climbing game. Penalties induce decentralized Q-learning agents to converge towards unshadowed equilibria;
• as expected, distributed Q-learning manages the convergence with a stationary exploration strategy in deterministic games only;
• WoLF PHC only converges in the penalty game with k = 0. Indeed, it seems that it does not overcome shadowed equilibria;
• hysteretic Q-learning and recursive FMQ both converge in deterministic games and partially stochastic version of the climbing game, but the coordination is still difficult in fully stochastic game. The recursive FMQ algorithm shows the best results and manages the convergence with a stationary exploration strategy.
Additionally, it is interesting to point out that the learners fail to coordinate with all algorithms in the fully stochastic climbing game.
5.1.2 The exploration strategy issue
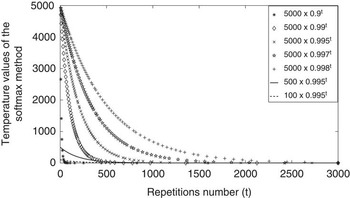
A GLIE strategy is advised with some algorithms as it can allow ILs to overcome some mis-coordination factors, especially when there are no explicit coordination mechanisms implemented in the method. In previous experiments, the agents manage to coordinate with decentralized Q-learning in the penalty game because the GLIE strategy has been well chosen. But the success of this algorithm is sensitive to the parameters of the GLIE strategy. Results of decentralized Q-learning with various GLIE strategies are presented in Table 3. The temperature values used with each GLIE strategy are plotted in Figure 3. These results illustrate the difficulty to choose these parameters; changing just one setting in GLIE parameters can turn a successful experiment into an unsuccessful one. The setting of GLIE parameters requires high understanding of algorithm behavior and is task specific. For instance, if parameters are chosen such as the probability to explore falls before interesting parts of the environment are sufficiently visited, the result is sub-optimal.
Percentage of trials that converged to the optimal joint action with decentralized Q-learning (averaged over 1000 trials)

GLIE = greedy in the limit with infinite exploration.
A trial consists of 3000 repetitions of the game. At the end of each trial, we determine if the greedy joint action is the optimal one. Results were obtained with softmax decision and GLIE strategies (τ = τini × δ t where t is the repetitions number).
Plots of the temperature functions (τ = τini × δ t) used in Table 3

This GLIE method is therefore difficult to apply in practice. On the contrary, distributed Q-Learning, recursive FMQ and WoLF PHC are working with a stationary exploration strategy. They only require a minimum of exploration in order to discover the optimal joint action. The level of the exploration rate has a low influence on the convergence. This independence of the exploration strategy is a clear benefit of these methods.
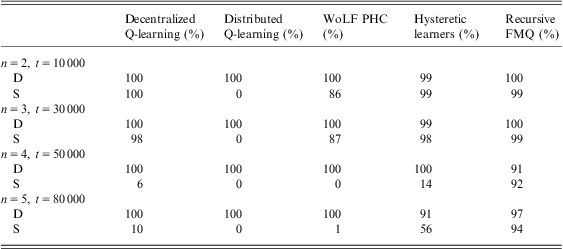
5.1.3 Penalty game with n ⩾ 2 agents
So far, we considered only two-player games. However, difficulties increase with the number of agents, notably:
• the noise due to various behaviors of the others is larger. So it is more difficult to distinguish noise due to the environment from noise due to the exploration actions of the others;
• a large number of repetitions is required so that all joint actions are played. The number of joint actions is exponential with the number of agents so the number of repetitions per trial is growing with the number of agents. With a GLIE strategy, the exploration frequency must be decreased slowly to avoid convergence towards sub-optimal equilibria. So GLIE strategy is even more difficult to choose. With a stationary strategy, a sufficient exploration must be realized for agents to find optimal equilibria. But the global exploration must also be limited to avoid too much noise.
To test how each algorithm copes with these difficulties, we devised a penalty game with n ⩾ 2 agents in which mis-coordination factors can easily be combined. Each agent has three actions: a, b and c. If half the agents or more play a and the others play c, the received reward is 10. If less than half the agents play a and the others play c, the received reward is −100 since they fail to coordinate. If half the agents or more play b and the others play c, the received reward is 2 in the deterministic modeFootnote 5. Otherwise the reward is 0.
There are many Pareto-optimal Nash equilibria when half agents or more play a and the others play c. These optimal equilibria are shadowed by penalties in case of mis-coordination. There are also many sub-optimal Nash equilibria when half agents or more play b and the others play c. Additionally, rewards can be noised. So, Pareto-selection, shadowed equilibria and stochasticity are present in our multi-player penalty game.
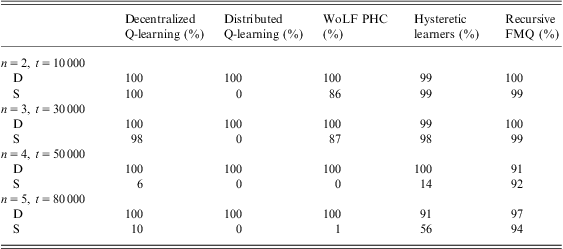
Results with two to five agents are presented in Table 4. Chosen parameters, found by trial-and-error, are specified in Appendix B. It is first interesting to stress that when the greedy joint action is not the optimal one, the agents always coordinate on the sub-optimal Nash equilibria. Moreover, we can notice that
Percentage of trials that converged to the optimal joint action in penalty game with n > 2 agents in D and S modes (averaged over 500 trials)
D = deterministic; S = stochastic; WoLF PHC = win-or-learn fast policy hill climbing; FMQ = frequency maximum Q-value.
A trial consists of t repetitions of the game. Chosen parameters are specified in Appendix B. At the end of each trial, we determine if the greedy joint action is optimal.
• decentralized Q-learning succeeds in deterministic games with a well-chosen GLIE strategy. In stochastic games, its performances greatly reduce with the number of agents;
• distributed Q-learning complies with theoretical guarantees: it succeeds in all deterministic games but fails in stochastic games;
• WoLF PHC algorithm fails as soon as rewards are noisy: in stochastic games, these algorithms converge towards non-shadowed equilibria;
• hysteretic learners manage to coordinate in deterministic games. Yet in stochastic games, they do not handle stochastic rewards. Presumably this is because of the lack of robustness of this method against alter-exploration and the difficulty to tune GLIE parameters and β. Indeed, hysteretic learning poses inter-parameter dependencies: the more the exploration of the others is large, the more the agents must be optimistic. So β must be chosen according to the exploration strategy. This issue may be explored thoroughly to improve the hysteretic Q-learning usefulness;
• best results are achieved with recursive FMQ. It succeeds more than nine times out of ten with all games. The frequency achieves the distinction between the noise due to the stochastic environment and the noise due to the actions of the others.
5.2 Markov games
We now experiment multi-state domains with algorithms designed for Markov games, that is, decentralized Q-learning, distributed Q-learning, WoLF PHC and hysteretic Q-learning. In a concern to be fair, all algorithms used ε-greedy selection method with a stationary strategy and global exploration of ψ = 0.1. It allows to check the robustness against alter-exploration of each method. Likewise, the same initial values are chosen for all of the experiments so as to conduct fair comparisons between algorithms. Thus Qmax-values were initialized to the lowest reward (as specified in Algorithm 1) and Q-values to zero for all the experiments.
5.2.1 Boutilier's coordination Markov game
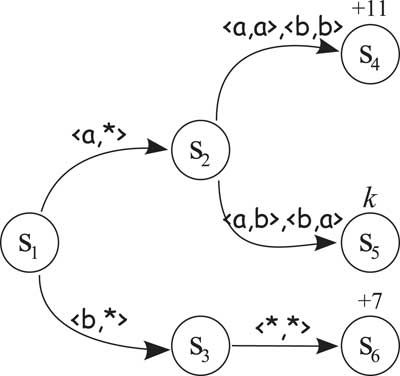
Boutilier's coordination game with two agents was introduced in Boutilier (Reference Boutilier1999) and is shown in Figure 4. This multi-state benchmark is interesting because all mis-coordination problems can easily be integrated and combined. The transitions on the diagram are marked by the pair of corresponding actions, denoting player 1's move and player 2's move, respectively. ‘*’ is a wild card representing any action. States that yield a reward are marked with the respective value, otherwise the reward is 0.
Boutilier's coordination game
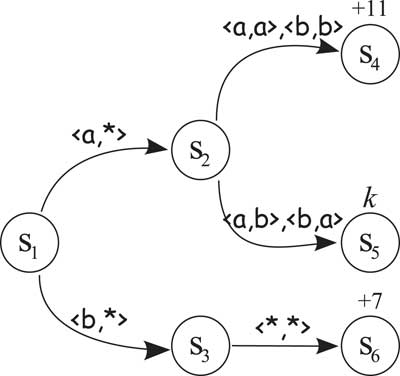
Mis-coordination challenges can easily be combined in this game. First, a coordination issue arises in state s 2 because both agents should agree on the same action. There are two Pareto-optimal equilibria so the agents have to cope with a Pareto-selection problem. Second, by choosing a high penalty k, this game combines Pareto-selection and shadowed equilibria; indeed the potential of choosing the action a for the first agent in the state s 1 is shadowed by the penalty k associated to mis-coordination in s 2. Finally, we also propose a partially stochastic version of the Boutilier's game with a random reward (14 or 0) received in state s 6 with equal probability instead of 7. Thus the challenge of stochasticity can also be added.
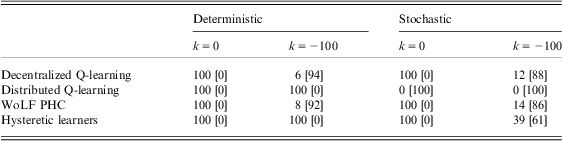
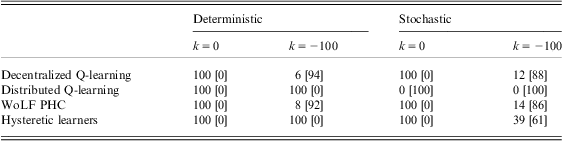
A step starts with both agents in state s 1 and ends when agents reach one of the absorbing states (s 4, s 5 or s 6). A trial consists of 10 000 learning steps. At the end of each trial, we determine if the greedy joint policy is optimal. Results are given in Table 5.
Percentage of trials that converged to the state s 4 in Boutilier's coordination game (averaged over 200 trials)
WoLF PHC = win-or-learn fast policy hill climbing.
A trial consists of 10 000 learning steps; at the end of each trial, we determine which absorbing state is reached when the agents follow their greedy joint policy. State s 4 is reached x% of the trials and state s 6 is reached y% of the trials. Results are noted as x% [y%]. We set α = 0.1, ψ = 0.0975, γ = 0.9, δlose = 0.06, δwin = 0.03, ε = 0.05, Qini = 0 and Qmax ,ini = k. β = 0.01 in deterministic games and β = 0.05 in stochastic games.
It is first interesting to stress that when the greedy joint action is not the optimal one, the agents always coordinate on the sub-optimal Nash equilibria.
In the deterministic game with k = 0, the agents manage to coordinate with all algorithms. Similarly, in the stochastic game with k = 0, all algorithms succeed except distributed Q-learning as it does not overcome the stochasticity problem. When mis-coordination penalties are introduced in the deterministic game, decentralized Q-learning and WoLF PHC fail because of shadowed equilibria. Distributed Q-learning and hysteretic Q-learning succeed in the coordination. But in the stochastic version with k = −100, all coordination challenges are present and the agents fail to coordinate with all algorithms.
5.2.2 Two predators pursuit domain
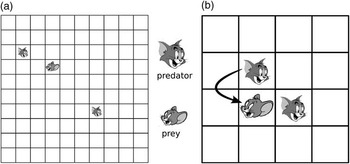
The pursuit problem is a popular multi-agent domain in which some agents, called predators, have to capture one or several preys in a gridworld (Benda et al., Reference Benda, Jagannathan and Dodhiawala1986). In the two-predator pursuit domain, agents have to explicitly coordinate their actions in order to capture a single prey in a discrete 10 × 10 toroidal grid environment (Figure 5a). At each time step, both predators simultaneously execute one of the five possible actions: move north, south, east, west or stand still. Any action moves a predator in the intended direction with probability 0.8, and otherwise a random action is applied. The prey moves according to a randomized policy: it remains on its current position with a probability of 0.2, and otherwise moves to one of its free adjacent cells with uniform probabilities. The prey is captured when both predators are located in cells adjacent to the prey, and one of the two predators moves to the location of the prey while the other predator remains, for support, on its current position (Figure 5b). After a capture, predators and prey are set up in distinct random positions.
Two predators pursuit problem

The state space is represented by the relative position of the two predators to the prey: each IL computes a Qi table with 100 × 100 × 5 values. A capture results in a reward of 10 for every agent. Furthermore, both predators receive a penalty of −50 when one of them moves to the prey without support or when they end up in the same cell. In both cases, the agents are moved to a random, empty cell. In all other situations, the reward is 0.
The main factors that complicate the coordination are action shadowing induced by penalties in case of mis-coordination, Pareto-selection as there are several capture solutions and the stochastic environment due to the random behavior of the prey and the uncertainty in action results.
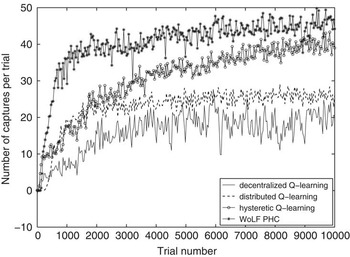
A trial consists of 1000 steps. After each learning trial is done a greedy trial in which agents are following their learned greedy policies. For each greedy trial, we plot the number of captures. Results obtained on 10 000 greedy trials are given in Figure 6. We also specify the number of received penalties during the last 1000 greedy trials to check if the agents manage to coordinate themselves so as to avoid collisions and non-support (Table 6). We can notice that
Number of captures for 10 000 trials in the two predators pursuit domain (averaged over five runs) with α = 0.1, ψ = 0.1, β = 0.01, δlose = 0.06, δwin = 0.03, γ = 0.9, Qini = 0, Qmax ,ini = −50

Number of received penalties in the two predators pursuit domain during the last 1000 trials (averaged over five runs)

WoLF PHC = win-or-learn fast policy hill climbing.
• greedy policies learned with decentralized Q-learning are not stable and the number of captures per trial is the lowest of all the methods we tested. Some reasons of these difficulties are provably the Pareto-selection combined with mis-coordination penalties and the lack of robustness against exploration that leads to the destruction of individual policies. A suited GLIE strategy may give better results, but its adjustment would be difficult. However, it has to be stated that this method involves the least number of received penalties (Table 6);
• despite the stochastic environment, greedy policies learned with distributed Q-learning manage around 25 captures per trial after 10 000 greedy trials. We can notice that as optimistic agents are blind to penalties, they have difficulty in coordinating themselves so as to avoid collisions and non-support;
• hysteretic Q-learning and WoLF PHC show best results with around 40 captures per trial after 10 000 greedy trials.
5.2.3 Four predators pursuit domain
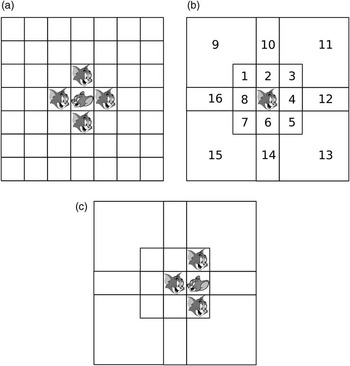
In the four-predator pursuit domains, four agents have to coordinate their actions in order to surround a single prey in a discrete 7 × 7 toroidal grid environment (Figure 7a). The observations of the agents suffer from low resolution. Indeed, a predator perceives the others according to the eight cardinal directions and according to a distance criterion (Figure 7b), that gives 16 possible observations. Given that each predator perceives its three teammates plus the prey, there are 164 possible observations per agent. Each agent has five possible actions, that is, a Qi-table of size 164 × 5 for each predator. Concerning the reinforcement function, if at least one agent is in the situation in Figure 7c, every agent receives R = 25. The low resolution in the perception induces stochasticity in the environment so the main factor here that complicates the coordination of predators is the noise.
Four predators pursuit problem. (a) The prey is captured. (b) The 16 possible observations of the positions of a teammate. (c) One of the four rewarded situations (similar situations are obtained by rotation of 90°)

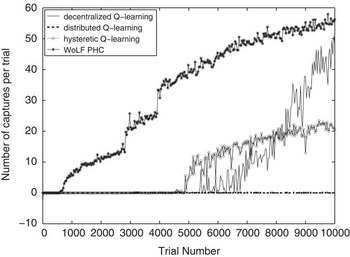
A trial consists of 1000 steps. After each learning trial is done a greedy trial in which agents are following their learned greedy policies. For each greedy trial, we plot the number of captures. Results are given in Figure 8. We can notice that
Number of captures for 10 000 trials in the four predators pursuit domain (averaged over five runs) with α = 0.3, ψ = 0.1, β = 0.03, δlose = 0.06, δwin = 0.03, γ = 0.9 and Qini = 0

• decentralized Q-learning shows interesting results in this stochastic environment. Although the first captures require a lot of trials (more than 5000) and learned policies are not stable, it is interesting to notice that once the agents manage to coordinate, the number of captures quickly increases. It confirms that this algorithm can be applied with success on some MAS and manages the coordination to some extent;
• the agents that learn with distributed Q-learning do not manage to coordinate. The low resolution in perceptions induces stochasticity in the environment that puts optimistic agents in the dark;
• WoLF PHC shows best results on average but the performances are variable: for three runs, around 100 captures are realized after 10 000 trials, but for the two other runs, no capture has been performed after 10 000 trials yet;
• hysteretic Q-learning manages first captures at the same time as decentralized Q-learning, but its performance increases slowly.
5.2.4 Discrete smart surface with 270 agents
Finally, we have developed a benchmark inspired from distributed manipulation systems (Luntz et al., Reference Luntz, Messner and Choset2001) and called discrete smart surface benchmark. The system is an array of 270 actuators (Figure 9). At each time step, all actuators simultaneously execute one of the five possible actions: north, south, east, west or nop, represented by an arrow or a circle. Uncertainty is added to action results: with a probability 0.001, each actuator executes a random action. A 3 × 2 object is situated on the surface. The motion of the object is given by the weighted sum of the actuators’ actions, which are under and by the object. The weight given to the actions of the actuators by the object is 3. The weight given to the actions of the actuators under the object is 1. The object moves in the four cardinal directions but it does not rotate. Additionally, the object cannot get out of the surface and instead stays by the edge. The system's state is the position of the object on the grid (according to its upper left corner). Each actuator is driven by an independent agent, which has only access to the position and to its own actions. For the agents, the goal is to cooperate so as to move the object to a goal position. In this case, all agents receive R = 10. If the object touches the east and west edges of the surface, every agent receives a penalty (R = −50). Otherwise the reward is 0. A trial starts with the object at its initial position and ends when the object reaches the goal position, which is an absorbing state.
Discrete smart surface benchmark with 9 × 30 agents

This benchmark brings together action shadowing induced by penalties, Pareto-selection as there are several possibilities to reach the goal state, and stochasticity due to uncertainty in action results. Anyway, the main interest of this benchmark is to study the coordination of a large number of agents in a Markov game. Indeed, at each time step, agents under and by the object must coordinate themselves, that is, 16 agents.
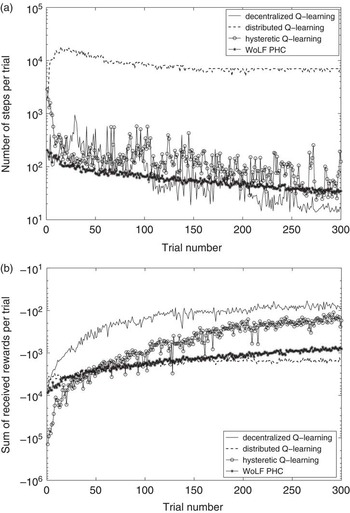
For each trial, we plot the number of steps to goal and the sum of received rewards (Figure 10). With the sum of received rewards, we can observe if the object touches the east and west edges of the surface. With the number of steps to the goal, we can check if the learned policies are close to best policy, which makes three steps per trial (without uncertainty). We can notice that
Steps to goal (on the top) and sum of rewards received at each trial by an agent (on the bottom) vs. trial number (averaged over 100 runs and logarithmic scale). α = 0.1, ε = 0.0005, β = 0.01, δlose = 0.06, δwin = 0.03, γ = 0.9, Qini = 0 and Qmax ,ini = −50

• the environment is stochastic, so distributed Q-learning fails to coordinate. Moreover, the sum of received rewards per trial is low because optimistic agents are blind to penalties; they do not avoid edges of the surface;
• decentralized Q-learning shows interesting results: after 300 trials, 20 steps are required to reach the goal and the object touches edges of the surface around four times per trial. However, learned policies are not stable. Mis-coordination penalties and the lack of robustness against exploration lead to destruction of individual policies. During the experimentations, we notice that agents coordinate to avoid edges: the object moves round in circles without penalties;
• hysteretic Q-learning is close to decentralized Q-learning. But as these agents are chiefly optimistic, they do not avoid as much the edges and the sum of rewards increases slowly;
• with WoLF PHC, learned policies are stable but the convergence is slow. Moreover, agents receive many penalties.
5.3 Summary and analysis
The results on various matrix and Markov games illustrate the strengths and weaknesses of each algorithm regarding coordination problems and highlight the importance of exploration. Especially, GLIE strategy suitable for one environment or one algorithm may be very inefficient with other benchmarks or other methods. Moreover, the robustness against alter-exploration is a key feature. Indeed, it is crucial for the agents to be able to learn their individual policies while some of them are taking actions of explorationFootnote 6. Distributed Q-learning, WoLF PHC and recursive FMQ have this feature.
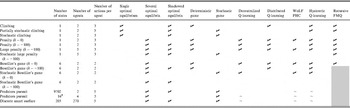
The characteristics of each tested environment and results of coordination for each algorithm are summarized in Table 7. In single-state game or simple multi-state games, we can easily conclude about the achievement of the coordination as we can evaluate the greedy policy to the optimal one. Yet in more complex games as predators pursuit or smart surface, we cannot always conclude the effectiveness of the coordination because we do not know the optimal strategy but only how well the agents could perform in some restricted conditions. For instance with the discrete smart surface benchmark, we know that the best policies in case of deterministic actions make three steps per trial; so in case of stochastic actions, it will probably take slightly more than three steps on average. So we can only check if the learned policies under uncertainty are close to best policies in case of deterministic actions. That is why in these complex benchmarks, we analyze our results by comparing the algorithms to each other and to the one showing the best results of convergence in the benchmark. We observe that most of the algorithms converge and they will likely end up reaching the same values after a large number of trials. It has to be noticed that with no algorithms the learners manage to coordinate in the stochastic climbing and stochastic Boutilier's games.
Summary of the explored domains and results of coordination for each algorithm

WoLF PHC = win-or-learn fast policy hill climbing; FMQ = frequency maximum Q-value.
Symbol ‘✓’ means that the agents manage to coordinate, symbol ‘∼’ that we cannot conclude about the success of the coordination and no symbol that the agents fail to coordinate.
If we consider only the results of coordination, it seems difficult at first sight to analyze why some methods work with some benchmarks and do not work with othersFootnote 7. However, thanks to the study of coordination problems proposed in this paper and by comparing with the coordination issues raised by each environment, we can draw a parallel between successes and failures of algorithms and mis-coordination factors. Thus, Table 8 specifies problems that each algorithm is able to overcome. First, no algorithms solves all problems and especially, fully stochastic environments are still unresolved. Decentralized and hysteretic Q-learning overcome most of the coordination issues but a well-tuned GLIE strategy is required because they are not robust against alter-exploration. Distributed Q-learning is very useful as it is assured to converge in deterministic environment with an important capability: it allows simultaneously the learning of individual policies and exploration, that is, it is robust against exploration. WoLF PHC may have difficulties against shadowed equilibria. Lastly, recursive FMQ shows best results since it overcomes all problems in partially stochastic environment, but it is limited to matrix games.
Synthesis of coordination problems overcome by RL algorithms for independent learners in cooperative games

RL = reinforcement learning; GLIE = greedy in the limit with infinite exploration; WoLF PHC = win-or-learn fast policy hill climbing; FMQ = frequency maximum Q-value.
5.4 Discussion
Some important aspects that must be highlighted concerning these experiments and the results presented in Table 7 are the sensitivity of the algorithms to some parameters as learning rates or initial values. Indeed the potential exists for divergences given changed parameters. First, it is significant to notice that we decided to choose the same initial values for all of the experiments so as to conduct fair comparisons between algorithms. Indeed, the sensitivity of the algorithms to the initial values is a well-known aspect that has been widely studied in single-agent systems. For instance, the presence of bounds that mark out diverse behaviors at the beginning of the learning (systematic exploration, ‘moving round in circles’ or random behavior) has been studied in Matignon et al. (Reference Matignon, Laurent and Le Fort-Piat2006). Thus, by choosing the same initial values in all our experiments, the induced behavior is the same in all cases. However, it would be actually interesting to study the impact of the initial values in MAS.
The second aspect concerns the learning rate that is an important issue in multi-agent learning. In single agent learning, the choice of the learning rate depends on the stochasticity of the process. A small learning rate acts like a low-pass filter, whereas a learning rate equal to one can be used with deterministic processes. In multi-agent learning, the learning rate cannot be equal to one even if the game is deterministic due to the exploration actions of the teammates. Actually, in deterministic Markov games, the learning rate is linked to the number of agents and to the exploration rate of the agents. That is why we introduced the idea of global exploration noted ψ in Section 3.5. It should be noted that we always used a global exploration close to 0.1 in our experiments. According to our experience, a good choice for the learning rate is 0.1 for a global exploration of 0.1. As a result, all the domains use this value (except for one case using GLIE). We also opted for the same learning rate for all the experiments so as to obtain the same dynamic of the evaluation of the action-value function whatever the algorithm is. If an algorithm converges faster, it is due to its coordination mechanism and not to a fine tune of the learning rate. Once more, the objective is to conduct fair comparisons between algorithms.
Some works studied the impact of the learning rate in multi-agent learning. In Gomes and Kowalczyk (Reference Gomes and Kowalczyk2009) and Wunder et al. (Reference Wunder, Littman and Babes2010), the authors analyze a continuous-time version of decentralized Q-learning. These articles open an interesting perspective as regards the Q-learning convergence in multi-agent settings. It emerges that there may be two alternatives to achieve the Q-learning convergence in multi-agent settings. The first option could be to adjust the exploration strategy (by using GLIE), and the second one to play on learning rates. The first one is more efficient but GLIE parameters are difficult to choose (as mentioned in our article in Section 5.1.2); smaller learning rates are safer but create computational problems. For instance, our results concerning decentralized Q-learning might become more positive with a smaller learning rate but by generating computational problems. So, the challenge of choosing between each option is a matter of trade-off between insuring the optimality but at the cost of a very slow convergence, and efficiently converging at the risk of failing with a poor exploration strategy. This trade-off between time and optimality is all the more important in the multi-agent framework given the huge number of repetitions or trials required by each method so as to learn to coordinate. So it is interesting to know if the convergence can be obtained faster with some algorithms than with others.
6 Conclusion
This paper presented a comprehensive review of RL algorithms for independent agents in cooperative MAS. Five factors that complicate the learning have been identified: the Pareto-selection problem, the non-stationarity problem, the stochasticity problem, the alter-exploration problem and the shadowed equilibrium problem. The analysis of the strengths and weaknesses of each algorithm was carried out from their experimental performances in a variety of fully cooperative domains. Table 8 summarizes the problems that each algorithm is able to overcome. Given the sensitivity of the algorithms to some parameters as learning rates or initial values, we chose the same initial values for all of the experiments so as to conduct fair comparisons between algorithms and discussed this choice (cf. Section 5.4).
The very first conclusion is that no algorithm is efficient when all coordination problems are combined. Beyond this fact, we can propose some advices concerning the choice of the algorithm and some interesting directions for future works.
When the cooperative Markov game is deterministic, distributed Q-learning should be applied to find optimal policies. Indeed, this is the only algorithm that is proved to converge in this case with an important capability: it allows simultaneously the learning of individual policies and exploration,that is, it is robust against alter-exploration. When the game is stochastic, WoLF PHC and recursive FMQ distinguish themselves from other algorithms. Indeed, the other methods require the use of a well-tuned GLIE strategy to converge towards a Pareto-optimal equilibrium. It is important to notice that when the number of agents increases, the difficulty of coordination also increases and the alter-exploration problem outweighs. In this case, a GLIE strategy is too complicated to tune in practice. As a rule, the issues of the exploration strategy and the robustness against alter-exploration play a central role for ILs. In this paper, we illustrated how exploration strategies can affect convergence. Additionally, we highlighted that alter-exploration problem can cause instabilities in learned optimal policies.
The strength of WoLF PHC and of recursive FMQ is precisely that both methods are robust to alter-exploration. They are able to learn a stable and optimal policy despite the actions of exploration of the other agents. In addition, they overcome the Pareto-selection problem and work in partially stochastic games. Nevertheless, WoLF PHC can fail to find shadowed Pareto-optimal equilibria and then can converge to a non-shadowed sub-optimal equilibrium. This drawback may be removed by a small tweak in the algorithm. This is an interesting issue to work on. The recursive FMQ algorithm surmounts the shadowed-equilibrium problem but is only designed for matrix games. An extension of this algorithm to the multi-state case is another promising way to get a robust learning method for cooperative ILs in stochastic games.
To conclude the paper, it is important to stress the huge number of repetitions or trials required by each method so as to learn to coordinate, even in small matrix games. We should not underestimate the complexity of these games since these results suggest that the learning algorithms can be unsuitable to solve complex applications in realistic time spans. However, we have obtained satisfying results on the discrete smart surface with 270 agents and these results are added to some successful stories of using RL in a big MAS, as for instance recent results we have obtained on a real smart surface (Matignon et al., Reference Matignon, Laurent, Le Fort-Piat and Chapuis2010). They show that the size is not always a problem. In fact, the coordination difficulty depends on the interaction between agents. Indeed, in large MAS, when there is an interaction between agents, it concerns only a few individuals. Thus, in the discrete smart surface with 270 agents, at most 16 agents can simultaneously interact with the object (the agents under and by the object), so at most 16 agents are involved in the coordination. In the predators pursuit domains or in matrix games, the interaction is strong between all the agents. So matrix games and small Markov games must be seen as a tool to study complex interaction that occurs in larger MAS. Finally, the fact that no algorithms are able to learn to coordinate in the stochastic Climbing and stochastic Boutilier's games shows that there are many open questions to be addressed by this field of research.
Acknowledgment
This work is partially supported by the Smart Surface ANR (French National Research Agency) project (ANR_06_ROBO_0009_03).
Appendix A
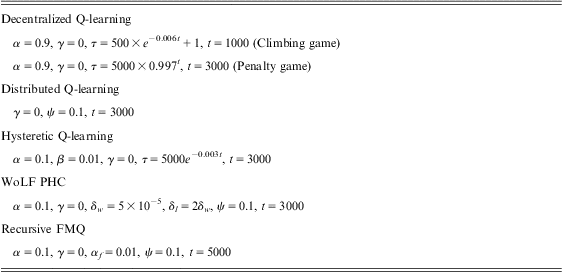
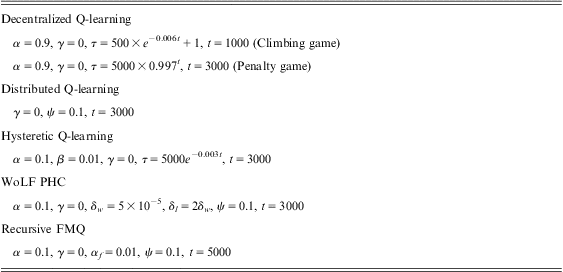
Table 9 where the learning and decay rates used for the results presented in Section 5.1.1. Here t is the number of repetitions of the game. With the detailed algorithmic descriptions in Section 4 and these parameters details, all of the presented results are reproducible.
Learning and decay rates used for the results presented in Section 5.1.1
WoLF PHC = win-or-learn fast policy hill climbing; FMQ = frequency maximum Q-value.
Appendix B
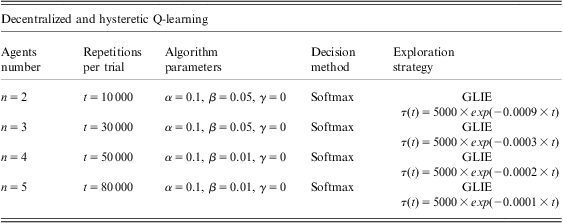
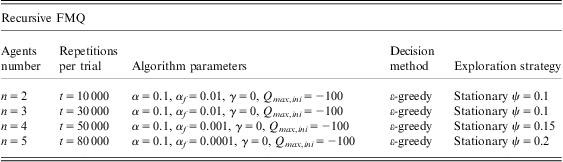
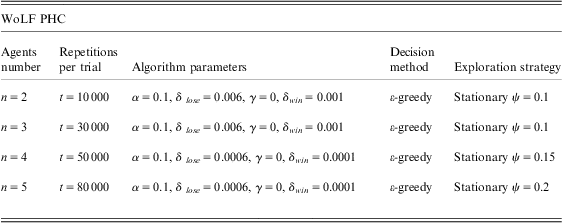
Tables 10, 11 and 12 were the learning and decay rates used for the results presented in Section 5.1.3. Here t is the number of repetitions of the game. With the detailed algorithmic descriptions in Section 4 and these parameters details, all of the presented results are reproducible.
Learning and decay rates used for the results presented in Section 5.1.3
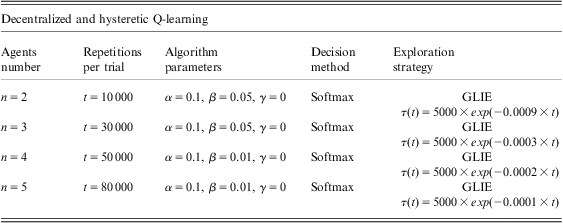
GLIE = greedy in the limit with infinite exploration.
Learning and decay rates used for the results presented in Section 5.1.3
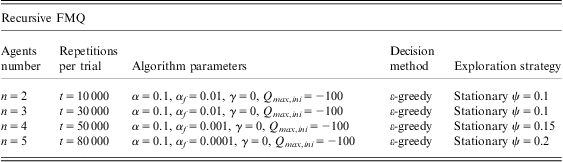
FMQ = frequency maximum Q-value.
Learning and decay rates used for the results presented in Section 5.1.3
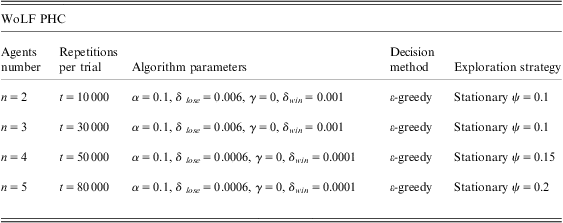
WoLF PHC = win-or-learn fast policy hill climbing.