Introduction
In recent years there has been substantial consolidation in US health care markets among health insurers and also among hospitals. According to a study by the American Medical Association (AMA), there were over 400 mergers involving health insurers and managed care organizations between 1995 and 2003 (AMA, 2005), whereas more than 1700 hospitals were involved in acquisitions between 1994 and 2000 (Cuellar and Gertler, Reference Cuellar and Gertler2003). On average, the pooled market share of a state’s largest three health insurers rose from 59% in 1997 to 76% in 2001 and 80% in 2003 (Chollet et al., Reference Chollet, Kirk and Chow2000 and AMA, 2003,2005). At the same time, many local hospital markets have come to be dominated by two to three large hospital systems.
There has been increasing concern in general (FTC/DOJ, 2004), but in particular by hospitals and physicians, about the growing concentration in health insurance markets and the potential for market domination by large insurers. The American Hospital Association (AHA) recently said:
Over the past several years, numerous health plans have merged, creating a highly concentrated health insurance industry. The AHA is concerned that additional health plan consolidation would cause competitive harm that would adversely impact hospitals, physicians, and patients. Among other harms, consolidation of insurers has the potential to create ‘must have’ payers for hospitals because they represent such a large share of a hospital’s business leaving the hospital with no alternative but to adopt the programs and initiatives of that insurer to the exclusion of others. (AHA, 2007)
There has also been substantial concern about the impact of hospital and physician consolidation on prices, quality and ultimately health insurance premiums and coverage (FTC/DOJ, 2004; Town et al., Reference Town, Wholey, Feldman and Burns2006; Vogt and Town, Reference Vogt and Town2006).
In response, federal and state anti-trust enforcers have challenged a number of mergers in health care. On the insurance side, the Department of Justice (DOJ) challenged Aetna’s acquisition of Prudential Healthcare in 1999, resulting in Aetna divesting some assets.Footnote 1 In a more recent challenge, the DOJ forced United Health Group to divest its Medicare Advantage plans in order to merge with Sierra Health Services.Footnote 2 The Federal Trade Commission (FTC) and the DOJ challenged seven hospital mergers between 1994 and 2000, although the anti-trust enforcers lost all seven cases (FTC and DOJ, 2004).Footnote 3
Anti-trust merger enforcement is concerned principally with the possibility that mergers will enhance market power. There is concern that merging insurers may gain the power to reduce hospital prices, or that merging hospitals may gain the power to demand higher prices. Research into these questions to date has been hampered by lack of good data on actual payments to hospitals and by a lack of appropriate measures of market structure in health insurance markets.
We study how buyer and seller concentration are related to the prices of hospital care using a national US dataset containing transaction prices for health care services for over 11 million privately insured Americans. We employ a structure-conduct-performance approach, regressing the transaction prices on Herfindahl-Hirschman indices (HHIs)Footnote 4 for the hospital and the insurance markets (and control variables). Our main findings are that increased concentration of insurers is associated with substantial decreases in hospital prices, whereas increased concentration of hospitals is insignificantly associated with increased prices, although these results are sensitive to the presence of data from two states (Georgia and Michigan) in the sample.
There is a substantial literature on the exercise of monopsony and monopoly power in health care markets.Footnote 5 Most previous studies analyze the exercise of market power on only one side of the market: either insurers’ monopsony power or hospitals’ monopoly power.
Early research on insurers’ exercise of monopsony power analyzes the relationship between the market share of Blue Cross/Blue Shield and the size of hospital/physician discounts from list prices. Feldman and Greenberg (Reference Feldman and Greenberg1981), Adamache and Sloan (Reference Adamache and Sloan1983), Frech (Reference Frech1988), and Foreman et al. (Reference Foreman, Wilson and Scheffler1996) all find positive relationships between Blue Cross/Blue Shield share and provider discounts, whereas Staten et al. (Reference Staten, Dunkelberg and Umbeck1987, Reference Staten, Dunkelberg and Umbeck1988) find no significant relationship between these variables. A more recent study by Feldman and Wholey (Reference Feldman and Wholey2001) finds a negative relationship between an Health Maintenance Organization (HMO) buying power and prices. Bamezai et al. (Reference Bamezai, Melnick, Mann and Zwanziger2003) analyze the California’s Medicaid Program’s exercise of monopsony power, and conclude that there is no significant relationship between its buying power and growth in reimbursement. Sorensen (Reference Sorensen2003) identifies the positive relationship between insurer sizes and discounts, and finds that an insurer’s ability to channel their patients to hospitals is a major determinant of discounts. In summary, most previous studies find a negative relationship between insurer market share and prices.
There are a large number of studies assessing hospital market power. These include Noether (Reference Noether1988), Melnick et al. (Reference Melnick, Zwanziger, Bamezai and Pattison1992), Dranove et al. (Reference Dranove, Shanley and White1993), Lynk (Reference Lynk1995), Connor et al. (Reference Connor, Feldman and Dowd1998), Simpson and Shin (Reference Simpson and Shin1998), Dranove and Ludwick (Reference Dranove and Ludwick1999), Keeler et al. (Reference Keeler, Melnick and Zwanziger1999), Lynk and Neumann (Reference Lynk and Neumann1999), and Melnick and Keeler (Reference Melnick and Keeler2007). These studies regress prices on HHI (and other control variables). The vast majority of these studies find that concentration increases hospital prices. Dor et al. (Reference Dor, Grossman and Koroukian2004a, Reference Dor, Koroukian and Grossman2004b) analyze the effect of managed care on discounts using MarketScan® database (Thomson Reuters (Healthcare) Inc.), the same database as ours, and also find a positive relationship between hospital concentration and prices.
There is another strain of literature, which models the bargaining between insurers and hospitals. Brooks et al. (Reference Brooks, Dor and Wong1997) consider a potential gain from bargaining divided by insurers and hospitals, and identifies the exercise of bargaining power by both sides. Town and Vistnes (Reference Town and Vistnes2001) model a situation in which hospitals compete for inclusion in the networks of HMO, and find that as the value a hospital adds to a network increases, the hospital’s bargaining power and prices increase. Capps et al. (Reference Capps, Dranove and Satterthwaite2003) model a similar situation and measure each hospital’s market power by an aggregation of consumers’ willingnesses to pay to go to the hospital. They also find that the prices become higher as hospital bargaining power increases.
This study contributes to the literature as follows. First, we analyze the bilateral exercise of market power by both insurers and hospitals, whereas most of the previous literature analyzes the exercise of market power on only one side of the market. Only Staten et al. (Reference Staten, Dunkelberg and Umbeck1987, Reference Staten, Dunkelberg and Umbeck1988), Sorensen (Reference Sorensen2003), and Melnick et al. (Reference Melnick, Zwanziger, Bamezai and Pattison1992) analyze the bilateral exercise of market power. However, the first three studies focus on the concentration of insurers and the last one focuses on that of hospitals, and the measurement of the concentration of the other side is not very precise.Footnote 6 In our study, we analyze how both hospitals’ and insurers’ concentrations, measured by HHIs, are related to prices.
Second, we use actual transaction prices in our analysis. Information on hospital charges is readily available. However, charges are ‘list prices’. Actual transaction prices are determined by bargaining between hospitals and insurers, and have not generally been available in the past. Thus, prior studies use alternative measures. Most studies use a measure of average payment per some unit of quantity. These measures suffer from three problems. First, they do not necessarily capture discounts from charges obtained by insurers. Second, since they are averages, they necessarily obscure differences in pricing across services or patients. Last, quantity is difficult to measure in health care. Some measures are per day, some per admission and some per patient or enrollee. In all these cases the denominator measures only some aspect of quantity. As a consequence, prices are potentially measured with considerable error.
Third, our measure of buyer concentration is more conceptually appropriate than those used in previous studies. An insurer’s share of a hospital’s inpatient days or insurer’s share of hospital’s revenue has been used extensively as a measure of buyer concentration. However, buyer concentration ought to measure how concentrated sales are among buyers. Thus, it should be measured by a buyer’s market share in the entire market, not by the share of a particular buyer for a particular seller (Gaynor and Vogt, Reference Gaynor and Vogt2000).
In our study, we use the HHI calculated from the share of enrollment among insurers. Conceptually, share of enrollment measures an insurer’s power as a seller of insurance, and share of services purchased by insurer would be a more appropriate measure of monopsony power. However, it is likely that an insurer with monopsony power in a hospital market also possesses monopoly power in the health insurance market, since the geographic markets for both products overlap.Footnote 7 Thus, the share of enrollment serves as a good proxy for monopsony power of insurers.
Fourth, in contrast to most previous work, which is based on cross-sectional models, we use a panel dataset and a fixed effects model. The panel nature of our dataset allows us to control for time-constant unobserved market characteristics that affect cost and demand of hospital services.
Finally, we contribute to the existing literature by extending the geographical area covered in the analysis. Most previous studies focus on markets in California, mainly due to the availability of detailed hospital data in California and the early development of managed care in that state. This study uses the MarketScan® Database, a national US dataset obtained from various employers, health plans and government organizations for 11 million enrollees.
Empirical model
Empirical approach
Economic theory predicts that a monopolist facing competitive buyers charges a price higher than the competitive level and that a monopsonist facing competitive sellers sets a price below the competitive level. However, theory is indeterminate about prices under bilateral oligopoly, where a market is characterised by a small number of buyers and a small number of sellers.
We employ a traditional empirical approach in industrial organization research: the structure-conduct-performance (SCP) approach. The basic idea of this approach is that market structure determines the conduct of firms and conduct then yields market performance. In practice, most studies focus on the structure-conduct link, we follow that tradition. We use the HHI of insurers and HHI of hospitals as proxies for market structure. The pricing equation is:

where XD represents demand shifters (e.g. insurance and income), and Z represents cost shifters (e.g. wages and patient illness severity).
A criticism of the SCP approach is that the use of the HHIs in a pricing equation can only be directly derived from a theoretical model with Cournot competitors. That model clearly does not apply here. Hospital services are a differentiated product, and even more importantly, we are considering bilateral oligopoly. As stated previously, there is no theoretical consensus on bilateral oligopoly, hence no definitive empirical predictions. As a consequence, our analysis is best thought of as an empirical exploration of the idea that more concentrated markets has less price competition that is reflected in prices (higher for more concentrated sellers and lower for more concentrated buyers).
Market definition
To measure market concentration, we first must define the relevant markets. The product market in this analysis is all inpatient hospital services, as typically assumed in anti-trust analyses and in most previous studies. Instead of focusing on a particular service or disease, we include all inpatient admissions in our analysis, since it is likely that insurers and hospitals negotiate over a bundle of hospital services ex ante.
In a national study such as ours, it is not feasible to perform a detailed geographic market definition for each insurance and hospital market; therefore, we seek useful proxies for the geographical market definition. We use US state as a geographic market for insurance for logical and pragmatic reasons. Entry and operations by insurers are regulated at the state level. Most of the regulatory fixed costs of entry are associated with entering a state, as opposed to particular parts of a state. Once an insurer obtains approval from a state, it can easily enter any local market within the state.
On the other hand, since managed care ties insurance to a particular set of providers and the geography of providers’ matters a great deal to consumers, the geographic market for health insurance may not be as broad as a state. As a pragmatic matter, however, we only have significant data available on insurance market concentration at the state level. The only available HHI at the local level is HHI at Metropolitan Statistical Area (MSA) level in the AMA study. However, we did not use it because, first, insurer HHI at the MSA level is available for only 70 MSAs in 2001. Thus, we would lose a substantial portion of our observations by using the HHI at the MSA level. Second, the enrollment information at the state level is much more reliable than at the MSA level. Insurers are required to report the number of HMO enrollees in the state by regulation. It is often the case that the number of enrollees at the MSA level is imputed from the number of enrollees in the state.
For hospitals, we use Health Service Areas (HSAs) as the geographic market.Footnote 8 HSAs are groups of US counties constructed to minimize the flow of Medicare hospital patients between HSAs (Makuc et al., Reference Makuc, Haglund, Ingram and Kleinman1991). Although flow-based market definitions are not ideal, a case-by-case market definitionFootnote 9 is not possible in a national study such as this one. There are approximately 800 HSAs defined all over the continental US and the median number of counties per HSA is three. As both the hospital and insurance market are likely measured with errors, the HHI will likewise likely be measured with errors. One might reasonably expect, therefore, that the concentration effects we identify are underestimates of the true effects.
Model
In order consistently to estimate the relationship between market concentration and prices, it is important to deal with unobserved market characteristics that affect the prices of hospital services. There are market-specific demand shifters and cost shifters, which cannot be observed by researchers. These factors affect both the profitability of hospitals and insurers directly, and have indirect effects on the entry and exit decision of these entities. Thus, it is reasonable to assume that unobserved market characteristics are correlated with the HHI of insurers and that of hospitals. Having panel data allows us to estimate a fixed effects model and identify the coefficient of interest in the presence of unobserved market characteristics that could be correlated with the HHIs, assuming that the unobserved factors do not change over time. In particular, we employ market level fixed effects to control for these factors. The resulting estimator differences away these factors, and thereby controls for endogeneity so long as the unobserved market specific factors do not vary (too much) over time. Separately, since the distribution of prices is highly right-skewed, we use its logarithmic form.
We estimate the following price equation:

where the indexes are time, state, HSA, and individual. The covariates, Wtsh and Xtshi, are control variables at the HSA and individual levels, and the error terms are: ηsh, market effect, μt, time effect and εtshi, the random error.
Conventional regression standard errors are inconsistent if the assumption of independent and identically distributed regression errors is violated. There is a strong likelihood that this assumption is violated in our setting. If there is a common random effect at the state level such as an economic shock, it would induce correlation among observations from the same state and year. If this market-specific random effect persists for more than a year or the magnitude of the effect changes over time, there would be serial correlation among the regression errors. We are concerned about these unobserved state-level effects, which are not fully captured by our fixed effects, especially because the state-level insurer HHI appears as an independent variable in our individual-level regressions.
There are two methods to deal with this problem. The first method, cluster-corrected robust standard errors at the state level, corrects for correlations between observations within a state. The second method, the block-bootstrapped confidence interval, is constructed by drawing a bootstrap sample of states in each replication. Each of these methods is known to perform well when the number of states is sufficiently large (Bertrand et al., Reference Bertrand, Duflo and Mullainathan2004). We use block-bootstrapped confidence intervals to evaluate significance of our coefficients in this study, since it employs weaker assumptions than cluster-corrected robust standard errors. Specifically, we use the Bias-corrected accelerated percentile (BCa) confidence interval, which is better than other block-bootstrapped confidence intervals because it gives dependably accurate coverage probabilities in all situations (Efron and Tibshirani, Reference Efron and Tibshirani1993).
Data and measures
Data
We use several data sources, all matched geographically at the HSA or state level, all covering the years 2001–2003.
Data on hospital prices for inpatient admissions and on patient characteristics come from the MarketScan® database. MarketScan® is the largest multi-source private sector healthcare database in the US, MarketScan® collects person-specific data for 11 million privately insured employees and their dependents from about 100 large employers, health plans and government organizations, and links claims and encounter data with detailed individual information. This is a convenience sample, so it may not generalize to the US insured population. In particular, the data come only from large employers.
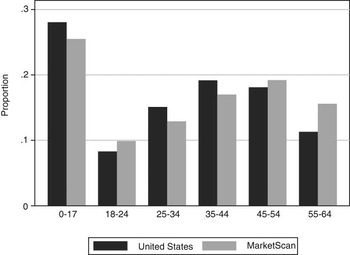
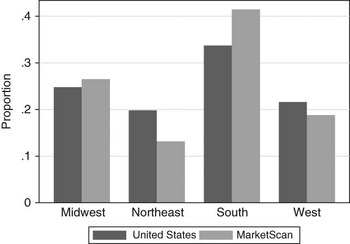
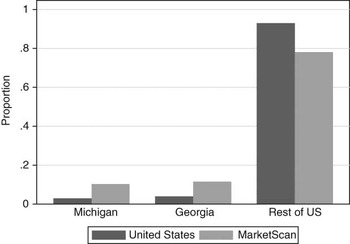
As MarketScan® is not a random sample, we compared demographic variables for people in the MarketScan® database with the employer-insured US population. Benchmarking information for the employer-insured US population was derived from the US Census Bureau’s Current Population Survey (CPS) Annual Demographic Supplement. CPS contains a large number of demographic, economic and health-related measures from a large-scale, nationally representative probability sample of the US civilian, non-institutional population.Footnote 10Figure 1 shows our age-comparison results, which suggest that the age distribution in the MarketScan® sample (excluding those older than 65 years) represents the employer-insured US population well except for slightly overrepresenting the 55–64 years age group (by 4.3%). Figure 2 shows the results for geographic location. The MarketScan® sample is less representative in terms of regional distribution. The South is overrepresented and the Northeast is underrepresented. Figure 3 extends the examination of geographic representation to Georgia and Michigan, two states that are influential in our empirical analysis. Georgia and Michigan are overrepresented in MarketScan® relative to the rest of the US.
Age representativeness of MarketScan data

Geographic representativeness of MarketScan data

Georgia and Michigan vs rest of US

Hospital characteristics are obtained from the AHA Annual Survey Database. It is a survey of all hospitals in the US and it contains information on organizational structure and teaching status.
The HHIs for hospital markets are calculated using the data from AHA database, and the HHIs for insurance markets are taken from studies by the AMA (2003, 2004 and 2005). AMA obtains enrollment information of HMOs and Preferred Provider Organizations (PPOs) from InterStudy and uses it to calculate insurer HHI at state level.
An observation is an inpatient admission, and the study data consists of 940,816 inpatient admissions in the US continental states except Mississippi from 2001 to 2003. We exclude Mississippi because we do not observe insurance market concentration measures there. We exclude inpatient admissions with incomplete information on patient characteristics, with zero, negative or outlier payment amounts,Footnote 11 with Diagnosis Related Groups (DRGs) whose frequencies are less than 100, or with a discharge status of death.
Variables
We use hospital payments in the MarketScan® dataset to construct our dependent variable. Hospital payments are defined as total payments to the hospital for an admission in the database. These are actual payments, not charges. This is important since actual payments diverge widely from charges due to insurer-negotiated discounting, and this discounting may vary with market power.
The HHI of hospitals is calculated based on the data contained in the AHA dataset. In calculating the HHI, jointly owned hospitals must be treated as one entity, because it is typically systems and not individual hospitals in those systems that negotiate with insurers over prices. We calculate the HSA-level hospital HHI using information from a hospital system database constructed in previous studies (Kessler and McClellan, Reference Kessler and McClellan2000; Chakravarty et al., Reference Chakravarty, Gaynor, Klepper and Vogt2006). We use the number of staffed hospital beds to calculate the share of each system.
The state-level HHI of insurers is derived from studies by the AMA (2003, 2004 and 2005). These studies base their calculation of insurer HHI on enrollment and market share information contained in reports by InterStudy, AIS and Health Leaders. We recalculated their HHI by considering all Blue Cross and Blue Shield subsidiary companies within a state as a single entity, since these firms avoid competing with one another.
Our control variables include each patient’s age, insurance type and DRG. In the MarketScan® dataset, insurance type is classified as: Comprehensive (traditional fee-for-service), PPO, Point of Service (POS), POS with capitation, Exclusive Provider Organization (EPO), or HMO. We use DRG codes to control for differences in resource use among different diagnoses. To make our bootstrapping strategy computationally feasible, we collapse the 435 unique DRG codes in the data into 20 categories, dividing the categories into least to most costly. We included a dummy variable for each of these categories in our regressions.
Additional control variables include hospital characteristics such as ownership status (not-for-profit, for-profit and public) and teaching status of hospitals. We define a teaching hospital as a member of Council of Teaching Hospitals and Health Systems of the Association of American Medical Colleges (COTH). As it is not generally possible to identify the specific hospital to which each patient is admitted in the MarketScan® dataset, we include the proportion of beds of each type of community hospitals in the HSA as a proxy.
Other cost and demand shifters such as wages, rent, ratio of aged population and income are not included in the analysis, because they are essentially time-invariant and thus captured in the market effects in the fixed effects model.
Results
Descriptive statistics and representativeness
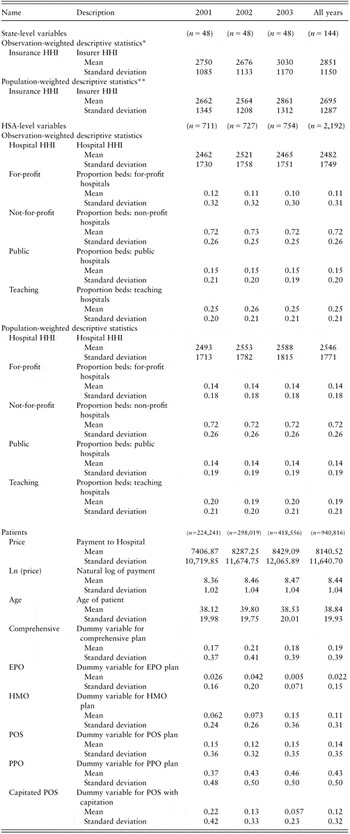
Table 1 presents descriptive statistics for the variables used in the model. Observation-weighted means of HHIs tell us the concentration in the market of the average patient in our sample, whereas corresponding population-weighted means tell us the concentration in the average US resident’s market. Insurer and hospital concentration levels in our sample are similar to concentration levels in the US as a whole. The same is true for other market characteristics, with the exception of the market share of teaching hospitals, which is 5% higher for patients in our sample than for US residents on average.
Descriptive statistics: insurers, hospitals and patients

HHI = Herfindahl-Hirschman index; EPO = Exclusive Provider Organization; HMO = Health Maintenance Organization; POS = Point of Service; PPO = Preferred Provider Organization.
*Observation-weighted descriptive statistics are obtained using the number of observations in each state (or HSA) in our dataset as weight.
**Population-weighted descriptive statistics are obtained using Census population in each state (or HSA) as weight.
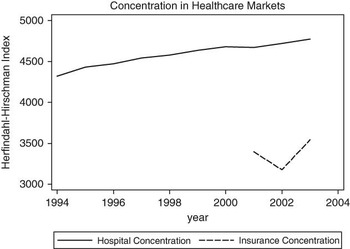
The average (unweighted over states) HHI for insurers at the state level was 3394 in 2001 and increased to 3541 in 2003, and the average (unweighted over HSAs) hospital HHI was 4322 in 1994 and increased to 4670 in 2001 and then to 4774 in 2003 as shown in Figure 4. The enforcement agencies consider any merger-induced increase in the HHI of 100 points or more in markets with HHIs above 1800 as presumptively anti-competitive, and the increases in concentration in the hospital and health insurance markets both exceed this threshold on average over the 2001–2003 period (FTC/DOJ, 1992). In both absolute and percentage terms, the increase in concentration is larger for insurers than it is for hospitals over the period of our study.
Concentration in healthcare markets

Main results
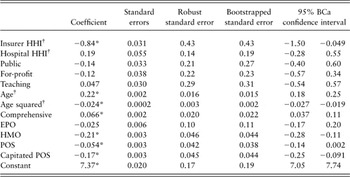
Table 2 reports our principal results: the coefficients from our fixed-effects regression of hospital payment on hospital and insurer concentration and other independent variables. Insurer concentration is negatively related to prices, whereas hospital concentration is positively associated with prices. The coefficient for insurer HHI is estimated to be −0.84 and that for hospital HHI is estimated to be 0.19. Thus, based on this model, an increase of 1000 in the HHI of insurers would reduce per-case prices by 8.4%, and an increase of 1000 in the HHI of hospitals would increase prices by 1.9%. The effect of insurer HHI is significant at the 5% level, whereas the estimated effect of hospital HHI is not significant at conventional levels. The estimates of other coefficients are approximately as expected.
Fixed effects model estimation results (n = 940,816)
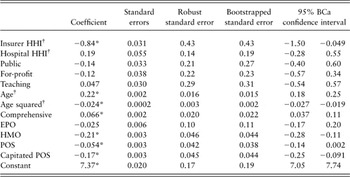
BCa = Bias-corrected accelerated percentile; HHI = Herfindahl-Hirschman index; EPO = Exclusive Provider Organization; HMO = Health Maintenance Organization; POS = Point of Service.
The dependent variable is hospital payments. R 2 and adjusted R 2 are 0.46. F-value is 21,981.4.
The omitted category of insurance type is PPO and that of hospital ownership is not-for-profit hospital. Covariates that are not shown are: dummy variables for Diagnosis Related Groups, HSAs and years.
†The HHI variables are divided by 10,000, the age variable by 10 and the age squared variable by 100 to enhance the readability of the table.
*Significant at 5% level based on our block-bootstrapped BCa confidence interval. All bootstrap estimates result from resampling 200 times, and the sample drawn each replication is a bootstrap sample of states.
Robustness
Geographic non-representativeness
One threat to the robustness of our results is that the geographic coverage of the MarketScan® database is skewed. Among our observations of inpatient admissions between the year 2001–2003, 14.2% are from Georgia and 12.7% are from Michigan. Detailed examination reveals that the identified relationship between insurer concentration and prices is affected by the inclusion of Georgia and Michigan.
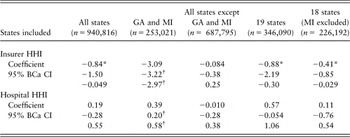
The second column of Table 3 presents results from fixed-effects regression using data from only Georgia and Michigan. The magnitudes of the effects of both insurer and hospital concentration on prices are estimated to be two to three times larger than the ones reported in Table 2. The coefficient of insurer HHI is estimated as −3.09 and that of hospital HHI is estimated as 0.39. On the other hand, the relationship between market concentration and prices is almost negligible in a regression, which excludes Georgia and Michigan (see the third column of Table 3). The point estimates of the effect of both the insurer and hospital HHI are an order of magnitude smaller with Georgia and Michigan excluded (−0.084 for the insurer HHI and 0.010 for the hospital HHI), and are not statistically significant.
Sensitivity analysis to show the effect of using different subsets of states on the main results

GA = Georgia; MI = Michigan; HHI = Herfindahl-Hirschman index; BCa = Bias-corrected accelerated percentile; CI = confidence interval.
*Significant at 5% level based on our block-bootstrapped BCa confidence interval. All bootstrap estimates result from resampling 200 times using a block bootstrap at the state level.
†These confidence intervals are calculated using conventional linear regression standard errors. As there are only two states in this analysis, bootstrapped standard errors and state-cluster-corrected standard errors are extremely wide, and neither coefficient is significant at conventional levels.
The 19 states in the fourth regression are Arizona, Delaware, Illinois, Indiana, Louisiana, Michigan, Nebraska, North Dakota, Ohio, Oklahoma, Oregon, Virginia, Wisconsin (the states in which HHI increased monotonically), Maine, Massachusetts, Montana, Rhode Island, South Carolina and Utah (the states in which HHI decreased monotonically).
Potential mismeasurement of Insurer HHI
One of the reasons that the effect of insurer concentration has not been studied recently is the scarcity of data on insurer concentration. Attempts to collect data on PPO enrollment were only started as recently as the year 2000 by Interstudy, and it is possible that the coverage of insurers was not thorough during our study period.
As our main results are influenced by Georgia and Michigan, we investigated the accuracy of market share information in these two states. By examining the AMA reports in detail and by examining contemporaneous press accounts, we were able to determine that the market share of Cigna’s PPO in Georgia was understated in 2001 by an unknown amount. On the other hand, market share information in Michigan in the AMA study seems consistent with that in other available sources, and the monotonic increase in the HHI in Michigan over three years is mainly explained by the monotonic increase in the share of Blue Cross Blue Shield of Michigan.
To reduce the effects from measurement errors in the insurer HHIs, we select all of the 19 states in which the insurer HHIs increase or decrease monotonically over the study period and run a regression using observations from these states (see the fourth column of Table 3). In that sample, the relationship between insurer concentration and prices is negative and statistically significant at the 5% level and that between hospital concentration and prices is positive and significant at the 10% level. The magnitude of the relationship between insurer concentration and prices in this regression is almost the same as the one in the main regression.
To further check the robustness of this result, we run a regression excluding Michigan from these 19 states (Georgia is excluded by the monotonicity requirement). The results are reported in the fifth column of Table 3. Although the relationship between hospital concentration and prices is not statistically significant any longer, that between insurer concentration and prices remains significant at the 5% level. Note, however, that excluding Michigan reduces the estimated impact of the insurer HHI on hospital prices by approximately 50%.
Merger effects
The point estimates from our model may be used to estimate the effects of hypothetical mergers. As our results are sensitive to the inclusion of Georgia and Michigan, we calculate these effects using three different point estimates: those using all observations (Table 3, Column 1), those excluding Georgia and Michigan entirely (Table 3, Column 3), and those which only use states where the insurer HHIs increase or decrease monotonically and which excludes Michigan (Table 3, Column 5). We first consider a ‘standard merger’: a merger of two firms out of five that start with equal market shares: that is, a ‘five to four’ merger (Gaynor and Vogt, Reference Gaynor and Vogt2000). This merger would cause a change in the HHI from 2000 to 2800. The results using the entire sample indicate that a standard merger in the insurance market would decrease hospital prices by approximately 6.7%, whereas a standard merger in the hospital market would increase hospital prices by 1.5%. If we exclude Georgia and Michigan, the effect of an insurer standard merger would decrease hospital prices by 0.67%, and a hospital standard merger would increase prices by 0.08%. If we only look at states with monotonic changes in the insurer HHI and exclude Michigan, then the estimated effect of an insurer standard merger is to decrease hospital prices by 3.3%. A standard hospital merger increases hospital prices by approximately 0.9%.
The estimated effects of standard mergers of hospitals on prices in previous studies range from –3% to 17%, and these effects are found to be lower among non-California studies than among California studies (Gaynor and Vogt, Reference Gaynor and Vogt2000). The 95% confidence interval for the price change caused by a standard hospital merger in this study using the entire sample is estimated to be (−2.2% and 4.4%), and the estimated price changes in five out of the previous 10 studies of hospital market concentration lie inside this confidence interval. There are no comparable estimates in the insurance concentration literature.
We also consider a ‘typically challenged merger’: the merger of two firms out of three that start with equal market shares, since anti-trust enforcers have often challenged a merger reducing the number of firms in a market from three to two. This merger causes a change in the HHI from 3333 to 5556 in the market. We estimate that a typically challenged merger in the insurance market would cause an 18.7% decrease in hospital inpatient prices and the same change in the hospital market would cause a 4.2% increase in hospital inpatient prices. The effects are diminished if we exclude Georgia and Michigan: an insurer merger reduces hospital prices by 1.9%, and a hospital merger reduces hospital prices by 0.22%. If we only use the states with monotonically changing insurer HHIs and exclude Michigan, we get impacts between the previous two sets of estimates. An insurer merger decreases hospital prices by 9.1%, and a hospital merger increases prices by 2.5%.
Probably, the most conservative set of estimates are those that only use states where the insurer HHI changed monotonically and exclude Georgia and Michigan (Table 3, Column 5). Using those estimates, we find substantial effects of insurer mergers on hospital prices, whereas the effects of hospital mergers are much more modest.
Conclusions
Concentration in the insurance and hospital markets has increased in recent decades, and any resulting increase in market power is an important policy topic in health care and anti-trust. Provider groups have repeatedly raised concerns over increasing insurer power over hospital prices.
We use data on actual adjusted per-case payments for hospital services at the inpatient stay level to analyze the relationship between insurer and hospital concentration and prices. Our results indicate that increased insurer market concentration is significantly associated with lower inpatient hospital prices per case and increased hospital market concentration is non-significantly associated with higher hospital prices.
These results need to be interpreted with some caution. First, the fact that insurer concentration is associated with lower hospital payments does not necessarily mean that the concentration of insurers is desirable to consumers. When insurers merge and obtain more market power, they may exercise market power by raising premiums (Wholey et al., Reference Wholey, Feldman and Christianson1995) or reducing quality to their customers (i.e. employers and individuals). Our research does not allow us to address this question. Neither is this evidence sufficient to conclude that insurers possess monopsony power in concentrated insurance markets.
Second, this study analyzes the relationship between market concentration and prices. However, in order to evaluate the overall effects of market concentration in the health services market, it is necessary to consider not only its effects on prices but also its effects on other aspects such as quality of care, the amount of consumer choice, biomedical innovation and provision of charity care to the poor.
Third, our sample of inpatient stays is not representative of the US insured population, although it is roughly representative in terms of the main variables of interest: insurance and hospital market concentration.
Fourth, our hospital payment data do not have information on Coordination of Benefits (COB). This lack would only be problematic if COB changed systematically with insurance or hospital concentration, and we have no reason to believe that this is the case.
Nonetheless, this study is the first simultaneously to analyze the effects of both insurer and hospital concentration on hospital prices. It is also the first study to examine these questions using recent, high-quality, longitudinal hospital payment data. We find that increased insurance market concentration is significantly associated with lower hospital prices. Further research is necessary to identify the precise mechanism behind and implications of this relationship. Our results also suggest some additional questions for future research.Footnote 12 Do the lower hospital payments that insurers make in more concentrated insurance markets result in lower premiums to the insured or higher profits for insurers? There is some recent evidence, which suggests that insurers may not pass on savings to consumers. Dafny et al. (Reference Dafny, Duggan and Ramanarayanan2009) show that health insurance premiums are higher in more concentrated insurance markets, but a direct link between lower provider payments and higher premiums has not been investigated. Another question is whether providers are willing to accept lower payments from some insurers because they can cost-shift onto others? The answer to this question awaits future research, which can identify specific insurers and their payments to specific providers.
Acknowledgements
This project received support in the form of data access (AHA Annual Survey Database and MarketScan® Database) from the National Bureau of Economic Research. The authors thank two anonymous referees and the editors for comments that led to substantial improvements in the study. The responsibility for the views expressed in this study, and any possible errors, are those of the authors alone.