I
The shocks that New Zealand has recently faced in an environment of increasing globalisation of the world economy – integration in both goods and finance – have resonance with the first era of globalisation in the years 1880–1913. Globalisation has been associated with an increased incidence of financial crises including banking crises, currency crises, debt crises and sudden stops.Footnote 2 Also along with globalisation, business cycles have become increasingly synchronised across countries. They have become connected by common global shocks which are often financial in nature. In such an environment, a small open economy can be hit hard by financial crises leading to recessions. It can also be hit by real shocks that reduce its terms of trade and the volume of its exports. What factors can prevent global shocks from being so damaging?
In this article, we look at the crisis history of the New Zealand economy, and consider how international cross-country evidence on the determinants of crises fits that history. This allows us to identify factors that appeared to increase New Zealand's susceptibility to certain sorts of crisis at certain periods, and we are able to use these results to make statements about how New Zealand's level of risk may have changed over recent years. We also explore how much of an impact domestic crises have on growth after controlling for international factors.
In Section II, we briefly review some of the extant cross-country literature on the incidence and determinants of various types of financial crises including banking, currency, debt crises and sudden stops. Based on this research, we can isolate variables that can attenuate the impact of shocks. These include macro fundamentals like current account balance, low fiscal deficits, low money growth, low inflation, low debt to GDP ratios, and openness. They also include institutional variables like pegging to the gold standard before 1914, having an independent central bank that acts as a lender of last resort, having a parliamentary government and, especially, having low ‘original sin’ (foreign-currency-denominated debt), and low currency mismatches.
In Section III, we look at the crisis history of New Zealand and consider how it fared within the historical context of global financial crises. The New Zealand economy has been subject to frequent currency crises (from the 1930s until 1984) and sudden stops, where unwillingness to invest in New Zealand forces the current account to rapidly reverse. It also had two relatively small banking crises. However, overall the international comparison suggests that New Zealand did quite well in avoiding serious financial stress (particularly serious banking crises), as did several other countries like Canada and the Scandinavian countries which had sound institutions and policies.
In Section IV, we estimate the cross-country models of currency crisis and sudden stops reviewed in Section II using an augmented dataset which includes New Zealand. In the existing literature, New Zealand is often not included in the estimation samples because of missing values in key variables. Based on the results from the estimation, we highlight factors which were important in mitigating or exacerbating crisis risk in the country. We find that in the first era of globalisation (1880–1913) New Zealand was less exposed to currency crises than the average country through having a larger trade surplus and more favourable terms of trade shocks, but was more exposed to sudden stops because of its high ‘original sin’ (in fact, New Zealand did not have a local currency to borrow in until the 1930s). In the second era of globalisation (after 1972), New Zealand was more exposed to currency crises than the average country despite its higher per capita income (which by itself tends to predict a lower risk of a crisis) because of its weak fundamentals. Improvements in these fundamentals since the mid 1990s appear to have reduced the risk of currency crises in New Zealand today from a decade ago.
In Section V, we explore the impact on New Zealand growth of the financial crises as well as global variables such as major country growth or the terms of trade. We find that global variables are effective in explaining smoothed paths for New Zealand growth, with the specification surprisingly robust over the roughly 120-year period. Once the impact of key global variables is taken into account, the financial crises in New Zealand appear to have little additional explanatory power for the country's medium-term growth paths. This may suggest that financial crises in New Zealand have mainly been an endogenous response to stress brought on by exogenous global forces rather than a significant independent source of variation in the New Zealand growth rate.
II
Bordo et al. (Reference Bordo, Eichengreen, Klingebiel and Soledad Martinez-Peria2001) identified currency crises, banking crises and twin crises for a panel of 21 countries (both advanced and emerging) from 1880 to 1997 and also for a larger panel of 56 countries from 1973 to 1997. Currency crises, defined as a market-based attack on the exchange value of a currency, were identified using an ‘exchange market pressure indicator’ defined as a weighted average of changes in exchange rates, reserves and short-term interest rates, and alternatively, a survey of expert opinion. Banking crises defined as bank runs, significant bank failures, suspensions of convertibility and fiscal resolutions were based on World Bank dates for post 1971 and on historical narratives for earlier periods. Twin crises were defined as banking and currency crises in the same or consecutive years.
Other papers in the crisis literature have also looked at sovereign debt crises, and sudden stops. Because New Zealand has not experienced a sovereign debt crisis, we do not discuss that literature in this article. A sudden stop is defined as an abrupt reduction in net capital inflows (or a relevant proxy), with some definitions also requiring that the reduction in capital inflow must be coincident with or precede a decline in real GDP. Sudden stops are fairly common in New Zealand economic history (see Section III).
Bordo et al. (Reference Bordo, Eichengreen, Klingebiel and Soledad Martinez-Peria2001) and subsequent papers have developed stylised facts on crisis incidence, including the following:
• Crises are reasonably frequent and appear to have gradually become more frequent in recent years, with crisis incidence in the Bordo et al. (Reference Bordo, Eichengreen, Klingebiel and Soledad Martinez-Peria2001) dataset averaging around 12 per cent of country years in the dataset since 1973.
• Typically crisis incidence is higher in emerging economies, with the period between the two world wars one exception.
• Crises are correlated with substantial periods of below-trend economic growth that cumulate into significant implied output loss.
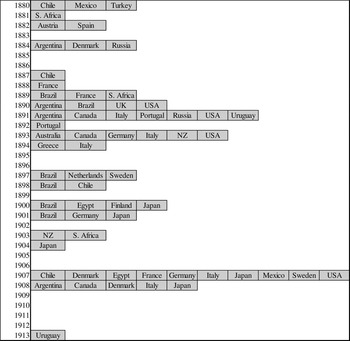
There is considerable historical evidence of contagion (or at least bunching across countries) of financial crises. This may reflect common fundamentals such as similar current account imbalances or similar balance-sheet problems in the banking system. It also may reflect transmission of shocks between countries via the current and capital accounts. For example, Figure 1 shows the countries affected by crises in the same year from the first openness period and the sample of countries in Bordo and Meissner (Reference Bordo, Meissner, Edwards, Esquivel and Marquez2006a).Footnote 3 While there is typically at least one country in crisis, there are two key clusters (1890–3, 1907) where large parts of the country sample are in crisis.
Crisis dates in the first globalisation period

Bordo and Meissner (Reference Bordo and Meissner2009) outline theoretical reasons to expect foreign capital flows to increase susceptibility to financial crises and consider institutional variables that may alter that susceptibility. Where a period of buoyant capital inflows has coincided with a period of excessive optimism and sparked rising asset prices and leverage, economies become vulnerable to shifts in the willingness of creditors to roll over loans and supply further capital. It is harder for an asset price cycle to develop if capital inflows are not able to play a part (since the banking system's ability to expand its balance sheet to accommodate rising asset prices will be constrained). When capital inflows become less forthcoming, policy options for the country depend on factors like whether there is a lender of last resort; deep and liquid financial markets exist; the quality of private lending has been high; international borrowing has been in local currency; and the fiscal position is sound. These factors help generate credibility and confidence and provide room for the government and central bank to provide liquidity support to the financial system. If they are not present, the risk that a desire to withdraw capital becomes disorderly (leading to a sudden stop and potential currency and banking crises) is more significant.
The denomination of fiscal and private-sector debt is often an important factor in increasing susceptibility to financial crises. The denomination of fiscal and private-sector debt in foreign currency (called ‘original sin’ by Eichengreen and Hausmann Reference Eichengreen and Hausmann1999) makes exchange rate depreciation expand the scale of debt relative to the domestic economy. Substantial foreign exchange reserves can mitigate this risk to a degree, but it has been a relevant part of a number of currency and financial crises (such as the 1990s Asian crises) and appears likely to afflict some countries today. A more robust solution is to borrow (directly or effectively after hedging contracts) in local currency, so that debt does not expand automatically as the currency falls. However, there are relatively few countries that are able to do this to a significant degree even today.
A number of studies have analysed crisis determinants using the Bordo et al. (Reference Bordo, Eichengreen, Klingebiel and Soledad Martinez-Peria2001) dataset, which includes crisis incidence and a wide range of macroeconomic and institutional variables for over 40 countries between 1880 and 1997.Footnote 4 The period is divided into four subperiods: the gold standard era (1880–1913), the interwar period (1919–39), the Bretton Woods era (1945–71) and the post-Bretton Woods era (1972–end of sample). The gold standard era and the post-Bretton Woods era are considered to be the periods of globalisation in both goods and services, and of frequent financial crises. Consequently, crisis studies tend to focus on these two periods. In Section IV we will look at how New Zealand compares to the sample of countries in crisis incidence and determinants during these two periods.
These studies of crisis incidence tend to suggest that debtor countries with sound fundamentals and institutions were more likely to avoid financial crises. A key determinant of crises in both eras of globalisation was the exposure to foreign currency debt. However, this could be mitigated by other institutional factors. Countries like the British Dominions, Sweden and Denmark and the US in the first era exhibited low risk despite high ratios of foreign currency debt to total debt, reflecting their ability to offset their exposures with high export receipts in foreign currency or by having large international reserves. It also reflected the fact that they had ‘country trust’, which Caballero, Cowan and Kearns (Reference Caballero, Cowan and Kearns2005) describe as being associated with sound institutions, the rule of law and stable political systems.
III
New Zealand has been exposed through its short history to both financial crises and real shocks. However, its experience with financial crises has been relatively benign. New Zealand has not experienced a sovereign debt crisis, and its two episodes of banking crisis appear relatively mild compared to some international experience.Footnote 5 With the exception of a number of currency crises in the mid twentieth century, its mild crisis experience may only have been surpassed by Canada. In this section, we assemble historical data to analyse crisis incidence for New Zealand using historical narratives and the quantitative methodologies from the literature reviewed above.
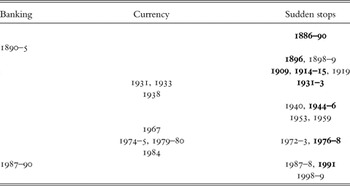
Table 1 contains a chronology of New Zealand's financial crisis experience, summarising the crisis dates we use based on the balance of evidence analysed. The reasoning follows, with further technical and data details available in the Appendix. While the precise start and end dates of each crisis are no doubt open to debate, the dates chosen form a reasonable basis for the empirical work in the remainder of the article.
Crisis dates for New Zealand

Note: Sudden stops are listed in bold if they were coincident with declining real GDP on an annual basis. These are described in Bordo et al. (Reference Bordo, Eichengreen, Klingebiel and Soledad Martinez-Peria2001) as SS1. The other sudden stops are referred to below as SS2.
Hunt (Reference Hunt2009) looks at the New Zealand historical record and identifies two banking crises (1890–5 and 1987–90). The first crisis (1890–5) began with problems in the late 1880s and ended with a government rescue of the Bank of New Zealand (BNZ) in 1895. The crisis was caused by the collapse of a land boom in the mid 1880s. The boom in pastoral land was in turn triggered by massive government investment in infrastructure in the 1870s and favourable wool prices.Footnote 6 The boom ended as global commodity prices declined and credit provision tightened, as the decline in export prices reduced land prices below those capitalised in mortgages and bank credit. This put pressure on the BNZ, which had been a key lender. The pressure on the BNZ and other New Zealand financial institutions was heightened by global events: a sudden stop prompted by the Bank of England raising the Bank rate in the late 1880s, the Baring crisis of 1890 in Argentina and London, and a massive banking panic in Australia in 1893. The deeper underlying cause for all of these crises was a deepening gold deflation reflecting a global excess demand for gold in a world on the gold standard. Deflationary pressure only ended following gold discoveries in Alaska and South Africa in the 1890s. Fearing the effects on the real economy of insolvency, the BNZ was recapitalised by the government in July 1895. The cost of the bailout is estimated to be 1.6 per cent of GDP. This was very mild compared to Australia's crisis, which cost well in excess of 10 per cent of GDP.
The second banking crisis (1987–90) also involved the BNZ, which at the time was predominately government owned. The crisis started with a bank-financed property boom following deregulation of the financial system in 1984. The bust followed the October 1987 Wall Street and local equity market crash, which caused a commercial property bust, the failure of several non-bank financial institutions and substantial losses for the BNZ. The BNZ was recapitalised in 1990 at a cost of approximately 1 per cent of GDP.
We identify currency crises based on an exchange market pressure index supplemented with historical narrative. New Zealand was adjudged to have experienced seven currency crises. All of them occurred during pegged exchange rate regimes. The first three occurred during the Great Depression of the 1930s.Footnote 7 A crisis in 1931, the worst year in the global slump, reflected pressure on the foreign exchange holdings of the trading banks. It led to a 10 per cent depreciation of the NZ pound relative to sterling (Quigley Reference Quigley1992) and the temporary imposition of exchange controls. In 1933, still in the face of contractionary pressure, the NZ pound was devalued by 25 per cent against sterling. Depletion of the banking system's foreign exchange reserves prompted another crisis in 1938. This led to the institution of a strict exchange control and import licensing regime which lasted until the 1980s.
Another series of crises occurred during the Bretton Woods regime after 1944. New Zealand didn't join the IMF until 1961 and kept both capital and import controls throughout the regime. Quigley (Reference Quigley1992) describes a series of crises in the 1950s, but these did not lead to exchange rate depreciation or rising interest rates (instead, typically being mitigated via intensified import controls) so do not meet our definition of a currency crisis.
The fourth crisis followed the collapse in the wool market in 1966. Wool prices declined by around 20 per cent in each of 1967 and 1968 (Reddell and Sleeman Reference Reddell and Sleeman2008). This caused deterioration in the current account and a depletion of New Zealand's reserves. In response the government borrowed from the IMF, tightened import controls and then, following Britain's devaluation of sterling in November, New Zealand devalued its currency by about 20 per cent.
The fifth and sixth crises followed the oil price shock of 1973, which led to a substantial decline in New Zealand's terms of trade, a serious recession and severe pressure on the balance of payments. The NZ dollar was devalued in 1975 and again in 1976. The second oil price shock in 1979 had similar but less severe effects than the first shock. In response, the NZ dollar was devalued by 5 per cent in mid 1979 and the country adopted a crawling peg, which was abandoned in 1982.
The final currency crisis we record was in 1984. The NZ dollar was devalued by 20 per cent following a serious currency crisis during the election campaign. This was quickly followed by deregulation of the financial sector and the elimination of exchange and capital controls.
We identify sudden stops using two measures: SS1 considers a country as having a sudden stop during a given year if there is an annual drop in net capital inflows of at least two standard deviations below the mean of the year-to-year changes for the period, and/or it is the first year of a drop in net capital inflow that exceeds 3 per cent of nominal GDP over a period shorter than four years, and if there is a drop in real GDP (of any magnitude) during that year or the following year. In Table 1 we mark SS1s in bold; SS2 is a broader indicator that does not need to be coincident with declining output.
As can be seen from Table 1, the incidence of several years of sudden stops in the 1880s preceded the banking crisis of 1890–5. Sudden stops also occurred at the start and end of World War I and preceded the currency crises during the Great Depression. In the post-war period they preceded the currency crises of 1974–5 and 1979, but followed the banking crisis of 1990, possibly reflecting the recession of 1991–2. Sudden stops (SS2) occurred during the Asian/Russian crisis but did not lead to a crisis in New Zealand.
IV
Following Bordo and Meissner (Reference Bordo, Meissner, Edwards, Esquivel and Marquez2006a, Reference Bordo and Meissner2006b and Reference Bordo and Meissner2009), we examine determinants of currency crises and sudden stops using their cross-country dataset but augmented with New Zealand data. In the previous studies, New Zealand drops out of the estimation sample because of missing values in key variables.
As in the previous studies based on the Bordo et al. (Reference Bordo, Eichengreen, Klingebiel and Soledad Martinez-Peria2001) dataset, we focus on the two periods of globalisation (1880–1913 and 1972–97) and estimate the models of currency crises and sudden stops using pooled regressions with robust standard errors clustered at the country level. A pooled regression is a common strategy to deal with highly unbalanced panel datasets like this one. Many of the countries in the sample have limited time-series observations, so a panel regression would severely limit the number of countries remaining in the estimation sample. A pooled regression involves pooling observations across country- and time-dimensions such that a unit of observation becomes a country-year, not a country. To allow for the fact that same countries are repeatedly observed in the sample, we use robust standard errors which allow individual countries' errors to be correlated over time.
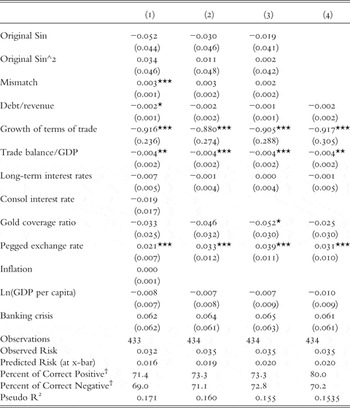
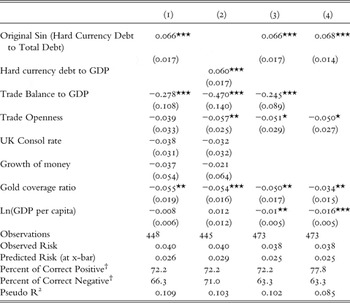
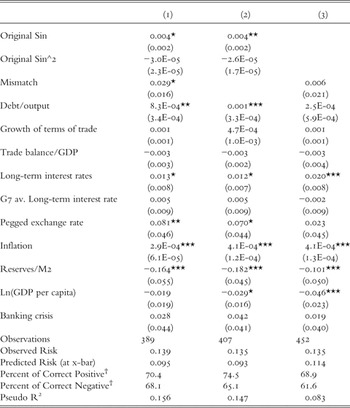
Tables 2–4 report our results which highlight the factors associated with currency crises and sudden stops for a broad group of countries (including New Zealand).Footnote 8 In each table, column (1) is our benchmark specification with all of the key explanatory variables. As we have added a single country to the sample, the findings of the cross-country regressions are similar to those reported in Bordo and Meissner (Reference Bordo, Meissner, Edwards, Esquivel and Marquez2006a, Reference Bordo and Meissner2006b and Reference Bordo and Meissner2009). Some more information on the dataset is contained in the Appendix and in those previous studies. Our key interest is in the fitted values for New Zealand, discussed below.
Determinants of currency crises, 1880–1913

Note: Dependent variable is a binary indicator for a currency crisis. Explanatory variables are in one-period lag (t-1) unless otherwise indicated. Reported coefficients are marginal effects of variables on the probability of a currency crisis. Robust clustered standard errors are in parentheses. *significant at 10%; **significant at 5%; ***significant at 1%. †Cut-off = observed risk in the data.
Determinants of sudden stops, 1880–1913

Note: Dependent variable is a binary indicator for sudden stops (SSI). Explanatory variables are in one- period lag (t-1) unless otherwise indicated. Reported coefficients are marginal effects of variables on the probability of a sudden stop. Robust clustered standard errors in parentheses, *significant at 10%; **significant at 5%; ***significant at 1%. †Cut-off = observed risk in the data.
Determinants of currency crises, 1972–97

Note: Dependent variable is a binary indicator for sudden stops (SSI). Explanatory variables are in one- period lag (t-1) unless otherwise indicated. Reported coefficients are marginal effects of variables on the probability of a sudden stop. Robust clustered standard errors in parentheses. *significant at 10%; **significant at 5%; ***significant at 1%. †Cut-off = observed risk in the data.
In the first era of globalisation New Zealand had no currency crises but faced frequent sudden stops. Our cross-country regression results suggest that countries that were often in currency crisis in this period often had large trade deficits, negative terms of trade shocks, and high mismatches (Table 2). Original sin by itself was not significantly related to currency crises (columns 1–3). Countries that had a pegged exchange rate (which would often have been a commitment to the gold standard) experienced more currency crises during this period. The latter may reflect the fact that a peg is more likely to be defended (leading to declining reserves and rising interest rates, which are used as evidence of a currency crisis) and will be more subject to speculative attack than a clean float. However, the evidence that pegs are more crisis prone may be the result of selection bias, as some countries which had been too weak to remain formally pegged were forced to float in this era.
Our cross-country regression results also showed that countries that were often experiencing sudden stops in this period tended to have high original sin, large trade deficits, and were relatively closed to international trade (Table 3). A higher original sin was an independently significant factor for sudden stops during this period, unlike for currency crises. The composition of debt captured by original sin (the share of hard-currency debt in total debt) seems to matter for sudden stops whether or not we control for the level effect (foreign currency debt relative to GDP or total debt relative to GDP, the latter not shown). Countries with relatively high per capita incomes, which could be a proxy for a better set of institutions, more developed financial systems, and/or better management of debt, tended to have fewer crises.Footnote 9
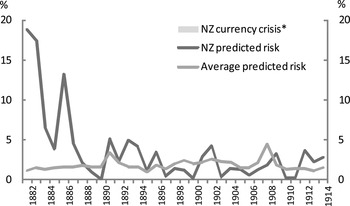
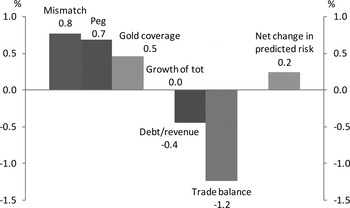
Drawing implications for New Zealand, Figure 2 plots the estimated probability of a crisis in New Zealand over the first period of globalisation. Predicted risk for New Zealand was elevated in the late 1880s due to a combination of a large trade deficit and negative terms of trade shocks. While terms of trade remained volatile throughout, a turnaround in the trade balance to a strong surplus in subsequent years contributed to lower predicted risks for the rest of the period. Figure 3 plots determinants of predicted risk of a currency crisis in New Zealand vis-à-vis average predicted risk (the estimated probability of currency crises when all explanatory variables are held at the sample averages). The results suggest that New Zealand managed to avoid currency crises by maintaining a higher trade surplus and lower debt on average, which offset its relative vulnerability from having a larger mismatch, a pegged exchange rate and lower gold reserves. Overall, New Zealand's average predicted risk was slightly higher than the average predicted risk for the sample for the period.
Predicted risk of a currency crisis for New Zealand, 1880–1913

Differences in predicted risk of a currency crisis for New Zealand vis-à-vis the average country (1880–1913 averages)

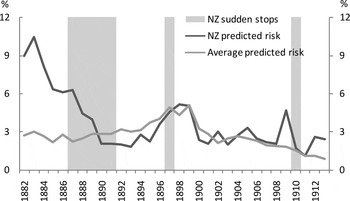
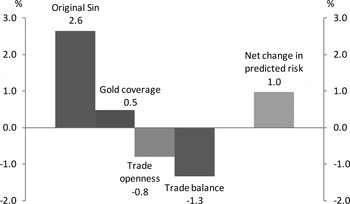
Figures 4 and 5 repeat the exercise for sudden stops in 1880–1913, a period in which New Zealand had three sudden stops. Shaded regions in Figure 4 represent the actual years of crises. The model seems to predict well the periods of relative vulnerability of New Zealand to a sudden stop. Predicted risk for New Zealand tended to be higher in years preceding the actual years of crises. Figure 5 suggests that New Zealand's relative vulnerability to sudden stops in this period could be related to its higher level of original sin and, to a lesser extent, lower gold reserves than average. These effects offset vulnerability reductions from New Zealand's trade surpluses and relatively high openness. Overall, the predicted risk for New Zealand of a sudden stop was 1 percentage point higher than the average predicted risk for the sample.
Predicted risk of a sudden stop for New Zealand, 1880–1913

Differences in predicted risk of a sudden stop for New Zealand vis-à-vis the average country (1880–1913 averages)

In the second era of globalisation, New Zealand had more frequent currency crises but fewer sudden stops – the opposite of what it experienced in the first era of globalisation (Table 1). The cross-country results show that countries that were more prone to currency crisis in this period tended to have high original sin with mismatch, high overall levels of debt, high interest rates, a pegged exchange rate and low international reserves (Table 4). Countries with relatively low per capita income (a proxy for ‘weak institutions’) also suffered more crises.
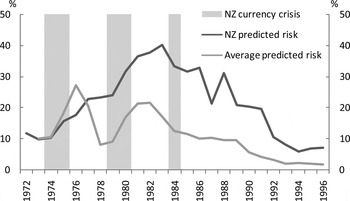
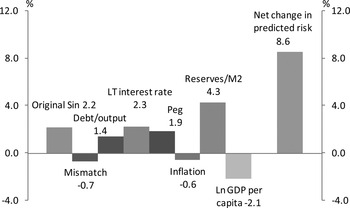
Figures 6 and 7 show predicted risk of a currency crisis in New Zealand relative to average for 1972–97. Figure 6 shows that predicted risk for New Zealand was higher than for the average country in the sample throughout the period, but especially between the mid 1970s and the mid 1980s when the country actually suffered several currency crises. Figure 7 suggests that New Zealand's vulnerability to currency crises over the period is related to its weak fundamentals in most relevant areas other than per capita income. It had higher original sin, higher debt relative to output, higher interest rates and lower international reserves. The net predicted risk was nearly 9 percentage points higher than the average in the sample, although there were other countries in the sample (predominately developing countries) that suffered more crises and had higher predicted risk.
Predicted risk of a currency crises for New Zealand, 1972–97

Differences in predicted risk of a currency crisis for New Zealand vis-à-vis the average country (1972–97 averages)

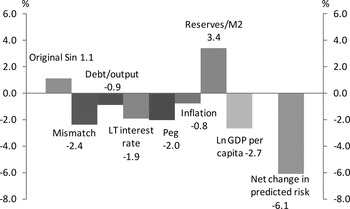
To understand how risk facing New Zealand has changed since the end of the sample, Figure 8 examines the out-of-sample predictions for New Zealand's probability of currency crises for 1998–2008. To produce the out-of-sample predictions, we used the within-sample estimates of marginal effects from the currency crises regression for 1972–97 (Table 4, column 1), and applied the out-of-sample values for key policy variables in New Zealand (e.g. mismatch, long-term interest rates, etc).Footnote 10 This exercise suggests New Zealand faces much lower risk of a currency crisis today due to improvements since the mid 1990s in many areas of policy weaknesses identified in the previous period. Declining original sin, mismatch, overall level of debt, long-term interest rates and the floating of the NZD are estimated to have had a particularly significant impact in reducing the risk of currency crises based on our cross-country model.
Out of sample differences in predicted risk of a currency crisis for New Zealand (1998–2008) vis-à-vis the average country in the 1972–97 sample

It is important to note that declining inflation and long-term interest rates have been features of the last decade for many other countries, and there have been relatively few currency crises. New Zealand risk has declined relative to the average country in the 1972–97 dataset, but may not have declined as much relative to the average country today. A second important caveat is that new sources of risk of currency crisis have arisen that are not features of our dataset and model. For example, private-sector debt has become an increasingly important risk factor for national balance sheets. We believe that cross-country analysis of a more recent period exploring new sources of risk for currency crises and sudden stops would be an interesting piece of future work.
In sum, New Zealand was less exposed than the other countries in the sample to the risks of currency crises in the first era of globalisation because of its better fundamentals, but was more exposed to sudden stops because of its relatively high level of original sin. In the second era, New Zealand was more exposed than the other countries in the sample to the risk of currency crises despite its relatively high income per capita (a proxy for ‘sound institutions’) because of weaknesses in fundamentals such as substantial government debt. Since then, improvements in fundamentals have reduced the risks of currency crises facing New Zealand, according to our model, but it is important to note that new sources of risks that our model does not capture have arisen in the recent international financial crisis.
V
In this section, we explore the impact of financial crises on New Zealand growth and compare it to the impact of global influences such as major country growth or the terms of trade. New Zealand's small size means we can use trading partner growth and world price variables to explain New Zealand growth without worrying about causality issues: if New Zealand macroeconomic variables are correlated with global macroeconomic variables, it must be the global variables driving New Zealand growth rather than the other way around.Footnote 11 Because we are dealing with a 120-year dataset spanning multiple exchange rate regimes and many technological shifts we naturally do not expect the precise lags between variables to have been stable. For this reason, and also to eliminate noise, we use a smoothed growth rate (the three-year change in the three-year moving average) for the dependent variable (NZ growth) and most of the explanatory variables. We refer to this transformation below as a smoothed growth rate or simply growth.
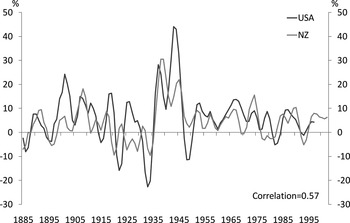
The global macroeconomic variables we consider are the US growth rate, terms of trade, and UK consol rate. We include US growth, which was fairly correlated with NZ growth over the period (Figure 9), as an indicator of global economic activity. We also tried UK growth as well as (or instead of) US growth in unreported specifications, but this did not fit as well. This may be because the US was already a key driver of the global business cycle in the interwar period, even if the direct trade links between New Zealand and the UK were more important than New Zealand/US trade until the mid 1970s. As discussed below, we use UK real interest and a UK/NZ real exchange rate in the regression. We use these UK variables partly because of data availability, but also because of the strong direct trade links that existed between New Zealand and the UK for much of the period under examination. New Zealand's terms of trade is also expected to be an important independent driver of domestic activity (with commodity booms boosting farm incomes for example). We do not claim that this regression offers a definitive explanation of New Zealand's historical growth experience (more detailed studies of particular shorter periods can provide other insights, and convergence testing like Greasley and Oxley Reference Greasley and Oxley1997 is also relevant). However, it forms a convenient baseline to examine potential crisis effects over a long sample.
Real smoothed per-capita growth rates (USA and New Zealand)

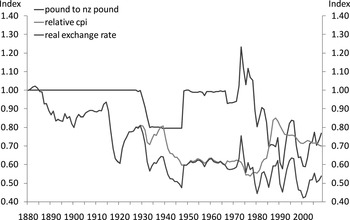
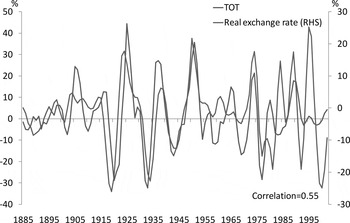
Before adding crisis variables, we experimented with simple regressions of NZ growth on domestic policy variables. We were unable to find a stable relationship between NZ growth and domestic real interest rates over the period. This may reflect the multiplicity of monetary policy regimes, which limits the ability of the simple model to identify monetary policy shocks (e.g. endogenous monetary tightenings may be coincident with strong economic growth). The relationship between NZ growth and the real exchange rate (of the NZD against sterling) was more stable. The NZD gradually depreciated against sterling until around the 1930s while measured UK inflation generally outpaced NZ's through the period, so that the real exchange rate gradually fell (Figure 10). The fluctuations in the smoothed real exchange rate were well correlated with the smoothed terms of trade growth rate (Figure 11).
NZ/UK nominal exchange rate, relative CPIs and implied real exchange rate, 1880–2008

Fluctuations in the smoothed real exchange rate and the terms of trade

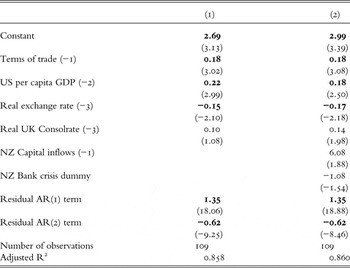
Table 5, column 1 shows our benchmark regression in which NZ growth is explained by the smoothed growth rates of the terms of trade, the real exchange rate and US growth. To account for serial correlation in the residuals induced by the smoothing of the growth rate we added an AR(2) process for the residuals.
Regressions explaining fluctuations in New Zealand growth

Note: Dependent variable, Terms of trade, US GDP and real exchange rate are smoothed growth rates (the three-year change in the three-year moving average). Capital inflow is a two-year change in the two-year moving average ratio to GDP. T-statistics (using Newey-West standard errors) in parentheses. Significant coefficients (at 5% or better) are shown in bold.
As can be seen, the terms of trade, US output, and the real exchange rate are statistically significant (using Newey-West standard errors) and have expected signs.
We then introduced our different measures of NZ crisis dates into the regression. We tried specifications (not reported) that included the indicators of currency crises or sudden stops from Table 1 above, but they were not statistically significant and were often incorrectly signed. This differs from the results in cross-country analysis like Bordo, Cavallo and Meissner (Reference Bordo, Cavallo and Meissner2010) where sudden stops have a discernable impact on growth. This may be because we have a number of variables in the regression (such as the terms of trade and world interest rates) which are likely to be correlated with sudden stops (indeed Bordo, Cavallo and Meissner use them as explanators of sudden stops in an earlier regression).
In specification (2), we use a measure of capital inflows rather than a binary sudden stop indicator, and a dummy variable representing banking crises.Footnote 12 Both are correctly signed, though the coefficients are statistically insignificant and (see below) also not particularly significant in the regression's explanation of New Zealand growth.
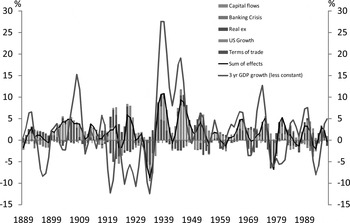
Figure 12 illustrates the impact of all the regressors in the benchmark regression (the black line) compared to the actual variable (grey line). The impacts of the key driving variables are represented additively by the stacked bars. To make the influences of the other variables clearer the residual autocorrelation terms are not included in the fitted values. US growth and the terms of trade explain much of the variation in real growth across many of the growth cycles. The real exchange rate often partly offsets the terms of trade effect (so the exchange rate is acting as a buffer). Fit is generally good; however, the regression struggles to explain the weakness of New Zealand's economic performance in the second half of the 1920s, and the strength of the economic recovery after the depression (which partly relates to the shift to wartime production; see Easton Reference Easton1997). The banking crisis variable helps explain weak periods of growth around the two banking crises, although it does not have a major impact. The impact of the capital flow variable is also relatively minor.
Explanatory variables and New Zealand growth

While we preferred to work with smoothed variables for the reasons discussed above, the smoothing can be interpreted as a particular set of parameter restrictions on a simple annual growth regression. To test the robustness of our results to this, we ran some regressions using simple annual growth rates. This naturally did not fit as well, but continued to imply that the international driving variables (particularly the terms of trade in this specification) explained New Zealand growth better than the crisis variable.Footnote 13 This was also true in pre- and post-World War II subsamples.
The limited explanatory power of ‘crises’ over and above international variables is an interesting result. It may reflect the relatively mild nature of many of the ‘crises’ in New Zealand history (for example, the fact that the two banking crises largely involved a single leading bank rather than the entire banking system and never provoked a widespread collapse in banking confidence). It may also suggest that financial crises in New Zealand are mainly an endogenous response to stress brought on by exogenous global forces rather than a significant independent source of variation in the New Zealand growth rate. It is hard to test this hypothesis for many countries since there is significant two-way causality between domestic and international variables, but as discussed above we are able to plausibly treat international variables as exogenous to New Zealand developments.
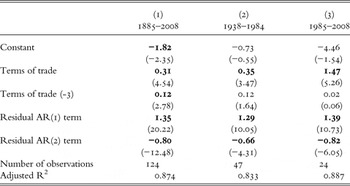
The value of the real exchange rate as a buffer against terms of trade fluctuations is apparent in Figure 11. One interesting question is the extent to which the responsiveness of the real exchange rate to the terms of trade may have increased since the 1985 float. A simple regression (Table 6) over 1885–2008 of the smoothed real exchange rate change on the smoothed terms of trade change (with a third lag to allow for the potential for the real exchange rate to respond more slowly in fixed rate regimes) suggests that the real exchange rate responded to the terms of trade in both samples. However, there was less response and some evidence of a lag in the insulationist period (1938–84) and the full sample, while in the post-float period the response was stronger and not lagged. This suggests that the real exchange rate may have buffered terms of trade fluctuations somewhat more effectively since the float.
Regressions of the NZ real exchange rate on the terms of trade

Note: Real exchange rate and terms of trade are three-year moving average growth rates. T-statistics (using Newey-West standard errors) in parentheses. Significant coefficients (at 5% or better) are shown in bold.
VI
Financial crises have occurred across most countries and across different exchange rate regimes. Cross-country empirical literature studying periods of strong globalisation suggests that countries have some hope of avoiding financial crises by following sound policies and adopting sound institutions, and our analysis of New Zealand appears consistent with this. In the first era of globalisation New Zealand was less exposed to a currency crisis than the average country. For the second era of globalisation, however, New Zealand was more exposed to a currency crisis than the average country because of its weak fundamentals. Our out-of-sample prediction for New Zealand suggests that improvements in many of the policy areas (mismatch, debt to GDP, international reserves, etc.) in the more recent period mean that New Zealand faces reduced risk of currency crises today.
However, the global business cycle can still exert powerful effects on small open economies like New Zealand even if they follow sound policies and avoid serious financial crises. Our time series analyses suggest that shocks to the terms of trade and global economic variables are key determinants of New Zealand's medium-term growth over the long sample we study. Domestic crisis-dummy variables appear to add little explanatory power to the NZ growth rate regression over and above the impact of the international factors. Thus, as seen recently, global crises that reduce global activity sharply will affect New Zealand even if New Zealand avoids slipping into crisis itself.
Appendix
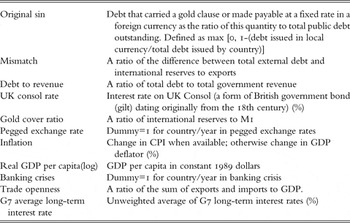
General notes on data sources. Our data for cross-country analyses come from Bordo and Meissner (Reference Bordo and Meissner2006b and 2009). Where not obvious, variable definitions are contained in Table A1.
Selected variable definitions

We appended New Zealand data to their dataset using the Statistics New Zealand (SNZ)'s long-term data series. This includes inflation, government debt and revenue, trade and GDP data, and the terms of trade. To cover more recent years, the long-term data series are spliced to modern sources from the Reserve Bank database. Where key variables were missing for NZ we filled them according to the description below.
Reserves. The Bordo and Meissner mismatch measure is (Government external debt – reserves/exports). We do not have data for NZ reserves in the early period (1880–1913) and therefore use estimated values. Specifically, we assumed that NZ maintained the same level of import cover (a ratio of reserves to import) as Australia for the period and multiplied Australia's import cover by NZ's imports to get NZ's reserves. For the most recent period, we use the IFS measure of NZ external debt (line 89a) and of Reserves (line 1l). IFS external debt figures are discontinued around 2001 and we switch to the external debt figures from the SNZ Overseas debt survey.
Exchange rate. The NZD/Sterling real exchange rate is calculated using historical UK CPI data from O'Donoghue (Reference O'DONOGHUE2004) and a nominal exchange rate series from Briggs (Reference Briggs2003).
Capital flows. New Zealand capital inflows are estimated using the identity that the current account plus change in reserves is equal to the capital account. The trade balance is used as a proxy for the variability in the current account (debt service being likely to be less cyclical). Reserves data are only available after 1948 (using IFS line 1l) and the change in reserves is assumed to be zero prior to that.
An Exchange Market Pressure indicator is constructed along the lines of Eichengreen, Rose and Wyplosz (Reference Eichengreen, Rose and Wyplosz1994) to identify currency crises using changes in the exchange rate, interest rates and reserves. However, the historical use of capital controls and the lack of reserves data prior to 1948 reduce the reliability of this indicator. The currency crises we identify in historical narrative tend to be coincident with actual depreciation in the exchange rate.
Further information on countries in the panel estimation sample and the frequency of crises each had during the two periods of globalisation is available on request from the authors.
International variables in New Zealand growth regression. International variables in the growth regression are sourced from the Bordo et al. (Reference Bordo, Eichengreen, Klingebiel and Soledad Martinez-Peria2001) dataset available at Michael Bordo's website.