Implications
The results of this study indicate that the use of a meta-population within the scope of the Spanish autochthonous beef cattle populations may provide an increase of accuracy for populations with small size or limited economic resources for genotyping. Besides, the advantage of admixed populations seems to be greater when predicting individuals more distant from the training set because the across breed and multi-breed genomic predictions are based more on the LD between markers and quantitative trait loci (QTL) than on family relationships.
Introduction
The advances in the area of molecular genetics have allowed the development of SNP chips that provide genomic information throughout the genome (Gunderson, et al., Reference Gusev, Lee, Trynka, Finucane, Vilhjalmsson, Xu, Zang, Ripke, Bulik-Sullivan, Stahl, Kahler, Hultman, Purcell, McCarroll, Daly, Pasaniuc, Sullivan, Neale, Wray, Raychaudhuri and Price2005). Along with the molecular advances, new statistical methods have been developed with the purpose of predicting the breeding values of candidates to selection using genomic information (Meuwissen et al., Reference Meuwissen, Hayes and Goddard2001). The potential applications of these methods have been tested through simulation (Meuwissen et al., Reference Meuwissen, Hayes and Goddard2001) and in different species such as mice (Legarra et al., Reference Legarra, Robert-Granié, Manfredi and Elsen2008), aquaculture (Vallejo et al., Reference Vallejo, Leeds, Gao, Parsons, Martin, Evenhuis, Fragomen, Wiens and Palti2017), poultry (Heidaritabar et al., Reference Hill and Robertson2016) and pigs (Tussell et al., Reference Tussell, Gilbert, Riquet, Mercat, Legarra and Larzul2016).
In cattle, genomic selection is a reality in large (Hayes et al., Reference Heidaritabar, Wolc, Arango, Zeng, Settar, Fulton, O’Sullivan, Bastiaansen, Fernando, Garrick and Dekkers2009) and medium-sized dairy cattle populations (Reiner-Benaim et al., Reference Reiner-Benaim, Erza and Weller2017). In beef cattle, it has been implement in some medium or large populations (Lourenco et al., Reference Lourenco, Tsuruta, Fragomeni, Masuda, Aguilar, Legarra, Bertrand, Amen, Wang, Moser and Misztal2015; Silva et al., Reference Silva, Fragomeni, Lourenco, Magalhaes, Irano, Carvalheiro, Canesin, Mercadante, Boligon, Baldi, Misztal and Albuquerque2016). Nevertheless, the full application of genomic selection methods in the beef cattle industry is somewhat questionable. The main drawbacks are the limited census of some beef populations, the great variability of the production systems, the narrow use of artificial insemination and the low quality of phenotypic recording (Berry et al., Reference Bolormaa, Pryce, Kemper, Savin, Hayes, Barendse, Zhang, Reich, Mason, Bunch, Harrison, Reverter, Herd, Tier, Graser and Goddard2016).
In simulation scenarios, several authors (De Roos et al., 2009; Kizilkaya et al., Reference Kizilkaya, Fernando and Garrick2010; Toosi et al., Reference Toosi, Fernando and Dekkers2010) have shown how it is feasible to increase the precision of the genomic predictions by using phenotypic and genomic information provided by several populations. Their results indicate that the use of a combined population is more helpful when the populations involved have diverged for a small number of generations, for populations of reduced size, and for traits of low heritability if high-density genotypes are available. With real data, some studies have obtained promising results (Weber et al., Reference Weber, Thallman, Keele, Snelling, Bennett, Smith, McDaneld, Allan, Van Eenennaam and Kuehn2012), whereas some others reported almost no advantage from a multi-population genomic evaluation (Karoui et al., Reference Karoui, Carabaño, Díaz and Legarra2012; Bolormaa et al., Reference Browning and Browning2013; Chen et al., Reference Clark, Hickey, Daetwyler and van der Werf2013; Kachman et al., Reference Kachman, Spanger, Bennett, Hanford, Kuehn, Snelling, Thallman, Saatchi, Garrick, Schnabel, Taylor and Pollak2013). Though it seems that its potential use should be studied in each specific case because it is population and trait dependent (Saatchi et al., Reference Saatchi, Schnabel, Rolf, Taylor and Garrick2012).
The Spanish autochthonous cattle breeds have a Bos taurus ancestral origin and it is estimated that they have a common origin (Beja-Pereira et al., Reference Berry, Garcia and Garrick2003), with estimated FST statistics between them ranging between 0.009 and 0.068 (Cañas-Álvarez et al., Reference Cañas-Álvarez, Mouresan, Varona, Diaz, Molina, Baro, Altarriba, Carabano, Casellas and Piedrafita2015) and with a quite important persistency of haplotype phase between them (Cañas-Álvarez et al., Reference Chen, Schenkel, Vinsky, Crews and Li2016). These characteristics jointly with the small size of these populations and the limited economic resources available for genotyping, suggest an appealing scenario to explore the implementation of genomic selection in a meta-population context. Thus, the objective of this study is to evaluate the efficiency of the potential application of multi-breed genomic selection in the Spanish beef cattle populations through a simulation study using a genomic data set to mimic the populations’ LD structure.
Material and methods
The genomic data used for simulation purposes consisted of genotypes from 171 triplets (sire/dam/offspring) obtained with the Illumina BovineHD Beadchip from seven breeds: Asturiana de los Valles (AV), n=25, Avileña - Negra Ibérica (ANI), n=24, Bruna dels Pirineus (BP), n=25, Morucha (Mo), n=25, Pirenaica (Pi), n=24, Retinta (Re), n=24 and Rubia Gallega (RG), n=24. The triplets were sampled under the criteria of minimizing the genealogical relationship between them in order to capture as much of the variability as possible in each population.
The SNP filtering process included the following requirements: (1) Mendelian error bellow 0.05, (2) SNP and individual call rates higher than 95% and (3) minor allele frequency higher than 0.01, and it was performed using the Plink software (Purcell et al., Reference Purcell, Neale, Todd-Brown, Thomas, Ferreira, Bender, Maller, Sklar, de Bakker, Daly and Sham2007). Further, SNPs that were located on the autosomal chromosomes were kept and those found in repetitive positions were excluded. At the end of the process there were 629 251 SNP markers covering 2 510 350 kb of the autosomal chromosomes with a mean density of one marker per 3.99 kb. The reconstruction of the parental haplotypes was conducted with the software Beagle (Browning and Browning, Reference Cañas-Álvarez, González-Rodríguez, Munilla, Varona, Díaz, Baro, Altarriba, Molina and Piedrafita2009) using the ‘TRIO’ option.
Simulation
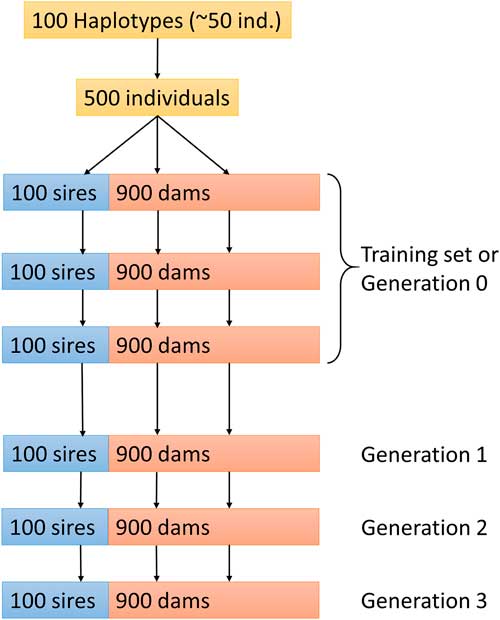
As mentioned, the simulation procedure was set up to reproduce the existing linkage disequilibrium structure of each breed. Thus, we started with the 100 available paternal haplotypes (50 individuals) for each breed comprising 629 251 SNP markers. Then, we expanded the populations to 500 individuals in the first generation. For each population, the 629 251 SNP markers of the individuals of the first generation were simulated by gene-dropping and assuming a map distance of 1 cM every Mb. Their parents were selected randomly from the previous generation (50 individuals) ignoring their sex. Following the same procedure, six more generations of 1000 individuals (100 sires and 900 dams) were simulated, selecting the parents randomly but considering their sex this time. The first three generations were used to establish the training populations for each breed, and the last three were used for validation. A summary of this simulation procedure is presented in Figure 1.
Structure of the simulation strategy for the generation of pseudo-populations for each population.

Further, in order to simulate the causative mutations of a trait, 3% of the SNP markers of each chromosome were randomly selected as QTL and they were attributed an additive effect sampled from a Gaussian distribution with zero mean and a standard deviation of one. Later on, for every individual, true breeding values (TBVs) were calculated as the sum of the effects of their genotype for the QTL polymorphisms. In addition, beside the polygenic model, five other scenarios of genetic architecture of the quantitative traits were simulated to create a sensitivity analysis:
∙ LMAF: Only markers with extreme frequencies (minor allele frequency ⩽0.05) were chosen to be QTLs.
∙ Ex: The effects of the QTLs were drawn from an exponential distribution instead of a Gaussian distribution.
∙ 10G(20%): 10 randomly selected QTLs which explained 20% of the total genetic variance were added to the polygenic model.
∙ 4G(50%): Four randomly selected QTLs were added to the polygenic model explaining 50% (5%, 10%, 15% and 20% for each QTL) of the total genetic variance.
∙ 4MG: Four QTLs were randomly selected to explain the 100% of the genetic variance with effects drawn from a normal distribution.
For each scenario, phenotypes were simulated for all individuals in the training population summing to their TBV, a trait mean (=1000) and a residual drawn from a Gaussian distribution with appropriate variance to generate two traits with heritability 0.4 and 0.1, respectively.
Genomic evaluation
The genomic evaluation was performed by means of a Bayesian procedure with the solveSNP software (Legarra and Misztal, Reference Legarra and Misztal2008) and under the following model.
 $$y_{i} \,{\equals}\,\mu {\plus}\mathop \sum\limits_{j\,{\equals}\,1}^n x_{{ij}} a_{j} {\plus}e_{i} $$
where y i is the phenotype of the ith individual, µ the trait mean, n the number of SNPs, x ij the genotype of the ith individual for the jth marker coded as 0, 1 and 2, a j the substitution effect for the jth marker and e i the residual effect of the ith individual. Further, the prior distribution for the marker effects was the following multivariate Gaussian distribution:
 $${\mib{a}} \!\sim \!MV{\mib{N}} \left( {0,\,{\mib{I}} \sigma _{a}^{2} } \right)$$
where
 $\sigma _{a}^{2} $
is the marker variance whose prior distribution was assumed to be uniform within appropriate bounds.
The SNP markers selected as causal mutations were excluded from the marker panel during the genomic evaluation. Later on, genomic estimated breeding values (GEBV) were calculated as:
 $$GEBV_{i} \,{\equals}\mathop \sum\limits_{j{\equals}1}^n x_{{ij}} \widehat{{a_{j} }}$$
Several scenarios of genomic evaluation were considered depending on the size and composition of the reference population.
∙ Pure-bred (PG): The reference population comprised 3000 individuals of one of the populations simulated. All seven populations were used as reference populations separately.
∙ Admixed_2 (×2): The reference populations comprised 3000 (1500+1500) randomly selected individuals from two purebred populations. All possible combinations were used as reference populations.
∙ Admixed_7 (×7): One reference population comprised 3003 individuals with 429 randomly selected individuals from each of the seven populations.
In addition, reduced purebred populations of 1500 and 429 individuals were used with the aim of comparing them to the admixed scenarios under equal genotyping effort within populations. As before, genotyped individuals were sampled randomly from the training populations.
Validation
In order to validate the predictions, we calculated the accuracy as the Pearson correlation between the simulated and the predicted breeding values in three additional generations (generations 1, 2 and 3) of 1000 non-phenotyped individuals for every population. Each case of simulation was replicated five times and we present the mean and standard error per generation.
Results and discussion
Single-breed evaluation
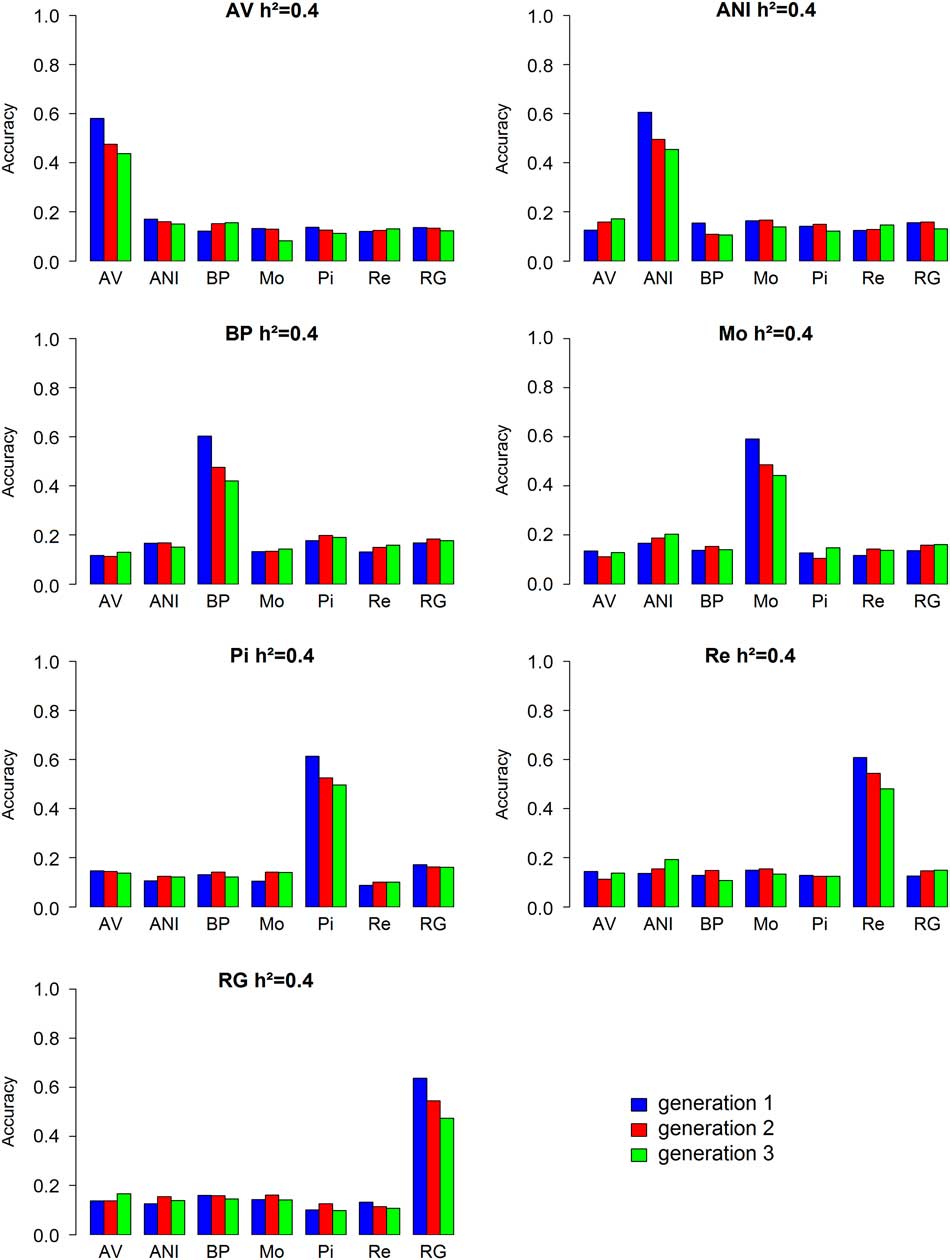
In the first scenario, the effects of the SNP markers were estimated within each breed. Then, they were used to predict the GEBV within and across breeds. Figure 2 and Supplementary Material Table S1 show the results of the accuracies obtained for a trait with heritability 0.4 in all populations in generation 1 and for two subsequent generations. Within-breed accuracies at the first generation were the highest, ranging from 0.637 (RG) to 0.580 (BP). These results are similar to those reported by Saatchi et al. (Reference Saatchi, McClure, McKay, Rolf, Kim, Decker, Taxis, Chapple, Ramey, Northcutt, Bauck, Woodward, Dekkers, Fernando, Schnabel, Garrick and Taylor2011) and Van Eenennaam et al. (Reference Van Eenennaam, Weigel, Young, Cleveland and Dekkers2014) from empirical field studies with traits of comparable heritabilities. On the other hand, the across-breed accuracies were very low, with the highest value obtained when training in BP to predict over Pi (0.177) and the lowest when training in Pi to predict over Re (0.087). These results confirm the postulate of Harris et al. (Reference Hayes, Bowman, Chamberlain and Goddard2008) that indicated that training in one population and to predict in another is not effective. However, it is remarkable that all the average estimates of accuracy were positive which is coherent with the persistency of LD found between these populations and the genetics closeness between them (Cañas-Álvarez et al., Reference Chen, Schenkel, Vinsky, Crews and Li2016).
Accuracy from single-breed genomic evaluation (h 2=0.4). AV=Asturiana de los Valles; ANI=Avileña-Negra Iberica; BP=Bruna dels Pirineus; Mo=Morucha; Pi=Pirenaica; Re=Retinta; RG=Rubia Gallega; generations 1, 2, 3=distance in generations between the training and validation sets.

When predicting the subsequent generations the within-breed accuracies resulted on average lower by 16.4% in generation 2 with values between 0.545 (RG) and 0.475 (AV) and 24.3% in generation 3 with values between 0.496 (Pi) and 0.420 (BP) with respect to generation 1. The decrease in accuracy across generations was expected and confirms the relevance of the relationship between the testing and training populations in the accuracy of genomic selection (Clark et al., Reference De Roos, Hayes and Goddard2012). Nevertheless, the across-breed accuracies remained similar to generation 1, because the relationship between testing and training populations was not modified in these cases.
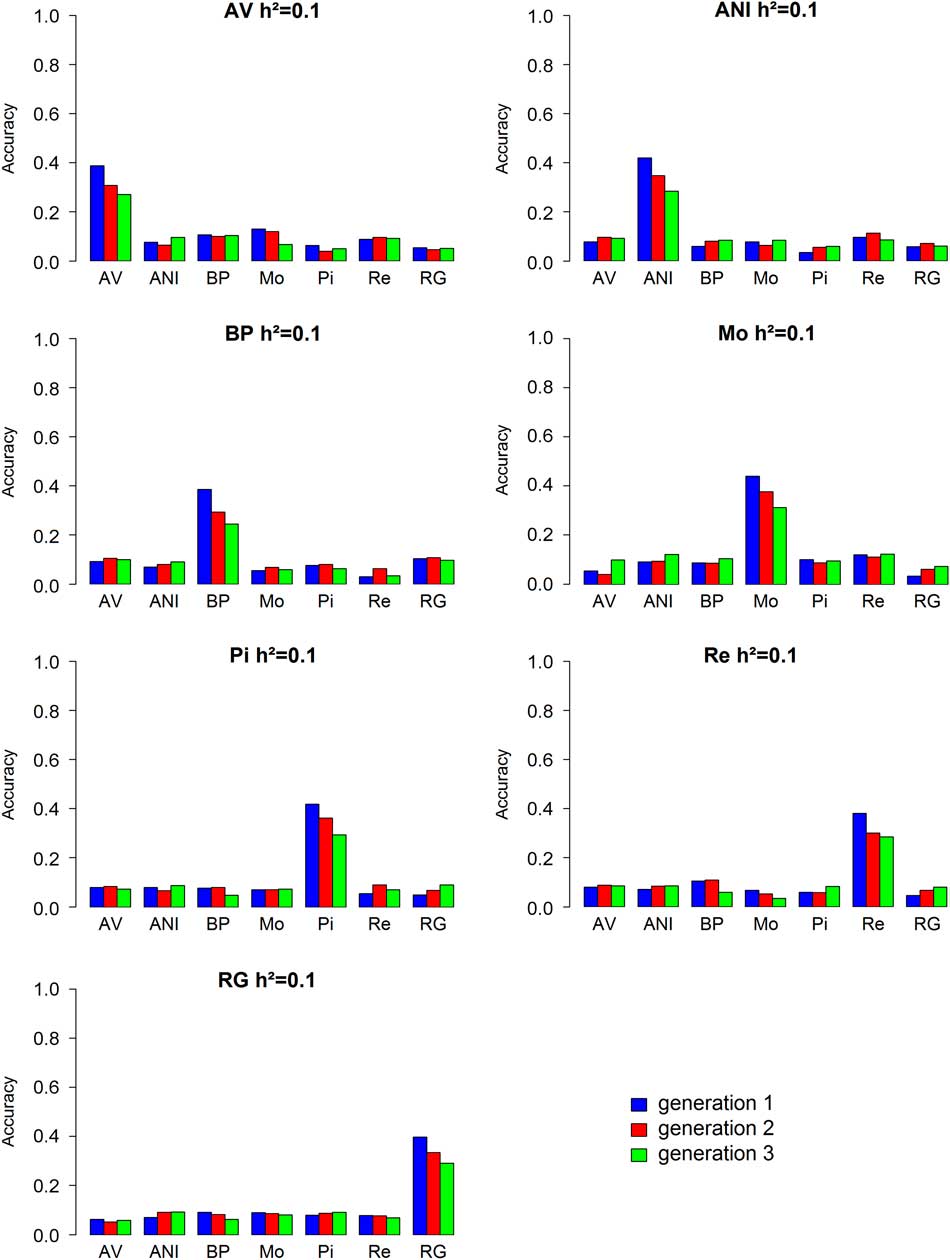
The results of accuracy obtained when evaluating for a trait with heritability 0.1 were similar but with lower magnitude of accuracies (Figure 3 and Supplementary Material Table S2). Thus, values ranged between 0.440 (Mo) and 0.380 (Re) for within-breed predictions and between 0.129 (AV over Mo) and 0.030 (BP over Re) for across-breed predictions in generation 1. The loss of predictive ability over subsequent generations resulted to be higher than that of the previous case. The within-breed accuracies were 18.1% lower in generation 2 (0.377 (Mo)–0.292 (BP)) and 30.0% in generation 3 (0.312 (Mo)–0.244 (BP)) than generation 1 (Figure 3). In traits with low heritabilities, the family information has a major impact on breeding value estimation (Falconer and Mackay, Reference Gibson1996). Therefore, as the relationship between testing and training populations weakened from one generation to the other, the loss of accuracy became more evident.
Accuracy from single-breed genomic evaluation (h 2=0.1). AV=Asturiana de los Valles; ANI=Avileña-Negra Iberica; BP=Bruna dels Pirineus; Mo=Morucha; Pi=Pirenaica; Re=Retinta; RG=Rubia Gallega; generations 1, 2, 3=distance in generations between the training and validation sets.

Evaluation in admixed ×2
The training sets used in this second scenario were set up by mixing data from two purebred populations with equal proportion of each. All possible combinations were considered which resulted in 21 different admixed populations. The results of the predictive ability of these populations over the purebred populations for generation 1 and for a trait with heritability of 0.4 are presented in Supplementary Material Table S3. When the purebred validation population was included in the admixed training set the accuracies ranged from 0.545 (AV–RG over RG) to 0.475 (AV–ANI over AV). However, when the purebred validation population was not included in the training set the accuracies resulted similar to the previous scenario of across-breed evaluation and ranging between 0.186 (AV–BP over RG) and 0.103 (Re–RG over Pi).
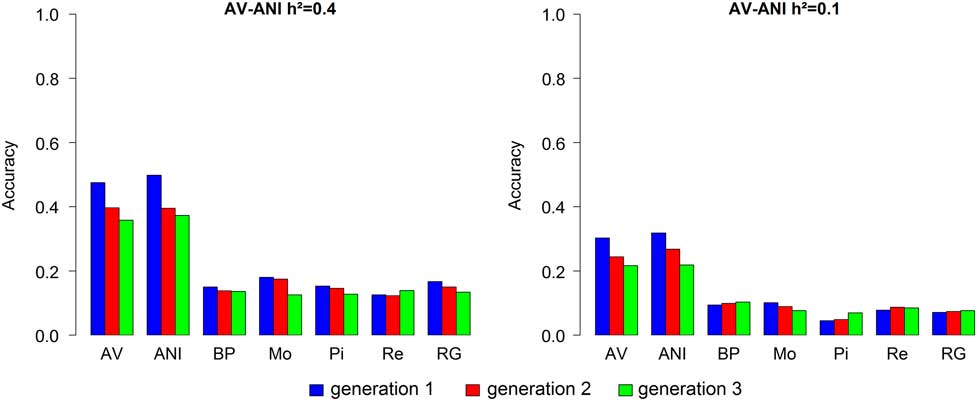
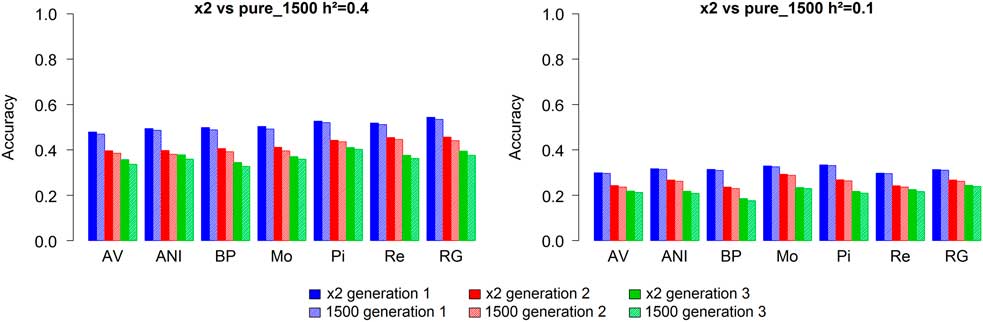
As an example, Figure 4 shows the results obtained from training in the AV–ANI population for all generations. As expected, the predictive ability over the subsequent generations was lower than that of the training population for AV and ANI. Though, the loss in predictive ability resulted slightly higher than that of the previous case. On average (Figure 5), the accuracies resulted 15.6% and 26.2% lower, compared with generation 1, for generations 2 and 3, respectively. The reason of this higher decrease of accuracy may be the limited number of individuals with a direct relationship with the testing population in the training set (1500 v. 3000).
Accuracy obtained from genomic evaluation in an admixed ×2 population (AV-ANI). AV=Asturiana de los Valles; ANI=Avileña-Negra Iberica; BP=Bruna dels Pirineus; Mo=Morucha; Pi=Pirenaica; Re=Retinta; RG=Rubia Gallega; generations 1, 2, 3=distance in generations between the training and validation sets.

Average accuracy obtained from genomic evaluation in the admixed ×2 population and comparison with the results of purebred genomic evaluation with 1500 individuals per population. AV=Asturiana de los Valles; ANI=Avileña-Negra Iberica; BP=Bruna dels Pirineus; Mo=Morucha; Pi=Pirenaica; Re=Retinta; RG=Rubia Gallega; generations 0, 1, 2, 3=distance in generations between the training and validation sets; ×2=admixed training set from all two purebred populations (1500+1500 individuals); pure_1500=purebred training set with 1500 individuals.

Moreover, the results with heritability 0.1 were similar (Supplementary Material Table S4), although the overall accuracies resulted lower than previously. Accuracies for the populations included in the training set ranged between 0.338 (BP–Pi over Pi) and 0.290 (Pi–Re over Re). On the other hand, the results for the populations not included in the admixture were also lower, from 0.122 (AV–BP over Mo) to 0.029 (MO–Re over RG). The loss of accuracy in the subsequent generations was 17.7% and 30.2% for generations 2 and 3, respectively (Figure 5).
Evaluation in admixed ×7
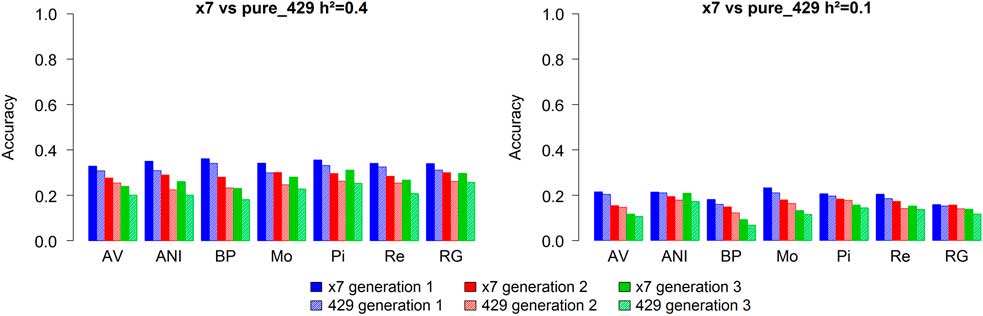
Finally, the last training set used for genomic evaluation was constructed by combining data of 429 randomly selected individuals from each purebred population (total 3003 individuals). Figure 6 shows the results obtained for all populations and all generations. The accuracies resulted between 0.363 (BP) and 0.330 (AV) for the trait with h 2=0.4 and between 0.233 (Mo) and 0.159 (RG) for the trait with h 2=0.1, while the loss of accuracy with the generations was 16.1% and 22.2% for the first trait (h 2=0.4) and 15.8% and 29.7% for the second trait (h 2=0.1). The accuracies were lower than those in the previous scenarios and, as before, the loss of accuracy when training and testing populations were more distant was greater with lower heritability.
Accuracy obtained from genomic evaluation in the admixed ×7 population and comparison with the results of purebred genomic evaluation with 429 individuals per population. AV=Asturiana de los Valles; ANI=Avileña-Negra Iberica; BP=Bruna dels Pirineus; Mo=Morucha; Pi=Pirenaica; Re=Retinta; RG=Rubia Gallega; generations 0, 1, 2, 3=distance in generations between the training and validation sets; ×7=admixed training set from all seven purebred populations (7×429 individuals); pure_429=purebred training set with 429 individuals.

Admixed v. reduced purebred
For each scenario, we also performed genomic evaluations using a subset of randomly selected individuals (1500 and 429) in order to compare them with the admixed populations and evaluate the effect of adding individuals from other populations to increase the size of the training dataset. Figure 5 (1500 individuals per population) and Figure 6 (429 individuals) present also the results of this comparison. They showed that adding information from another population to a small-sized training set was beneficial in all cases. The admixed ×2 populations performed slightly better than the reduced purebred populations with 1500 individuals with 1.7%, 3.0% and 4.2% higher accuracies for generations 1, 2, and 3, respectively, for a trait with h 2=0.4 and 1.1%, 2.1% and 3.4% for a trait with h 2=0.1. This superiority of the admixed population was more evident between the admixed ×7 and the reduced purebred populations of 429 individuals. Here, the gain in accuracy with the number of generations was 8.8%, 16.7% and 23.2% for the first trait (h 2=0.4) and 7.3%, 11.2% and 15.8% for the second trait (h 2=0.1). The most probable cause of this phenomenon is that as the relatedness between the training set and the validation set weakens the predictions are based more on the short range LD between the markers and the QTLs than on the pure family relationship between individuals. Thus, the admixed populations perform better because of the higher number of data and the fact that mixing data breaks down the long distance LD created by relatedness and leaves the effects of the short range LD that persists through generations (Hill and Robertson, Reference Beja-Pereira, Alexandrino, Bessa, Carretero, Dunner, Ferrand, Jordana, Laloe, Moazami-Goudarzi, Sanchez and Cañon1968). Nevertheless, these results indicate that the information provided by genetically related populations can be somewhat useful when the genotyping ability of a single population is restricted due to economic or size limitations and it seems to be more helpful when trying to predict individuals with weak genetic relationship with the training population.
Genetic architecture of the trait
Finally, we also compared the consequences of alternative genetic architecture of the traits. Thus, along with the polygenic traits (PG) simulated above, five more cases of genetic architecture were simulated as described earlier. In Supplementary Material Figure S1, we present the average within-breed accuracies for both traits (h 2=0.4 and h 2=0.1), obtained from training in purebred populations for all the populations simulated and for all generations. The values obtained were similar in all cases which is somewhat surprising for cases where QTLs explain a large amount of the genetic variance. As causal mutations are removed from the prediction process, the Bayesian procedure here used might not be the method of choice for these type of traits as it is unable to accommodate the differential effect of QTLs. To illustrate this phenomenon, Supplementary Material Figure S2 reflects the relationship between the LD with the causal polymorphism and the estimated effects for the closest 1000 markers in the validation and testing populations. The total effect of the QTL (20.16) was split in a large number of marker effects with estimates between −0.016 and 0.028. Some of them present a large LD with the causal polymorphism, but some others with a moderate LD are also associated with relevant SNP effects. Moreover, the relationship between LD and the estimated marker effects is reduced with the generations of separation between training and testing populations (r 2=0.851 in the testing population v. r 2=0.796 in the third generation of validation). Thus, if the existing LD between markers and causal mutations becomes smaller just by chance it would mean that the ability of markers to capture the effect of the QTLs would be reduced and therefore the effect on accuracy may become evident. Small differences can be observed only for the case of traits that are controlled by rare variants (LMAF) with MAF lower than 0.05 where the loss of accuracy was slightly greater with the number of generation.
Similarly, the results from the admixed ×2 and admixed ×7 training sets showed little differences among cases (Supplementary Material Figures S3 and S4, respectively). As before, only the LMAF case gives slightly lower accuracies. This phenomenon is coherent with the results obtained by Wientjes et al. (Reference Wientjes, Calus, Goddard and Hayes2015) that indicated that when the QTLs controlling the genetic variability of the traits have low frequencies the prediction ability of genomic selection is lower. However, although this has been suggested as the cause of the missing heritability (Gibson, Reference Gonzalez-Recio, Daetwyler, MacLeod, Pryce, Bowman, Hayes and Goddard2012), the evidence for the percentage of genetic variation that rare variants produce is low and some authors have shown that these rare variants explain only a small percentage of the missing heritability of complex traits in human (Gusev et al., Reference Harris, Johnson and Spelman2014) or cattle (Gonzalez-Recio et al., Reference Gunderson, Steemers, Lee, Mendoza and Chee2015).
Moreover, the reduced sized purebred populations performed similarly as in all previous cases. The only exception was that of the LMAF case where the reduced purebred training sets yielded higher accuracies than those of the admixed training sets with the number of generations. In the LMAF case, the markers selected to simulate the causal mutations where selected under the condition of having extreme frequencies (MAF⩽0.05). As a consequence, the LD between the neutral markers and the QTLs is lower even at close distances and therefore, the reduced purebred training sets perform better than the admixed training sets because there is a larger proportion of family LD than sort range historical LD, even though the family relationship is decaying with the number of generations.
In conclusion, the results of this study indicate that the use of a meta-population may provide an increase of accuracy in scenarios with a reduced size of reference populations within breed. Further, the advantage of admixed populations seem to be greater when predicting individuals more distant from the training set because the across breed and multi-breed genomic predictions are based more on the LD between markers and causal polymorphism than on family relationships. This advantage should be more evident as the density of the genetic map growths. Nevertheless, some recent studies (Iheshiulor et al., Reference Iheshiulor, Woolliams, Yu, Wellmann and Meuwissen2016; Van den Berg et al., Reference Van den Berg, Boichard and Lund2016) have probed that the use of full sequence data only provide marginal increases of the ability of prediction between distant breeds. Moreover, we assumed in this study that the genetic effect of QTL is constant across breeds, a typical assumption that may be wrong. The presence of epistatic or genotype×environmental interactions will also reduce the ability of prediction across breeds. Finally, it should also be noted that in this study all individuals in the reference populations were phenotyped and genotyped. The presence of missing phenotypes or genotypes in some individuals would probably reduce the ability of prediction.
Acknowledgements
The authors want to thank the AGL 2010-15903 grant from the Spanish government; the collaboration of Breed societies in collecting samples and the support of FEAGAS is also acknowledged. J. J. Cañas-Álvarez acknowledges the COLCIENCIAS support by the Francisco José de Caldas fellowship 497/2009 and A. González-Rodríguez acknowledges the financial support by the BES-2011-045434 fellowship.
Supplementary material
To view supplementary material for this article, please visit https://doi.org/10.1017/10.1017/S175173111700283X