Introduction
Accurate species diagnosis is central to biological research. Delimiting species based on morphological criteria is often complicated by phenotypic plasticity, genetic variability, cryptic taxa, and peculiarities of different life stages or genders (Hebert et al. Reference Hebert, Cywinska, Ball and deWaard2003a, Reference Hebert, Ratnasingham and deWaard2003b). To overcome these challenges, Hebert et al. (Reference Hebert, Cywinska, Ball and deWaard2003a, Reference Hebert, Ratnasingham and deWaard2003b) proposed a standardized genetic identification system for animal species. DNA barcoding uses sequence diversity in the mitochondrial gene, cytochrome c oxidase subunit I (COI), to create genetic profiles for taxonomically verified specimens. Reference libraries of barcode sequences serve as species identifiers for individuals of unknown origin. For this system to succeed at discriminating taxa, COI divergence within species cannot exceed genetic distance between species (Hebert et al. Reference Hebert, Cywinska, Ball and deWaard2003a, Reference Hebert, Ratnasingham and deWaard2003b). By focusing on rapidly evolving mitochondrial DNA (mtDNA) in general (and COI in particular) the diversity requirement is typically met for closely allied species, provided the taxa in question have persisted for a sufficient period of time (Hebert et al. Reference Hebert, Cywinska, Ball and deWaard2003a, Reference Hebert, Ratnasingham and deWaard2003b). Hence, DNA barcoding has demonstrated success in several animal groups (e.g., spiders, Barrett and Hebert Reference Barrett and Hebert2005; mayflies, Ball et al. Reference Ball, Hebert, Burian and Webb2005; beetles, Monaghan et al. Reference Monaghan, Balke, Gregory and Vogler2005; fish, Ward et al. Reference Ward, Zemlak, Innes, Last and Hebert2005; amphibians, Smith et al. Reference Smith, Poyarkov and Hebert2008; birds, Kerr et al. Reference Kerr, Stoeckle, Dove, Weigt, Francis and Hebert2007; among others). However, when reproductive isolation between species is recent, taxonomic diagnosis based on molecular criteria becomes more difficult; factors such as inadequate genetic signal, incomplete lineage sorting, and introgressive hybridization tend to obscure species boundaries (Funk and Omland Reference Funk and Omland2003). Consequently, DNA barcoding may be less informative in cases of recent lineage radiations.
Black flies (Diptera: Simuliidae) provide an opportunity to test COI's ability to distinguish recently diverged species. In general, simuliids are taxonomically difficult due to their small size and structural homogeneity. Morphologically indistinguishable sibling species are also common throughout the family; cytological analyses of larval polytene chromosomes often reveal the presence of chromosomally distinct sibling species within morphologically defined nominal species. When this is the case, band-by-band examination of chromosomes provides the only means to accurately identify species. As such, chromosomal rearrangements have become accepted taxonomic and phylogenetic indicators in black flies (Rothfels Reference Rothfels1979, Reference Rothfels1981, Reference Rothfels1989; Adler et al. Reference Adler, Currie and Wood2004). Various lines of evidence suggest sibling species complexes are the product of recent chromosome-based speciation (Rothfels Reference Rothfels1989).
Few studies have attempted to diagnose black fly sibling species using COI barcodes. Some efforts were met with limited success. For example, using the barcoding fragment, Ilmonen et al. (Reference Ilmonen, Adler, Malmqvist and Cywinska2009) distinguished Simulium juxtacrenobium Bass and Brockhouse, a chromosomally and morphologically distinct species, from Simulium crenobium (Knoz) and Simulium vernum s.s Macquart. However, S. crenobium and S. vernum s.s. did not have distinct COI profiles, even though species status was confirmed based on breeding habitat and chromosomal data (Ilmonen et al. Reference Ilmonen, Adler, Malmqvist and Cywinska2009). Likewise, a 920 base-pair (bp) region of the COI gene could not discriminate between Simulium dussertorum Craig and Simulium oviceps Edwards, two morphologically similar members of the S. oviceps group (Joy et al. Reference Joy, Craig and Conn2007). These taxa belong to a large radiation of simuliids within the Society Islands, French Polynesia (Joy et al. Reference Joy, Craig and Conn2007).
Other barcoding studies of black fly sibling species have proven fruitful. In Britain, Simulium reptans (L.) consists of two morphologically distinct larval types that lack identifiable variation as adults and pupae. Whether these entities are distinct or variants of a single species has been debated (reviewed in Day et al. Reference Day, Goodall and Post2008). DNA barcoding delineated the larval morphotypes into two highly supported monophyletic clades. Moreover, genetic distance was 10-fold greater between, than within each cluster. Because this level of genetic differentiation is consistent with that found within and between species in other taxa, as well as with that established by the DNA barcoding consortium for delimiting species (Hebert et al. Reference Hebert, Stoeckle, Zemlak and Francis2004), a re-evaluation of the status of S. reptans variants was proposed (Day et al. Reference Day, Goodall and Post2008). Interestingly, COI barcodes have also been used to successfully distinguish geographically localized populations of single black fly species (Prosimulium neomacropyga Peterson in the Rocky Mountains, United States [Finn et al. Reference Finn, Theobald, Black and Poff2006]; Simulium tani Takaoka and Davies in Thailand [Pramual et al. Reference Pramual, Kuvangkadilok, Baimai and Walton2005]).
Finally, in a comprehensive study, Rivera and Currie (Reference Rivera and Currie2009) showed that barcoding was not only effective in discriminating among recognized Nearctic black fly species, but also confirmed cryptic diversity, as previously revealed by cytological analyses. These authors evaluated 58 morphologically distinct species, as well as five known and three suspected sibling species complexes (known complexes analysed: Helodon onychodactylus Dyar and Shannon complex, Stegopterna mutata (Malloch) complex, Simulium arcticum Malloch complex, Simulium tuberosum (Lundstrom) complex, and Simulium venustum Say complex; suspected complexes analysed: Simulium craigi Adler and Currie, Simulium quebecense Twinn, and Simulium murmanum Enderlein). In virtually all cases, genetic distances within morphospecies were comparatively lower than that found within-species complexes, indicating the presence of cryptic diversity. Moreover, the neighbour-joining (NJ) tree depicted deep divergences within complexes, suggesting that more than one species was sampled. Given that individuals belonging to species complexes were not cytologically analysed, Rivera and Currie (Reference Rivera and Currie2009) could not resolve whether divergent clades within complexes corresponded to cytologically recognized sibling species. Therefore, the performance of DNA barcoding for accurately identifying black fly sibling species remains unclear.
Here, we build on Rivera and Currie (Reference Rivera and Currie2009) by examining the extent to which barcoding captures species boundaries and allows identification of black fly sibling species. We focus on the S. arcticum complex – the second largest sibling species assemblage known for black flies (Adler and Crosskey Reference Adler and Crosskey2010) and the most diverse Nearctic complex studied by Rivera and Currie (Reference Rivera and Currie2009). The S. arcticum complex contains nine reproductively isolated sibling species (i.e., “cytospecies”) and an additional 21 chromosomally distinct types that may or may not represent valid species (i.e., “cytotypes” Adler et al. Reference Adler, Currie and Wood2004; Shields et al. Reference Shields, Clausen, Marchion, Michel, Styren and Riggin2007a, Reference Shields, Pickens, Clausen and Strizich2007b, Reference Shields, Christiaens, Van Leuven and Hartman2009, unpublished data; Adler and Crosskey Reference Adler and Crosskey2010).
These taxa are distributed throughout the Nearctic region, primarily in the Western Cordillera, from Alaska to Arizona (Adler et al. Reference Adler, Currie and Wood2004). Although the S. arcticum complex occurs widely in western North America, a large portion of its biodiversity is concentrated in the Rocky Mountains of Montana, United States (Adler et al. Reference Adler, Currie and Wood2004; Shields et al. Reference Shields, Clausen, Marchion, Michel, Styren and Riggin2007a, Reference Shields, Pickens, Clausen and Strizich2007b, Reference Shields, Christiaens, Van Leuven and Hartman2009). Within this geographic region, larvae of at least four sibling species and 14 cytotypes are known to coexist (Adler et al. Reference Adler, Currie and Wood2004; Shields et al. Reference Shields, Clausen, Marchion, Michel, Styren and Riggin2007a, Reference Shields, Pickens, Clausen and Strizich2007b, Reference Shields, Christiaens, Van Leuven and Hartman2009, unpublished data; Adler and Crosskey Reference Adler and Crosskey2010).
The following four lines of evidence collectively demonstrate that S. arcticum taxa are the product of a rapid and recent lineage radiation: (1) lack of morphological differentiation among members of the complex, (2) the nature of the chromosome rearrangements defining S. arcticum cytospecies and cytotypes (reviewed in Rothfels Reference Rothfels1989), (3) recent phylogenetic analyses (Conflitti et al. Reference Conflitti, Kratochvil, Spironello, Shields and Currie2010), and (4) high taxonomic diversity concentrated in Montana, United States. Given that Montana is generally not considered a biodiversity hotspot, one can speculate that S. arcticum populations in the Rocky Mountains have experienced rapid chromosome-based speciation as a result of recent glacial cycles.
We previously investigated phylogenetic relationships among 26 S. arcticum individuals representing four species (S. apricarium Adler et al., S. arcticum s.s., Simulium negativum Adler et al., and Simulium saxosum Adler et al.) and two cytotypes (IIL-10 and IIL-73,74) (Conflitti et al. Reference Conflitti, Kratochvil, Spironello, Shields and Currie2010). Maximum parsimony and Bayesian analyses based on 12S, COII, cyt b, and ITS-1 gene sequences failed to resolve species-level monophyly of any taxon except S. negativum.
In that preliminary study, larvae were not cytologically analysed. Instead, individuals were sampled from presumed taxon-pure localities in Montana and Alaska, United States. Therefore, it is possible that non-monophyly resulted from imperfect taxonomy, because collection sites may not have remained pure at the time of sampling. This general approach was taken to avoid challenges presented by molecular studies of structurally homogeneous taxa distinguished only via chromosome banding pattern analysis. Specifically, genetic studies require ethanol-fixed larvae, while cytogenetic identifications can only be made using individuals preserved in Carnoy's solution, a fixative known to degrade DNA (Post et al. Reference Post, Flook and Millest1993; Koch et al. Reference Koch, Duncan, Parsons, Pruess and Powers1998). Although Pramual et al. (Reference Pramual, Kuvangkadilok, Baimai and Walton2005) recently reported success in obtaining genetic data from Carnoy's fixed material, our concerns regarding efficient DNA extraction and amplification, as well as replicability of results, precluded the use of their methods in our preliminary study (Conflitti et al. Reference Conflitti, Kratochvil, Spironello, Shields and Currie2010).
To eliminate erroneous taxonomy as the cause of non-monophyly, we performed a second analysis based on cytologically verified taxa collected from Montana and adjacent states (Conflitti et al. Reference Conflitti, Kratochvil, Spironello, Shields and Currie2010). We used the COI barcoding fragment along with COII gene sequences to investigate phylogenetic relationships among 42 individuals representing 13 taxa within the S. arcticum species complex. Again, individuals did not form monophyletic lineages that matched their cytotaxonomic designations. Overall, we could not confidently reject inadequate phylogenetic information, incomplete lineage sorting, and/or introgressive hybridization as the cause of non-monophyly of S. arcticum taxa (Conflitti et al. Reference Conflitti, Kratochvil, Spironello, Shields and Currie2010).
As in Conflitti et al. (Reference Conflitti, Kratochvil, Spironello, Shields and Currie2010), our study focused on cytologically verified S. arcticum individuals from Montana and surrounding regions. However, only formally described (i.e., nominal) sibling species were included in our analysis. Monophyly of these taxa may have been obscured in previous studies by the inclusion of potentially non-reproductively isolated forms (i.e., cytotypes). We also extended our analysis by including more individuals per species sampled over a broader geographic range. This ensured that molecular diversity within each species was adequately represented. As products of a recent lineage radiation, members of the S. arcticum complex provide a challenging test of the efficacy of DNA barcoding in resolving species boundaries.
Materials and methods
Taxon sampling and chromosome analysis
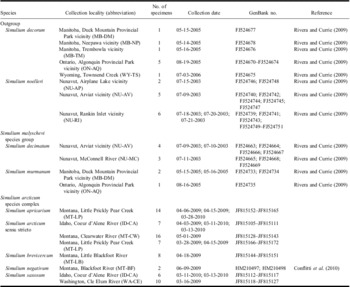
We sampled 70 individuals representing five described species within the S. arcticum complex (Table 1). Where possible, we included multiple individuals per species (range = 2–30, mean = 14) from various localities in Montana and surrounding states (Idaho and Washington). Sequence data for S. negativum was extracted from GenBank. All remaining S. arcticum individuals were newly collected, identified, and sequenced for our study. Collected larvae were identified to the S. arcticum complex according to Currie (Reference Currie1986). Heads and thoraces were removed and retained in 95% ethanol for molecular analysis. Abdomens were preserved in Carnoy's fixative (1 part glacial acetic acid, 3 parts 95% ethyl alcohol) for cytogenetic identification; fixative was changed until it remained clear. Then, abdomens were stained with Feulgen (Rothfels and Dunbar Reference Rothfels and Dunbar1953) to enable visualization of polytene chromosomes and gonads. Chromosome maps for the S. arcticum species complex (Shields and Procunier Reference Shields and Procunier1982; Adler et al. Reference Adler, Currie and Wood2004) were used to identify larvae to chromosome type. Although the S. arcticum complex was the focus of this study, we included exemplars of two closely related, morphologically and chromosomally distinct species (Simulium decimatum Dorogostaisky et al. and S. murmanum) for comparison. Simulium decorum Walker and Simulium noelleri Friederichs were chosen as the outgroup based on previous morphological and molecular evidence (Adler et al. Reference Adler, Currie and Wood2004; Rivera and Currie Reference Rivera and Currie2009). Sequences for S. decimatum and S. murmanum, as well as outgroup taxa, were extracted from GenBank (Table 1).
List of Simulium taxon samples with corresponding collection information and GenBank accession numbers.

DNA extraction, amplification, and sequencing
Genomic DNA was extracted from larval heads and thoraces using the GenElute Mammalian Genomic DNA Miniprep Kit (Sigma-Aldrich, St. Louis, Missouri). Standard DNA barcoding primers (LCO1490 5′-GGTCAACAAATCATAAAGATATTGG-3′ and HCO2198 5′-TAAACTTCAGGGTGACCAAAAAATCA-3′; developed by Folmer et al. Reference Folmer, Black, Hoeh, Lutz and Vrijenhoek1994) were used to target a 658 bp region of the COI gene. Each 25 μL polymerase chain reaction (PCR) consisted of 2.5 μL Fisher brand buffer (Fisher Scientific, Waltham, Massachusetts), 1.5 μL MgCl, 0.8 μL dNTP, 1 μL of each primer, 0.1 μL Fisher brand Taq DNA polymerase (Fisher Scientific), and 1 μL template DNA. PCR cycling parameters were as follows: 1 min at 96°C; 35 cycles of 1 min at 94°C, 1 min at 55°C, and 1.5 min at 72°C; and finally 7 min at 72°C. Amplification products were visualized on 1.5% agarose gels stained with ethidium bromide. Ten microlitres sequencing reactions contained 2 μL 5× sequencing buffer (Applied Biosystems, Carlsbad, California), 1 μL either forward or reverse primer, 0.5 μL BigDye Terminator (Applied Biosystems), and either 2 or 4 μL purified DNA. Products were bi-directionally sequenced on an ABI 3730 DNA Analyser (Applied Biosystems). Table 1 contains GenBank accession numbers for each sequence obtained.
Data analysis
COI sequences were aligned manually using BioEdit Sequence Alignment Editor v7.0.9.0 (Hall Reference Hall1999). The majority of sequences were 610 bp in length; longer barcodes were trimmed to this position. The two S. negativum sequences acquired from GenBank were only 587 bp in length. To fit the start position of our dataset, five bases were trimmed from the 5′-region of these sequences. After trimming, 28 bases (identified as “N”) were added to the 3′-end of the sequences and treated as missing data in all analyses. Note that, because no variable regions were lost, sequence trimming had no effect on subsequent analyses. Genetic variation was assessed using PAUP* v4.0b10 (Swofford Reference Swofford2003). Pair-wise sequence divergence within and between taxa was calculated using the Kimura 2-parameter (K2P) model. This model provides the best estimate of divergence when genetic distances are low, as in recently diverged taxa (Nei and Kumar Reference Nei and Kumar2000). A NJ tree of K2P distances was created to provide a graphic representation of species divergence. Clade support was estimated using 10,000 bootstrap replicates (faststep search; Felsenstein Reference Felsenstein1985). Summary statistics of intraspecific and interspecific distances (i.e., minimum, maximum, and mean), as well as histograms were produced using Microsoft Excel 2007.
Many COI sequences differed by few substitutions. In some cases, sequences were shared among species. As such, a network representation of genetic distances might help to determine relationships. A statistical parsimony network (Templeton et al. Reference Templeton, Crandall and Sing1992) was constructed using TCS v1.21 (Clement et al. Reference Clement, Posada and Crandall2000) to investigate haplotype relationships within the S. arcticum species complex.
Conventional barcoding terminology was used to discuss species status. Species were defined based on two main criteria: (1) reciprocal monophyly among COI barcodes and (2) interspecific divergence values greater than a standard threshold of 10× the mean intraspecific variation for the group under study (Hebert et al. Reference Hebert, Stoeckle, Zemlak and Francis2004). Applying a strict threshold as the basis for defining species may not be appropriate for certain taxa. In particular, this approach tends to overlook species with short evolutionary histories (Hebert et al. Reference Hebert, Stoeckle, Zemlak and Francis2004), such as members of the S. arcticum complex. Therefore, we used the threshold value simply as a tool for making comparisons, as well as for testing barcoding's ability to differentiate black fly sibling species.
Results
We obtained 68 new barcode sequences, 610 bp in length, for four nominal species within the S. arcticum species complex. Variability within the complex was calculated based on five sibling species; sequences for the fifth species, S. negativum, were acquired from a previous study (Table 1). No insertions, deletions, or stop codons were found indicating that all sequences constituted functional mitochondrial products (Funk and Omland Reference Funk and Omland2003). Consistent with results from other insect studies, our mtDNA dataset showed strong A + T bias in base composition (A: 27.0%, T: 37.1%, G: 16.9%, C: 19.0%; A + T = 64.1%; Clary and Wolstenholme Reference Clary and Wolstenholme1985; Nardi et al. Reference Nardi, Carapelli, Fanciulli, Dallai and Frati2001).
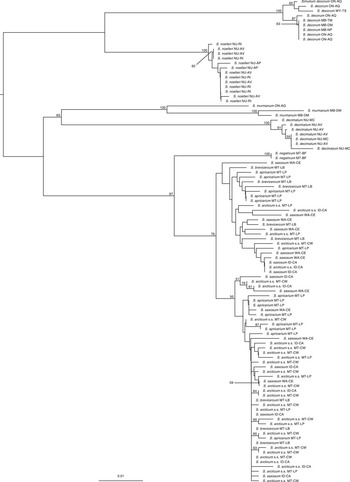
Figure 1 presents the NJ tree based on K2P distances, along with bootstrap support (BSS). Significant support was obtained for monophyly of the S. arcticum complex (BSS = 97%). However, within the complex only S. negativum was monophyletic (BSS = 100%). No other sibling species could be distinguished using the barcoding gene. The S. arcticum specimens analysed, excluding S. negativum, cluster into two weakly supported groups, with each species and locality represented at least once in both subclades. The majority of nodes associated with the S. arcticum complex lack BSS. Morphologically and chromosomally distinct species (S. decimatum and S. murmanum), as well as outgroup taxa, were monophyletic and highly supported (BSS = 100% in all cases).
Neighbour-joining tree for Simulium taxa generated using K2P distances. Analysis is based on 102 cytochrome c oxidase subunit I sequences, 610 bp in length. Numbers above the nodes indicate bootstrap support (⩾50%).

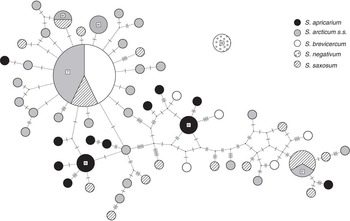
The results for the S. arcticum complex are not surprising given that identical sequences were shared within, as well as between, species. The haplotype network illustrates this point (Fig. 2). Fifty-seven COI haplotypes were found among the 70 S. arcticum individuals examined. These are clustered into two subgroups that reflect the division between S. negativum and the remaining members of the complex, as displayed in the NJ tree. Most barcode haplotypes were present only in a single individual. Although four haplotypes were shared by individuals within species, three were shared between species. Cases of interspecific haplotype sharing included the following sibling species: S. arcticum s.s. and S. saxosum; and S. arcticum s.s., Simulium brevicercum Knowlton and Rowe, and S. saxosum. The network approach supports incongruence between barcode data and species boundaries of S. arcticum taxa.
Parsimony network showing 95% probability linkages among 57 cytochrome c oxidase subunit I haplotypes obtained from 70 individuals representing five Simulium arcticum sibling species. Ticks across network connections represent mutational changes. The area of each circle is proportional to the number of individuals containing the haplotype. Haplotypes marked by α, β, and γ, are present in two, three, and seven individuals, respectively. All remaining haplotypes are found in only a single individual.

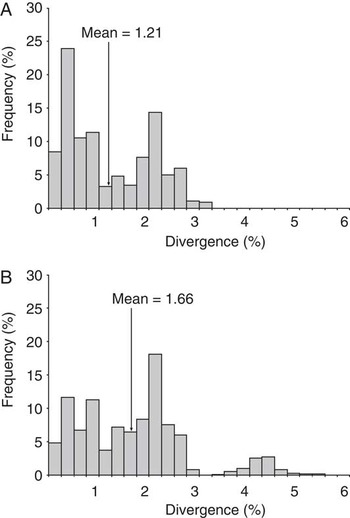
Within the S. arcticum complex, intraspecific K2P distances ranged from 0.00%–3.20% with a mean of 1.21% (Fig. 3A). The highest divergence value was found in S. saxosum; the lowest was present in all S. arcticum species. Similar interspecific distances were obtained (0.00%–5.43%; mean = 1.66; Fig. 3B). The slightly greater range of interspecific distances, compared with intraspecific values resulted from the inclusion of S. negativum in divergence calculations. Specifically, distances between S. negativum and all other members of the complex ranged from 3.54%–5.43%, whereas interspecific values among the latter were 0.00%–3.38%. Therefore, excluding S. negativum, the distribution of COI variability within and between S. arcticum sibling species completely overlapped one another. Average intraspecific distance within the S. arcticum complex was greater than that of all other species analysed, the exception being S. murmanum, a suspected species complex (Adler et al. Reference Adler, Currie and Wood2004) (S. decorum = 0.46%, S. noelleri = 0.19%, S. decimatum = 0.36%, S. murmanum = 3.52%, S. arcticum complex = 1.21%). In contrast, mean interspecific divergence within the complex was significantly lower than that observed for other species comparisons (S. decorum = 11.94%, S. noelleri = 10.60%, S. decimatum = 10.88%, S. murmanum = 10.77%, S. arcticum complex = 1.66%). Overall, the S. arcticum complex showed interspecific distances that are comparable to within, rather than among species diversity of other taxa.
Frequency distribution of intraspecific (A) and interspecific (B) K2P distances for five members of the Simulium arcticum species complex.

In terms of a benchmark value for defining species, a 10× interspecific divergence threshold was calculated as 10.60% (average intraspecific distance across all taxa = 1.06%). This value may be inflated because of high within-species variation for S. murmanum, as well as for S. arcticum taxa. Nevertheless, all members of our broadly defined outgroup (S. decorum, S. noelleri, S. decimatum, and S. murmanum) had average interspecific divergence values equal to or greater than the cut-off criteria. In contrast, no member of the S. arcticum complex met this traditional barcode threshold for delimiting species.
Discussion
We assessed the ability of barcoding to differentiate members of a recent black fly lineage radiation. The S. arcticum species complex was monophyletic in relation to the outgroups, two closely related members of the Simulium malyschevi species group (S. decimatum and S. murmanum) and two more distantly related members of the S. noelleri group (S. decorum and S. noelleri; Fig. 1). Of five morphologically indistinguishable but chromosomally distinct S. arcticum sibling species, only S. negativum was recovered with robust molecular support. No other members of the complex could be distinguished using COI barcodes. Our results are consistent with and significantly augment the main findings of Conflitti et al. (Reference Conflitti, Kratochvil, Spironello, Shields and Currie2010). In our study we built on Conflitti et al. (Reference Conflitti, Kratochvil, Spironello, Shields and Currie2010) by sampling more extensively geographically and numerically from individual locations (i.e., over four times as many individuals per species on average) to ensure adequate representation of genetic variation within each sibling species.
DNA barcoding will accurately recognize species when (1) sequences are not shared between sister taxa and (2) intraspecific genetic variation does not exceed interspecific divergence (Hebert et al. Reference Hebert, Stoeckle, Zemlak and Francis2004). Failures in species identification are proportional to the amount of overlap between the distribution of intra- and interspecific distances (Meyer and Paulay Reference Meyer and Paulay2005). In our study, three S. arcticum sibling species (S. arcticum s.s., S. brevicercum, and S. saxosum) shared identical barcode haplotypes (Fig. 2). Moreover, the distribution of interspecific genetic distances completely overlapped the range of variation within species (Fig. 3). Consequently, the COI gene could not differentiate most members of the S. arcticum complex.
Diagnosis based on molecular criteria is particularly difficult when species are separated by a short history of reproductive isolation because various processes can result in shared DNA haplotypes and lack of reciprocal monophyly. Funk and Omland (Reference Funk and Omland2003) recognized five sources of mtDNA failure in detecting species boundaries: gene paralogy, imperfect taxonomy, inadequate genetic information, incomplete lineage sorting, and introgressive hybridization. Conflitti et al. (Reference Conflitti, Kratochvil, Spironello, Shields and Currie2010) thoroughly evaluated these factors in relation to the S. arcticum species complex and each process will be mentioned only briefly here.
The presence of undetected paralogous gene sequences is not likely the cause of sibling species non-monophyly. No insertions, deletions, or stop codons were encountered in our dataset indicating that all sequences constitute functional mitochondrial products (Funk and Omland Reference Funk and Omland2003). However, lack of COI divergence may indicate that the majority of S. arcticum complex members represent a single randomly breeding species. Although experimental mating crosses provide the most direct method of establishing reproductive status, difficulties in rearing black flies in a laboratory setting generally preclude these types of studies (i.e., black flies typically require fast flowing water during larval and pupal stages, as well as blood meals and mating swarms for adults). Instead, evidence for isolation among black fly sibling species is provided by cytogenetic analysis of natural populations. In general, reproductively isolated cytospecies maintain their unique chromosomal rearrangements in sympatry with other closely related taxa (Rothfels Reference Rothfels1989; Adler et al. Reference Adler, Cheke and Post2010). Specifically, the distribution of chromosomal variation is in Hardy–Weinberg disequilibrium between isolated populations. In this way, cytogenetic studies provide significant evidence of reproductive status. Simulium arcticum sibling species differ considerably in their cytological features, most having distinct sex-linked chromosomal rearrangements. Sex chromosomes in the complex range from undifferentiated (S. brevicercum) to containing inversions that are either X-linked in females (S. saxosum) or Y-linked in males (S. apricarium, S. arcticum s.s., and S. negativum; Adler et al. Reference Adler, Currie and Wood2004). Moreover, cytogenetic studies have shown that sympatric S. arcticum sibling species maintain their unique sex-linked and autosomal inversions (Shields and Procunier Reference Shields and Procunier1982; Adler et al. Reference Adler, Currie and Wood2004; Shields et al. Reference Shields, Pickens, Clausen and Strizich2007b). Other lines of evidence, such as geographic distribution and ecology, further support species status of S. arcticum taxa (Shields and Procunier Reference Shields and Procunier1982; Adler et al. Reference Adler, Currie and Wood2004; Shields et al. Reference Shields, Clausen, Marchion, Michel, Styren and Riggin2007a, Reference Shields, Pickens, Clausen and Strizich2007b). Finally, all S. arcticum individuals analysed by us were cytologically verified ruling out the possibility of incorrect identification of morphologically indistinguishable taxa. Overall, imperfect taxonomy is unlikely for the sibling species we analysed. Therefore, although DNA barcoding failed to distinguish most taxa in the S. arcticum complex, it is premature to modify current (2012) taxonomy based solely on one short gene fragment.
Another explanation for lack of reciprocal monophyly is inadequate genetic information. Single gene analyses may not provide sufficient variation to resolve recently diverged taxa (Moritz and Cicero Reference Moritz and Cicero2004). The weak support for the majority of bifurcations within the S. arcticum complex in our NJ tree (BSS < 50%; Fig. 1) supports this view. Incomplete lineage sorting may also be responsible for shared haplotypes among, and lack of reciprocal monophyly between, S. arcticum sibling species. Establishment of reciprocal monophyly is a function of time since isolation. During early stages of divergence, when lineage sorting is incomplete, ancestral polymorphisms are shared between species (Funk and Omland Reference Funk and Omland2003). This appears to be the case for members of the S. arcticum complex. Most notably, haplotype γ (Fig. 2) was shared between sibling species sampled from distant geographic regions (S. arcticum s.s. from Coeur d'Alene River, Idaho and Clearwater River and Little Prickly Pear Creek, Montana; S. brevicercum from Little Blackfoot River, Montana; and S. saxosum from Coeur d'Alene River, Idaho). Another possible example of shared ancestral polymorphism is identical COI sequences among S. arcticum s.s. and S. saxosum from Clearwater River, Montana, and Cle Elum River, Washington, respectively (haplotype α, Fig. 2). Both cases suggest that lineage sorting is incomplete in the S. arcticum complex. Given that adult black flies can travel long distances (e.g., S. vampirum Adler et al., a member of the S. arcticum complex; Fredeen Reference Fredeen1969; Charnetski and Haufe Reference Charnetski and Haufe1981), it may also suggest that gene flow is occurring between sibling species. Members of black fly species complexes have been known to hybridize naturally and under experimental conditions (reviewed in Adler et al. Reference Adler, Cheke and Post2010). Recurrent hybridization could account for the patterns we observed. Gene flow among multiple species can strongly affect mitochondrial tree topologies, making it difficult to infer routes of genetic exchange between species (Funk and Omland Reference Funk and Omland2003). However, hybridization often can be detected when individuals possess haplotypes of sympatric lineages (Funk and Omland Reference Funk and Omland2003). A possible example involves S. arcticum s.s. and S. saxosum from Coeur d'Alene River, Idaho (haplotype β, Fig. 2). Future studies based on microsatellite data can test whether ongoing gene flow is occurring at this locality.
Lack of species-specific genetic variation is not unique to the S. arcticum complex. In general, diagnostic molecular variation is difficult to obtain for black fly sibling species originally discovered through cytotaxonomy (reviewed in Adler et al. Reference Adler, Cheke and Post2010). Limited success in finding sibling species-specific genetic differences contrasts with the scenario for black fly morphospecies: morphologically defined black fly species are typically represented by a single cluster of closely related DNA sequences, distinct from those of all other species. As in other studies, the morphospecies we analysed (i.e., outgroup species S. decimatum and S. murmanum) were each monophyletic and strongly supported (Fig. 1). With this in mind, the genetic cohesion of individuals representing S. negativum can be explained. Simulium negativum was strongly supported in the tree (Fig. 1) and distinct from the main haplotype network (Fig. 2), indicating that this species diverged relatively early from the remaining members of the complex. This early split is consistent with morphological and cytological evidence (Shields and Procunier Reference Shields and Procunier1982; Adler et al. Reference Adler, Currie and Wood2004). Simulium negativum is among the only S. arcticum taxa to have accumulated morphological differences. Although S. negativum adults and pupae are not easily distinguished from other sibling species, larvae can usually be recognized by the negative head-spot pattern on females, as well as by the unpigmented suboesophageal ganglion in both sexes (Adler et al. Reference Adler, Currie and Wood2004). Cytogenetically, S. negativum differs from other members of the complex in that male sex determination is based on the IL, rather than the IIL chromosome arm (Shields and Procunier Reference Shields and Procunier1982). Alternatively, monophyly of S. negativum relative to other S. arcticum taxa may be an artefact of sample size (only two individuals were analysed). More extensive sampling will be required to test monophyly of this sibling species adequately.
Our results support the view that eastern and western populations of S. murmanum represent separate species (Adler et al. Reference Adler, Currie and Wood2004). We observed a marked (4.62%) divergence between eastern (Algonquin Park, Ontario) and western (Duck Mountain Park, Manitoba) populations of S. murmanum (Fig. 1). This pattern was also observed by Rivera and Currie (Reference Rivera and Currie2009), based on a larger sample size (n = 15) than ours, and by Adler et al. (Reference Adler, Currie and Wood2004), based on chromosomal differences between eastern (Labrador, Quebec, Ontario) and western (Alaska, Yukon, Alberta) populations. Possibly Simulium corbis Twinn, currently (2012) considered a junior synonym of S. murmanum, will be revalidated and applied to the eastern population.
Outgroup taxa of the S. noelleri group (S. decorum and S. noelleri) are morphologically indistinguishable but were recognized with significant support by barcoding (Fig. 1). Similar to members of the S. arcticum complex, identification of S. decorum and S. noelleri relies on chromosomal data (Adler et al. Reference Adler, Currie and Wood2004). In contrast, however, evidence suggests that lineage sorting is complete and hybridization limited between these species. Differences in speciation rate and geographic separation could be responsible for reciprocal monophyly among S. noelleri and S. decorum, and the lack of it between species of the S. arcticum complex. The S. noelleri species group consists of nine nominal species distributed throughout the Holarctic Region. However, only two species, S. decorum and S. noelleri, are currently recognized within the Nearctic Region (Adler et al. Reference Adler, Currie and Wood2004). In contrast, the highly diverse S. arcticum complex is restricted to North America, with most of its members localized to the Rocky Mountains of Montana (Adler et al. Reference Adler, Currie and Wood2004; Shields et al. Reference Shields, Clausen, Marchion, Michel, Styren and Riggin2007a, Reference Shields, Pickens, Clausen and Strizich2007b, Reference Shields, Christiaens, Van Leuven and Hartman2009). We speculate that most members of the complex diverged recently, as a result of isolation in inter-mountain valleys caused by mountain glaciers south of the continental ice sheets during the Wisconsinan glacial maximum. Subsequent rapid radiation of S. arcticum sibling species over a relatively short geological time span would likely result in iterative episodes of reproductive isolation before complete sorting of ancestral polymorphisms.
Wisconsinan-aged glacial cycles may also explain the origin of the sister-pair S. noelleri and S. decorum. Simulium noelleri was probably restricted to Beringia (central Alaska and Yukon) during the glacial maximum, whereas S. decorum probably survived south of the continental ice sheet (Currie Reference Currie1997). This assumption is supported by the present-day distribution of the two species in the Nearctic Region: S. noelleri at high latitudes from Alaska to Hudson Bay, S. decorum from coast-to-coast as far south as Florida, with sympatry occurring only in northwestern North America (Alaska, Yukon, Northwest Territories). The larger geographic separation and slower speciation rate relative to members of the S. arcticum complex perhaps explains why lineage sorting is complete between S. noelleri and S. decorum.
Mechanisms that limit hybridization between sympatric S. noelleri and S. decorum would also promote reciprocal monophyly. One possibility is that differences in mating behaviour prevent gene flow between S. noelleri and S. decorum. Mating among S. decorum individuals takes place in ground-level aggregations at emergence and oviposition sites (Davies and Peterson Reference Davies and Peterson1956). Although S. noelleri mating is unreported, small groups of males, possibly representing mating swarms, have been observed hovering under trees (Edwards Reference Edwards1920). In contrast, mating behaviour evidently does not differ among members of the S. arcticum complex and ample opportunity for hybridization exists, especially in Montana where many S. arcticum sibling species have overlapping distributions.
Our study supports the view that COI barcodes effectively discriminate among black fly morphospecies (Rivera and Currie Reference Rivera and Currie2009). We also have demonstrated that barcoding can be useful for diagnosing cryptic black fly species. However, COI's ability to recognize morphologically indistinguishable taxa depends on the history of the species being considered. In particular, DNA barcoding could not differentiate members of a recent lineage radiation. However, barcoding can flag exceptional species assemblages, such as the S. arcticum complex, that are worthy of further study. In cases where species boundaries are blurred by incomplete lineage sorting and/or introgressive hybridization, supplemental analyses of rapidly evolving nuclear (microsatellites and introns) and mitochondrial (control region) loci will be required. As recommended by Ilmonen et al. (Reference Ilmonen, Adler, Malmqvist and Cywinska2009) and Adler and Huang (Reference Adler and Huang2011), an integrated approach incorporating multiple sources of evidence (i.e., morphology, ecology, cytology, and multi-locus molecular datasets) will be crucial for understanding recent radiations of black flies.
Acknowledgements
The Manual of Nearctic Diptera is arguably the most important contribution to the systematics and taxonomy of flies during the 20th century. The coordinators of the Manual (Frank McAlpine, Bob Peterson, Guy Shewell, Herb Teskey, Dick Vockeroth, and Monty Wood), together with some of the most influential dipterologists of the time, established a foundation that stimulated and accelerated subsequent research on the Diptera. We are particularly indebted to Monty Wood, whose outstanding contributions to the study of black flies continue to inspire new generations of “simuliidologists”. This research was supported, in part, through funding to the Canadian Barcode of Life Network from Genome Canada (through the Ontario Genomics Institute), Natural Sciences and Engineering Research Council of Canada (NSERC), and other sponsors listed at www.BOLNET.ca. Additional funding was provided by an NSERC Discovery Grant to DCC, an NSERC Canada Graduate Scholarship to IMC, and grants from the M.J. Murdock Charitable Trust (#2003196 and #2005233) to GFS. Laboratory costs at the Royal Ontario Museum were supported, in part, from an NSERC Discovery Grant to Robert W. Murphy. Comments from Peter H. Adler greatly improved an earlier version of this manuscript. We thank D.C. Winter for assistance with Microsoft Excel scripts and Jean-Marc Moncalvo for providing the French translation of the abstract.