Scholars agree that civilian populations that are more prepared for emergencies also react better in the face of one, and are therefore less vulnerable to their adverse effects.Reference Hemond and Robert 1 , Reference Peek and Mileti 2 Nonetheless, despite wide agreement concerning the importance of household preparedness for emergencies, a growing number of publications indicate low levels of households’ preparedness for emergencies.Reference Bodas, Siman-Tov, Kreitler and Peleg 3 Household adjustment levels reported in the literature usually range between 17%Reference Eisenman, Wold, Fielding and Long 4 and 48%.Reference Page, Rubin and Amlôt 5 In some cases, even lower levels were indicated.Reference Kapucu 6 Presumably, the gap remaining between desired and actual levels of preparedness indicate that we have yet to fully understand the socio-psychological perspective underlying this behavior.Reference Peek and Mileti 2 , Reference Paton 7
Understanding the socio-psychological perspective of preparedness behavior proves to be even more challenging when examined in the context of the threat of armed conflicts in Israel. In 2013, a study conducted in a nation-wide sample concluded that more than 50% of the Israeli population has complied with less than half of the civil defense recommendations for household adjustment to armed conflicts.Reference Bodas, Siman-Tov, Kreitler and Peleg 3 More interestingly, almost no correlation was found between preparedness behavior and reported correlates in the literature, such as perception of likelihood or perception of severity of the threat. The authors concluded that this finding suggests that the socio-psychological perspective of preparedness behavior toward armed conflicts in Israel is different from that reported for other populations.Reference Bodas, Siman-Tov, Kreitler and Peleg 8
This and other studies performed during the past decade in IsraelReference Kirschenbaum 9 , Reference Soffer, Goldberg and Adini 10 paint a complex behavioral model. This model is qualitatively different from classical behavioral models such as the Health Belief ModelReference Becker 11 or even the preparedness model suggested by Paton et al.Reference Paton 7 , Reference Paton, Smith and Johnston 12 These utilitarian models propose that preparedness behavior is the product of a process of weighing benefits and barriers, focused on perceived threat and efficacy of behavior, and amended by a host of demographic, situational, and personality variables.Reference Kreitler 13 However, these seemingly general rules do not appear to apply to the Israeli public in the context of preparedness for armed conflicts.
These findings led us to suggest that the threat perception of and preparedness patterns for armed conflicts in Israel resemble those of victimized populations, ie populations who are chronically exposed to a given threat, as suggested by Rüstemli and Karanci,Reference Rüstemli and Karanci 14 (p99) “protective behavior in victimized populations is determined essentially by fear and belief in personal control rather than severity of prior experience and cognition related to the perceived severity and occurrence of future hazards.” This description of victimization in the context of preparedness behavior seems to be appropriate for the findings concerning the Israeli preparedness behavior toward armed conflicts.
Viewing the Israeli threat perception and preparedness patterns as those of a victimized population is supported by previous research. For example, Bodas et alReference Bodas, Siman-Tov, Kreitler and Peleg 8 report that while Israelis tend to underestimate the likelihood of imminent war, they also anticipate the next war to have severe outcomes at the personal and national levels. Perceiving severe outcomes of a looming war was more prominent among residents who were younger, native-born, and from regions of previous conflicts. The latter two represent people enduring the threat of armed conflicts for extended periods of time; in other words, those who were “chronically exposed” to the threat.Reference Bodas, Siman-Tov, Kreitler and Peleg 8 An additional example is provided in the study by Bodas et alReference Bodas, Siman-Tov, Kreitler and Peleg 3 : previous experience with the threat of rockets was not found to be significantly correlated with preparedness in the general population, rather only in residents of the north and south of Israel who endured the threat first-hand and more often. Residents of the central regions, who were not subjected to actual rocket fire back in 2013, were still exposed to the threat, at least through media coverage, but did not translate this exposure into actual behavior. This finding suggests, in contrast with classical behavioral models, that previous experience with the threat of armed conflict in Israel is capable of generating behavioral change, ie preparedness, only when the threat becomes real and imminent or if the individual had been exposed first-hand.Reference Bodas, Siman-Tov, Kreitler and Peleg 3
Bodas et alReference Bodas, Siman-Tov, Kreitler and Peleg 8 suggest that the Israeli public demonstrate what can be considered a desensitization effect to the threat of armed conflicts. The authors conclude that the specific characteristics of a victimized population with regard to preparedness for armed conflicts, as manifested in the Israeli population, are as follows: (a) distorted perception of the threat, eg decreased perception of likelihood coupled with increased perception of severity, (b) reduced threat intrusiveness despite (or perhaps due to) chronic exposure to the threat, and (c) prevalence of denial-based coping mechanisms, delay in preparedness behavior, and a habituation effect to the threat.Reference Bodas, Siman-Tov, Kreitler and Peleg 3 , Reference Bodas, Siman-Tov, Kreitler and Peleg 8 Other researchers reported similar notions concerning another chronic threat in Israel—terrorism.Reference Hobfoll, Palmieri, Johnson, Canetti-Nisim, Hall and Galea 15 - Reference Waxman 19
Arguably, victimization seems to play a role in shaping preparedness behavior toward armed conflicts in Israel. However, we should consider alternative explanations for delaying preparedness behavior, which are suggested in the literature.Reference Levac, Toal-Sullivan and O’Sullivan 20 For instance, in a study carried out in Canada about a decade ago, researchers found that time constraints, limited information, and lacking financial resources were reported by members of the public as barriers to preparedness behavior.Reference Falkiner 21 Other preparedness-delaying factors reported in the literature include lack of time and resources to establish and maintain emergency supplies,Reference Falkiner 21 - Reference Olympia, Rivera, Heverley, Anyanwu and Gregorits 26 gaps in comprehension of guidance from preparedness authorities,Reference Blessman, Skupski and Jamil 23 - Reference Eisenman, Glik, Maranon, Gonzales and Asch 25 , Reference Chesser, Ablah and Hawley 27 , Reference Marshall, Petrone and Takach 28 limited information on the threat or the means available to prepare for it,Reference Falkiner 21 , Reference Olympia, Rivera, Heverley, Anyanwu and Gregorits 26 mistrust in authorities,Reference Kohn, Eaton, Feroz, Bainbridge, Hoolachan and Barnett 29 disregarding preparedness instructions, belief that no personal harm will be caused, doubt in the effectiveness of preparedness, and dissociation or fear.Reference Olympia, Rivera, Heverley, Anyanwu and Gregorits 26
The purpose of this study was to explore which factors play a more dominant role in promotion and inhibition of preparedness behavior in Israel—the ones associated with victimization or the alternative explanations provided by the literature. It is hypothesized that victimization plays a prominent role in delaying preparedness behavior toward armed conflicts in Israel. In order to support the hypothesis we would need to demonstrate that indifference, denial, desensitization, and fear, rather than limited time or resources, misunderstanding of instructions, etc, are the leading causes for delaying preparedness behavior.
METHODS
Sampling and Data Collection
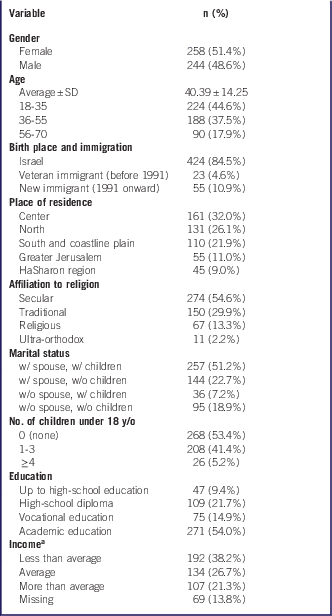
A randomized, Internet-based survey was performed during November 2015. The survey was administered via the iPanel Internet panel with a 31% response rate. The sample included 502 participants representing the adult Jewish population of the entire state of Israel. The full demographic distributions of the studied sample are presented in Table 1.
Socio-Demographic Distribution of Studied Sample (N=502)

Abbreviations: w/, with; w/o, without; y/o, years old.
a Compared with the average household income of ~3800 USD.
The choice of using an online survey was made in light of the multitude of statements included in the questionnaire, which are easier to administer in writing. The Internet panel “iPanel” provided the best solution for this problem, given its pool of over 130,000 users and its ability to effectively address a representative sample of the adult Jewish population of Israel. iPanel began its activity in 2006, and since then has been providing an online platform for a wide variety of information-collection services, polls, and public-opinion surveys. iPanel adheres to the stringent standards of the world association for market, social, and opinion researchers (ESOMAR). In addition, the iPanel was evaluated by the Applied Statistical Laboratory of the Hebrew University in Jerusalem and was found to be highly accurate in assessing Internet-based samples of the adult Jewish population in Israel.Reference Nirel 30
Analytical Procedure and Tools
Assessment of Preparedness
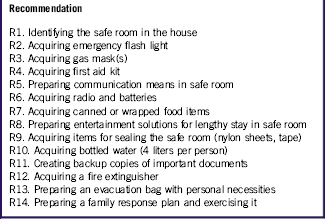
Household preparedness for armed conflicts was assessed using the Preparedness Index (PI) Scale (Cronbach’s α: 0.745). This tool was validated in previous studies.Reference Bodas, Siman-Tov, Kreitler and Peleg 3 , Reference Bodas, Siman-Tov, Kreitler and Peleg 8 The PI scale indicates the number of preparedness actions reported by a participant as complied-with out of a list of 14 preparedness actions for armed conflicts recommended by the civil defense authorities. The action items are provided in Box 1. The PI scale ranges from 0 to 14, with a higher figure indicating a higher level of reported household preparedness for armed conflicts. All items on the scale are scored equally, because there is no indication by the civil defense authorities as to which are more effective, relevant, or important (source: Home Front Command leafletFootnote a ).
List of Action Items Recommended by the Israeli Civil Defense Authority for Household Adjustment to Armed Conflicts (in the Order of Appearance in the Questionnaire)

Preparedness-Affecting Factors
For the purpose of this study, 2 lists of preparedness-affecting factors were generated—one for preparedness delaying and another for preparedness promoting. The items included in each list were generated and approved by 24 Israeli experts with over 10 years of experience in the fields of emergency management and/or public health in a 3-round e-Delphi process. The expert-panel evaluation was included as a preliminary step specifically for this study. The final lists included 11 preparedness-delaying factors and 8 preparedness-promoting factors (see items in Tables 2 and 4). The Cronbach α for the preparedness-delaying and -promoting factor lists were 0.816 and 0.780, respectively.
Ranking of preparedness-delaying factors was performed by both experts and the sample population. Each expert ranked the factors in descending order. A weight score (W) was assigned for each place in the ranking order (last position had a weight score of 1, second to last 2, etc.) An overall ranking score for each factor was calculated by multiplying the number of experts at each ranking level (X) with the associated weight rank score (W) and divided by the total number of experts (N):
 $${\rm Factor }\,{\rm score}{\,\equals\,}{{X_{1} W_{1} {\plus}X_{2} W_{2} {\plus}X_{3} W_{3} {\plus}\,\ldots\,{\plus}X_{n} W_{n} } \over N}$$
Ranking of the preparedness-delaying factors by the participants in the online survey was carried out by asking them to assess the level of influence of these factors on their preparedness behavior. Preparedness-delaying factors were presented to the participants on a 7-point Likert scale (with 1 being “does not influence at all my preparedness behavior” and 7 being “greatly influences my preparedness behavior”). The scale was chosen in anticipation of a tendency to choose the middle-scale option, so that public perceptions and attitudes could be better assessed using a more sensitive scale. The average score for each factor was used as the overall score for ranking.
Reaction to the list of preparedness-promoting factors was assessed using a 3-point scale (1—“will decrease my motivation,” 2—“will neither increase nor decrease my motivation,” and 3—“will increase my motivation”). The scale was chosen to allow participants to express a clear-cut assessment of whether or not a specific item was capable of motivating their preparedness behavior. Acknowledging the fact that reported intention is not necessarily an indicator for dispositional motivation or actual behavior,Reference Kreitler 13 this tool allowed us some insight into the perception of preparedness motivation, rather than describing actual motivators.
In order to assess the overall impact of these preparedness-affecting factors on a given participant, 2 indices were generated as the sum of answers for each list. The “Inhibition Index” for the preparedness-delaying factors ranged from 11 to 77, with a higher figure indicating more factors influencing a participant to delay preparedness behavior. The “Promotion Index” for preparedness-promoting factors ranged from 3 to 24, with a higher figure indicating a more positive perception of the factors as possible motivators to engage in preparedness behavior. In addition, participants were prompted to suggest additional reasons influencing their preparedness behavior in the form of an open-text question. Responses were categorized according to their content.
Statistical Analysis
Statistical analysis of the results was performed using SPSS version 23. The analysis included both descriptive and analytical methods. Before analysis, indices were generated and their reliability was assessed using Cronbach’s α. Statistical tests were chosen according to variable distribution. Comparison of the means of 2 or more groups was carried out using independent samples and paired-sample t-tests or the 1-way analysis of variance (ANOVA) test with Bonferroni multiple-comparison correction, respectively. Spearman’s correlation test was used to examine correlations between continuous variables. In addition, a multivariant linear regression analysis was used to predict the dependent variable (PI). Regression analysis was performed in stepwise mode with 2 blocks such that the first block included demographic variables (age—continuous; gender—2 categories) and the second block included attitude components (continuous). Only variables that were found to be associated with the PI in the univariate tests were introduced into the regression analysis following negation of multiple colinearity (minimum threshold for variance inflation factor (VIF)=2.70). Kandell’s τ test was used to assess the similarity of the ranking of the preparedness-delaying list generated by the experts with that of the studied sample. Radar charts for depiction of multivariate observations regarding the preparedness-delaying factors were generated using Microsoft® Excel® 2013. In all statistical analyses performed, a P-value of 0.05 or less was considered statistically significant.
RESULTS
The results of the PI scale indicate a mean of 6.173 (±3.018 SD) actions reported as complied-with per participant. The scale is not normally distributed according to the Shapiro-Wilk test (W=0.973, P<0.001), and has a slightly positive skew of 0.363 (±0.109 SE).
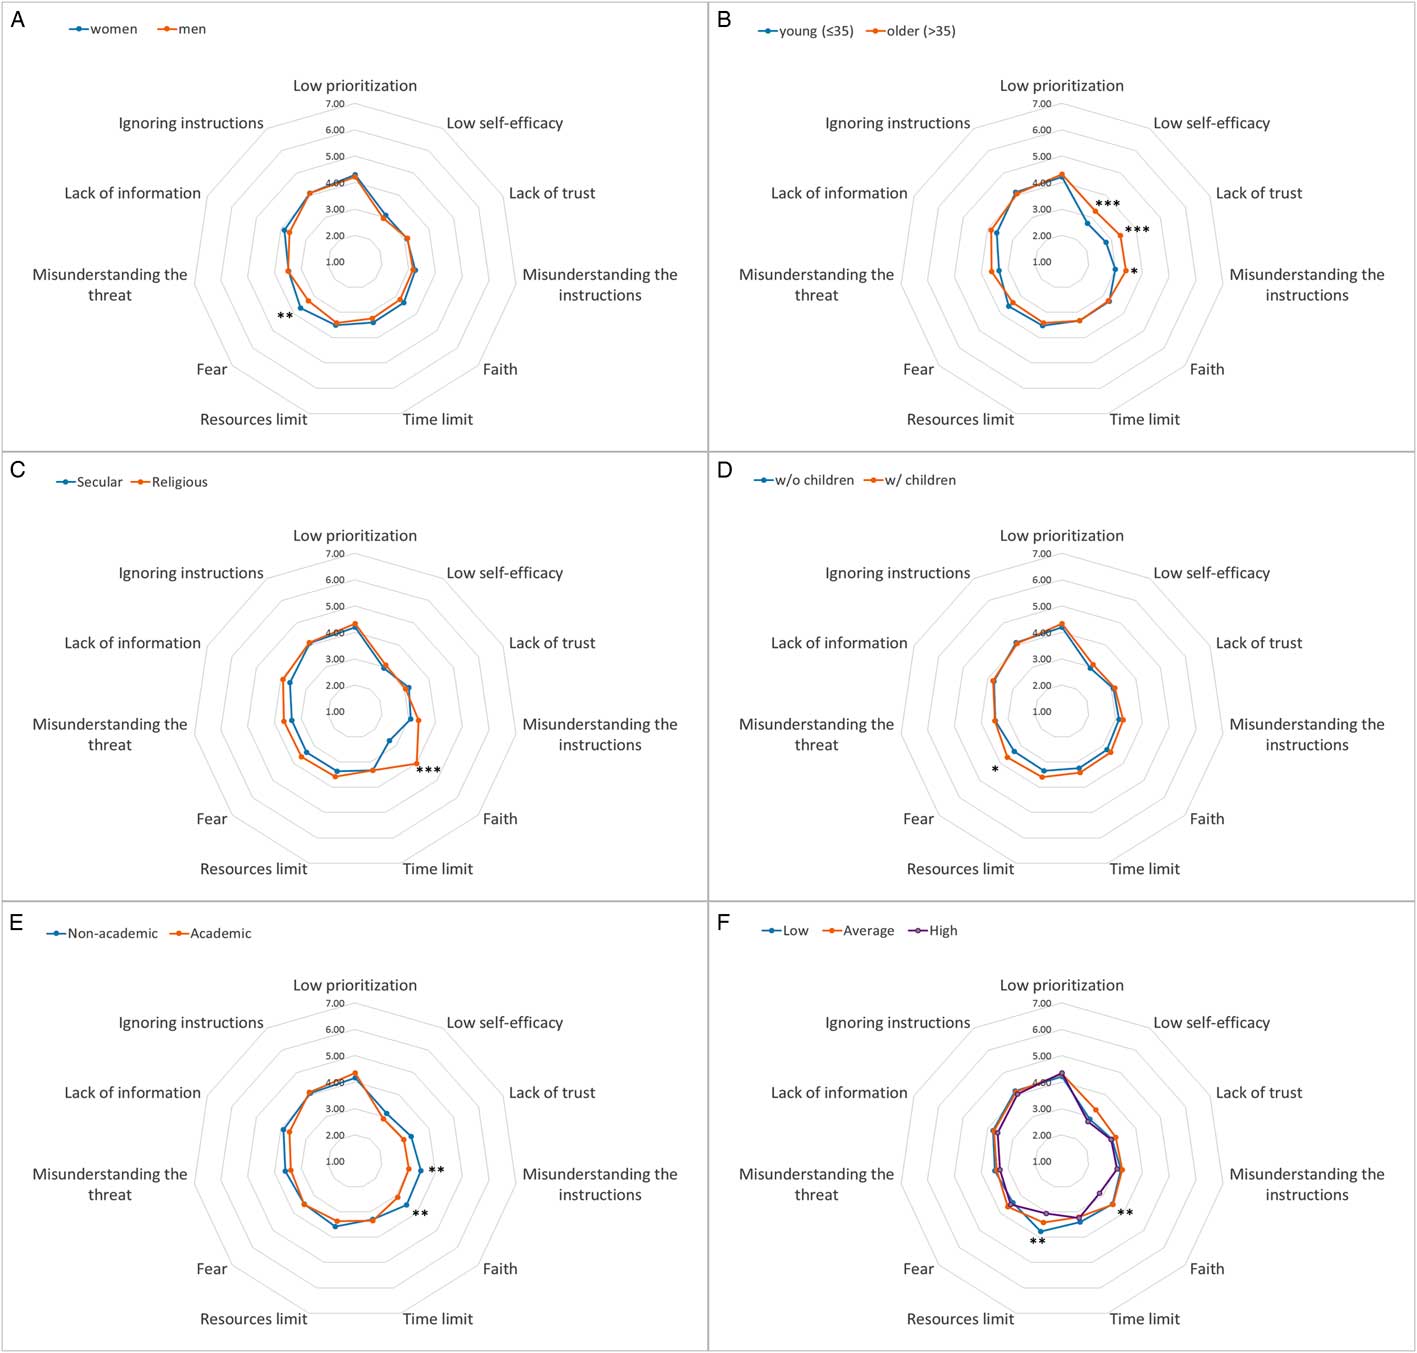
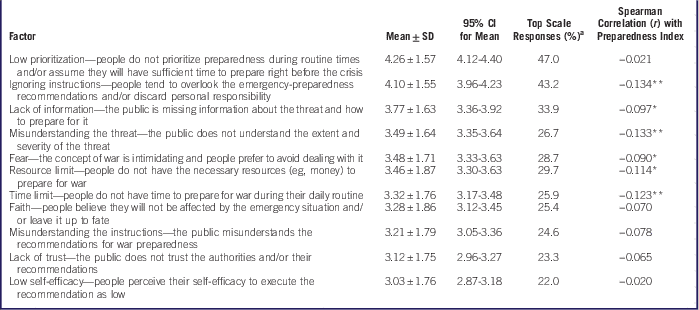
Participants were presented with a list of 11 preparedness-delaying factors that were generated by an expert panel. Table 2 summarizes the appraisal results of these factors. Figure 1 provides a demographic breakdown of the mean scores. The results suggest that women report a higher influence of fear over their preparedness behavior compared with men, according to the independent samples t-test (t=2.60, df=500, P=0.01). Participants over the age of 35 years report a higher influence for low self-efficacy, lack of trust in authorities, and misunderstanding the civil defense instructions, compared with younger participants (t=3.466, df=500, P=0.001; t=3.793, df=490.38, P<0.001; and t=2.497, df=500, P=0.013, respectively). In addition, the result indicates that the tendency to believe no personal harm will be caused or “leaving it up to fate” has greater influence over religious rather than secular participants (t=8.497, df=500, P<0.001), non-academic rather than academic-degree-holding participants (t=2.671, df=500, P=0.008), and low- to average-income-earning rather than high-income-earning participants (t=4.704, df=432, P=0.01).
Radar charts depicting mean scores of influence over individual preparedness for each preparedness delaying factor according to demographic categorization (N=502, unless indicated otherwise). (A) Gender, (B) age, (C) affiliation to religion, (D) children, (E) education, (F) income (n=433).Statistically significant differences are marked with asterisk(s). *P≤0.05 **P≤0.01 ***P≤0.001

Preparedness-delaying factors—descriptive statistics and correlation with Preparedness Index (N=502)

a Top 3 options on a 7-point Likert scale (5, 6, and 7).
*Significant at the 0.05 level (2-tailed) (non-significant in multiple comparison analysis).
**Significant at the 0.01 level (2-tailed).
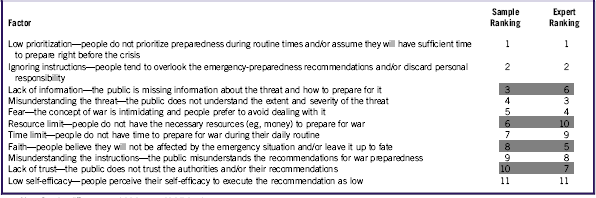
Table 3 compares the ranking of the preparedness-delaying factors by the studied sample with that of the expert panel. According to Kandell’s τ test, the rankings are statistically similar (Kandell’s τ=0.600, P=0.01).
Side-by-Side Ranking ComparisonFootnote a of Preparedness-Delaying Factors by the Experts Panel and Studied Sample

Note: 3-point difference and higher are highlighted.
a Rank correlation coefficient (Kandell’s τ): 0.600 (P=0.01).
An Inhibition Index was generated to indicate the extent to which the proposed factors were influencing a participant to delay preparedness behavior. Spearman’s analysis shows that this index was negatively correlated with the PI (r=−0.136, P<0.01).
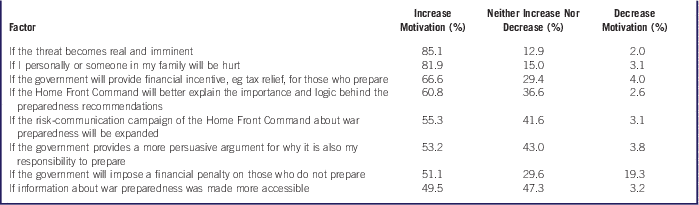
Participants were also asked to assess the motivational capacity of 8 preparedness-promoting factors. Table 4 summarizes the results of this analysis. The results indicate that the majority of the sample population believes that all suggested factors are potential motivators for preparedness behavior. One exception is the financial penalty suggested to be imposed on those who do not prepare for armed conflicts, to which 19% of participants responded that it will decrease their motivation to prepare for armed conflicts. No significant correlation (r=0.080, P=0.074) was observed between the PI and the “Promotion Index” generated to indicate the extent to which a participant holds a more positive perception of the factors as possible motivators of preparedness behavior.
Reported Effect of Preparedness-Promoting Factors on Preparedness Motivation Among OpinionatedFootnote a Subjects

a Maximum missing per item: 10.8%.
In addition, participants were prompted to suggest (in free-text) additional factors that could influence their preparedness behavior. Of the 502 participants totally included in the sample, 105 (20.9%) provided a relevant answer to this question. Most answers resonated reasons already proposed in the preparedness-affecting factor lists. The answers were analyzed and categorized into 4 themes: (a) preparedness will take place only when the threat becomes real and imminent (28.6% of answers); (b) the government needs to invest in better risk communication and persuasion in order to promote public readiness (25.7%); (c) the government needs to assist, subsidize, and make preparedness more accessible to the public (15.2%); and (d) lack of confidence in the authorities is negatively influencing preparedness behavior (9.5%). Other answers accounted for the remaining 21.0%.
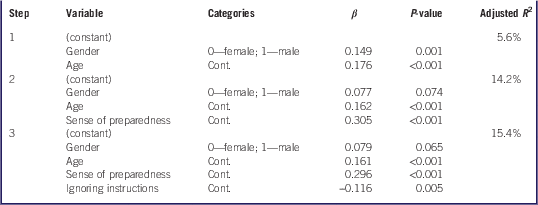
In order to predict the number of recommendations an individual will comply with (PI), a multivariant linear regression analysis was performed. The regression included the following variables: gender, age, sense of preparedness, and the 3 preparedness-delaying factors associated with the PI: ignoring instruction, misunderstanding the threat, and time limit. Table 5 shows the results of the regression analysis. The regression model was found to account for 15.4% of the variability in the PI. The predominant variable in predicting the number of recommendations an individual will comply with was sense of preparedness (β=0.296). Age is also a predictor of preparedness behavior (β=0.161). Of the 3 preparedness-delaying factors, the only 1 predictive of the PI is ignoring instructions (β=−0.116).
Results by Step of Linear Regression Analysis to Predict Preparedness Behavior (Preparedness Index)

Abbreviation: Cont., continuous.
Regression analysis performed in stepwise mode with 2 blocks. First block—gender, age; second block—sense of preparedness and 3 preparedness-delaying factors: ignoring instruction, misunderstanding the threat, and time limit.
DISCUSSION
The results of this study suggest that there is merit to our hypothesis that victimization might play an important role in shaping preparedness behavior toward armed conflicts among Jews in Israel. The results suggest that ignoring and low prioritization of civil defense instructions are leading causes for non-compliance with the recommendation to engage in preparedness behavior. Ignoring preparedness instructions during routine times is also a negative predictor of reported preparedness (PI) according to the multivariate analysis. In addition, misunderstanding the threat and fearing it also seem to play an important part. In contrast, there is wide agreement between both experts and the public that limited time or resources, misunderstanding instruction, lack of trust in authorities, and low self-efficacy are not perceived as major obstacles to preparedness behavior.
The results of this study shed light on the findings reported in the literature concerning the threat perception of armed conflicts by Israelis, in particular the lack of association between preparedness and the threat-perception component reported by Bodas et al.Reference Bodas, Siman-Tov, Kreitler and Peleg 8 The findings of this study suggest that delaying preparedness behavior toward armed conflicts in Israel is a conscious decision, rather than a result of unawareness. This is highlighted in the demographic breakdown of the results (Figure 1). Little to no difference in the mean scores of the different preparedness-delaying factors was observed between the demographic categories. The spider charts provide a visual cue to support the view of preparedness delaying as a widespread phenomenon across the Jewish population of Israel, regardless of the socio-demographic background.
Further, data obtained from the open-text question demonstrate the high percentage (~30%) of participants who made a conscious decision to postpone preparedness behavior until the threat became real and imminent, ie when it was potentially too late.
What about promoting preparedness? This study suggests that the leading preparedness-promoting factors are “if the threat becomes real and imminent” and “if I personally or someone in my family will be hurt.” These 2 factors were endorsed by more than 80% of participants as potential motivators for engaging in preparedness behavior. Needless to say, both factors are “less-than-perfect” motivators, because they emerge when it is potentially too late. Getting prepared when the threat is real and imminent or after being physically or emotionally hurt will likely prove futile. The overwhelming endorsement of these factors as leading preparedness promoters can indicate how well rooted the preparedness-delaying attitude is among Israeli Jews.
Moreover, we found a negative correlation between the “Inhibition Index” and reported preparedness. The “Inhibition Index” is indicative of the overall tendency of a participant to delay preparedness behavior. In other words, we found that the more influence assigned by a participant to the preparedness-delaying factors, the less he or she reports being prepared for armed conflicts. The negative correlation between these 2 scales is another indication of the conscious decision to postpone preparedness.
In contrast, we did not find a significant opposite (positive) correlation between the “Promotion Index” and reported preparedness. The “Promotion Index” is indicative of a positive perception of suggested preparedness-promoting factors as possible motivators to engage in preparedness behavior. The lack of correlation between these 2 constructs might suggest that while Israeli Jews have made up their minds in delaying preparedness behavior, they have yet to develop effective responsiveness to preparedness motivators. Alternatively, this finding suggests that preparedness motivators need to overcome several socio-psychological barriers before they can transform into actual intentions and lead to behavioral change. If that is in fact the case, then Israeli policy-makers are faced with a difficult playground when considering options for engaging the Israeli public in preparedness behavior. Out-of-the-box solutions are required to promote readiness and increase public resilience toward armed conflicts.
Research Limitations
This study has some important limitations. First, the need to administer the questionnaire in a written manner to a nation-wide audience necessitates the use of an online panel. The choices for online panels in Israel are limited if one wishes to maintain a high standard of research. The iPanel was the most suitable choice for this survey; however, it is limited in reaching a representative cohort of Arab citizens. As a result, the conclusions made in this study are limited to the adult Jewish population in Israel and cannot be further generalized. Second, when assessing the motivational effects of the preparedness-affecting factors, we used the invalidated term “influence.” As influence can go in either direction (promoting or delaying), perhaps a more definitive terminology was required. Nonetheless, given the overall framing of each set of questions for either delaying or promoting effects, it is reasonable to assume that questions were understood as intended. Finally, the current survey did not record the previous experience of participants. Although this information could have been useful in statistical analysis, it is also reasonable to assume that following the Second Lebanon War (2006) and the 3 Gaza operations (2009, 2012, and 2014), this variable probably has a relatively small variance.
CONCLUSIONS
The findings described in this paper demonstrate that indifference, denial, desensitization, and fear are among the leading causes for delaying preparedness behavior toward armed conflicts in Israel, at least in the Jewish population. They support the view of the Israeli preparedness behavior toward armed conflicts as that of a victimized population, ie a population chronically exposed to the threat, and illustrate the complexity of the socio-psychological perspective of preparedness behavior. Postponing preparedness behavior to the very last minute might seem irrational, but in the context of ongoing, chronic exposure to the threat it seems to be logical. However, this is highly counterproductive to the efforts to promote public resilience to such scenarios. Therefore, it is imperative to explore means to overcome public indifference and enhance preparedness behavior toward emergencies. Out-of-the-box thinking is required if we aspire to get the public engaged in preparedness behavior. The sooner, the better.
Acknowledgments
This study was carried out in partial fulfillment of the requirements for a PhD degree by MB at the Sackler Faculty of Medicine, Tel-Aviv University, Israel. The authors acknowledge the financial support from the Department of Disaster Medicine at the School of Public Health, Sackler Faculty of Medicine, Tel-Aviv University.