

Introduction
What we usually think of as “retirement” is accompanied by a cessation, or at least a major reduction, of income from employment. That may be offset, in part, by increased income from other sources. The question that concerned us is the extent to which retirees are able to maintain their pre-retirement income levels, whether through access to pensions, investment returns, or even continued (but reduced) employment.
Our concern here is with those who have, in fact, retired. Many studies have been unable to assess retirement status directly and have instead relied on age or some other measure (such as receipt of pension income) as an indicator. In our study, we limited our attention to those individuals who were working when they were in their early fifties, as evidenced by a sufficiently high level of employment income at that time. We defined retirement in a conceptually more appropriate way by associating it with a subsequent substantial and sustained drop in earnings. Our attention was focussed mostly on the extent to which income was replaced on average, but we also considered how replacement ratios differed by level of pre-retirement income.
The timing of retirement (and hence the age at which retirement occurs) could itself be influenced by the amount of income expected to be available after retirement, and hence by the anticipated income replacement ratio. It is not clear how much discretion most people have in choosing a combination of retirement age and income replacement, but even if they are chosen together, interest remains in the fraction of pre-retirement income that is actually replaced and how that fraction varies by the age at which people retire.
Retirement itself is difficult to measure (see Denton & Spencer, Reference Denton and Spencer2009, for a discussion), but clearly the concept applies to individuals. While one might prefer to assess income replacement at the household level, since it is generally household income (and assets) that are used to finance household consumption, any attempt to define a household as “retired” immediately raises many complex considerations.Footnote 1 In any event, it is informative to assess post-retirement income replacement at the individual level.
In the discussion that follows, we have drawn on a large longitudinal database of tax records to obtain measures of income before and after retirement. The database provides detailed and accurate information on the incomes of almost five million individuals each year and follows them for as long as 25 years. It thus makes possible a new perspective on retirement. First, we identified those who retired (as evidenced by a sustained reduction in income from employment), rather than relying on age alone or receipt of pension income as an indicator. Armed with knowledge of who had retired, we were then able to calculate income replacement ratios and assess how they varied with age at the time of retirement, and subsequently with the length of time since retiring. Furthermore, we observed how patterns of income replacement differed among successive cohorts and how they varied across the income distribution.
Although there have been many studies of income in retirement, few have been able to restrict the analysis to those who had been employed previously, and who (based on their record of employment income) subsequently did retire. Thus our methodological approach may be of interest for possible application in other countries that have suitable data. In any event, the analysis provides new and informative results for the case of Canada.
Measures of Income Replacement
The reduction in earnings typically associated with retirement may be offset to a greater or lesser degree by income in the form of pension benefits (whether through public or private plans) or by income from other sources. Ideally, one would like to focus on consumption or the standard of living in retirement rather than on income itself. The longitudinal data file that we used has some advantages, the most important of which is its accurate and detailed measure of income by source over an extended period, but it does not provide information on consumption. An individual may accumulate assets (through saving) before retirement when income is high and then draw them down (through spending) after retirement, when income is reduced. That is the behaviour suggested by the basic life cycle model that originated with Modigliani and Brumberg (Reference Modigliani and Brumberg1954), according to which we would expect to observe a relatively constant level of consumption before and after retirement even though income may be lower after retirement.
The life cycle model in its simplest form assumes perfect foresight about future income and consumption levels at each age, and the date of death; it assumes also that capital markets make it possible to borrow against future income. With those assumptions, the level of consumption at each age can be shown to depend on permanent income and not on the level of income at that age; hence measures of income replacement would not be particularly meaningful. However, as Smith (Reference Smith2003) observed, uncertainty about future income, health, and life expectancy – and limits on the ability to borrow – would induce a greater temporal alignment of consumption with income, which may still be consistent with a life cycle model.Footnote 2 Even so, much empirical research indicates that consumption does fall after retirement by more than would appear to be consistent with the life cycle approach (e.g., Bernheim, Skinner, & Weinberg, Reference Bernheim, Skinner and Weinberg2001; Denton, Mountain, & Spencer, Reference Denton, Mountain and Spencer2006), and perhaps by as much as the decline in disposable income available to retirees (e.g., Banks, Blundell, & Tanner, Reference Banks, Blundell and Tanner1998; Schwerdt, Reference Schwerdt2005).
A focus on measures of income replacement is thus meaningful, and is indicative of loss of well-being that results from an apparent inability to maintain consumption at desired levels after retirement. That view gains further support from a growing body of behavioural research, including Benartzi and Thaler (Reference Benartzi and Thaler2007), who argued that few people, economists included, “spend much time calculating a personal optimal savings rate” that would enable consumption to be maintained. Instead, “most people cope by adopting simple ... rules of thumb” (p. 82) to determine such a rate (see also Ambachtsheer, Reference Ambachtsheer2008).Footnote 3
In practice, income-based replacement ratios are widely used as measures of well-being in retirement, partly because income is observed more readily than consumption, and also because even when consumption measures are available, income is generally measured more accurately. A variety of such ratios have been reported in the literature (see Smith, Reference Smith2003; Hurd & Rohwedder, Reference Hurd and Rohwedder2006, for reviews). Some researchers focus on the fraction of before-tax income that is replaced; others, on after-tax income. Some work with family or household units, with or without adjustment for family size; others, with individuals; and some take wealth holdings into account. In all cases, however, the underlying idea is to have an indicator of how well off individuals are after retirement as compared to when they were working.
It is usually argued that a somewhat lower level of income after retirement is consistent with maintaining one’s pre-retirement standard of living. That is because various costs associated with employment (such as suitable attire and commuting to work) no longer apply. Other advantages might include lower tax rates, age-related tax credits, an end to employer deductions for future pensions and employment insurance, seniors’ discounts on consumer purchases, and fewer dependents to support since children would typically have left home and have completed their education. Furthermore, one would no longer need to accumulate more private savings for retirement. Beyond that, time is freed up for activities such as meal preparation and home improvements (that is, for “home production”) that can add to one’s well-being even if it is not included in measured income. A replacement ratio of about 70 per cent is often considered sufficient to allow one’s standard of living to be maintained in retirement. Some researchers, perhaps limited by available data, have based their measure on income before tax; others, on income after tax. In our study, we emphasised the after-tax measure, because that is what is available to finance consumption, and we anticipated that those individuals with lower levels of income before retirement (and correspondingly fewer assets) would need a higher replacement ratio than those having larger incomes.
Gower (Reference Gower1998) and LaRochelle-Côté, Myles, and Picot (Reference LaRochelle-Côté, Myles and Picot2008) drew on the same longitudinal database as we used in our study to measure income replacement in retirement. Although they employed quite different concepts, both referred to similar target replacement ratios: LaRochelle-Côté et al., referring to earlier work by Schulz (Reference Schulz1992), stated that “Policy makers in the rich democracies have typically set a target replacement rate of from 65% to 75% for the average worker” (p. 99). Gower (Reference Gower1998) quoted the Canadian Department of Finance in stating that “between 60% and 70% of pre-retirement earnings is generally considered to be sufficient to avoid serious disruption of living standards” (p. 18).Footnote 4 Gower limited his analysis to those aged 55 and older in 1992 who had retired by 1995. He classified retirees as those whose total income in 1992 was derived mostly from employment, and who had some employment income in 1993 but none in 1995; he also defined the replacement ratio as after-retirement income in 1995 relative to pre-retirement income in 1992. His ratios were calculated separately for men and women, and (like ours) related only to their individual incomes, not to family or household units.
By contrast, LaRochelle-Côté et al. (Reference LaRochelle-Côté, Myles and Picot2008) were concerned with income replacement ratios for families; their analysis was limited to families in which at least one individual had substantial employment income while of “prime age” (defined as having average annual earnings of at least $10,000, measured in 2005 constant dollars, when aged 54 to 56). However, they did not impose a retirement test, perhaps because it is not clear how one would do so in cases where there is more than one worker. Instead, they calculated replacement ratios for successive cohorts that compared family total income at later ages with income at prime age, using after-tax measures of income in each case. Allowance was made for changes in family composition, including the death of family members, by comparing adult-equivalent adjusted measures of family income. The presumption of LaRochelle-Côté et al. was that an increasing fraction of each cohort would have retired as age increased, such that the ratios at sufficiently old ages would include few who had not retired.Footnote 5
Not surprisingly, a study based on after-tax size-adjusted family income (LaRochelle-Côté et al., Reference LaRochelle-Côté, Myles and Picot2008) found replacement ratios that were higher (close to 80%) than one based on the before-tax incomes of individuals (Gower, Reference Gower1998; about 58%). We observed that both studies found, as expected, that replacement ratios varied inversely with the level of income before retirement, with many in the lowest income groups having replacement ratios in excess of 100 per cent.
What is novel about our present study is that it has provided measures of income replacement for those who have, in fact, retired, based on our quite strict definition. Also, we have been able to show how rates of income replacement have varied by age of retirement and, for each age, how they evolved over the retirement period, for as many years as permitted by the data.
Data and the Definition of Retirement
The LAD
We have derived our analysis on the basis of Statistics Canada’s Longitudinal Administrative Databank, commonly known as the LAD (2006). The LAD consists of a random 20 per cent sample of all taxpayers who filed Canadian income tax returns in any year, starting in 1982.Footnote 6 Information is added each year as new returns are filed, and the sample is augmented with 20 per cent of first-time tax filers. Individuals are included for all years in which they filed tax returns. By 2006, the most recent year for which we have data from this source, there were more than 4.9 million individuals in the sample. Our study focused on information at the individual level, but other levels are available.Footnote 7
The LAD contains mostly information taken directly from individual tax returns,Footnote 8 which means a detailed year-by-year record for each person of how much income of each type was received. From the returns, we know also (as of December 31 of a tax year) age, sex, marital status, and place of residence – but little else.Footnote 9 For some purposes, there is clearly more that researchers would like to know about the characteristics of those approaching retirement – level of education, assets owned, industry of employment, occupation, and so on – but such information is not available in the LAD. Even so, the LAD has much to recommend it. Indeed, the very large sample size, its longitudinal nature, and the detailed and accurate information about income that it provides make it an appealing foundation for the analysis of income-based measures of retirement and well-being – of how well-off individuals are after retirement as compared to the period when they were employed, how retirement patterns have changed over time for successive cohorts, and how they vary by level of income.
Sample Selection and Measure of Retirement
Denton and Spencer (Reference Denton and Spencer2009) observed that, in the literature, “there is no general agreement on precisely how retirement should be defined, although most agree that it relates to withdrawal from the paid labour force” (p. 63). The approach we have taken here is as follows.
Although any choice of age is arbitrary, we considered the notion of retirement (for all practical purposes) to be irrelevant before the age of 50. We first selected all tax filers aged 50 in 1982 and followed them until 2006 if they survived and continued to file income tax returns, or until they died or were otherwise lost from the sample because they failed to file returns.Footnote 10 We then did the same for tax filers aged 50 in 1983, tax filers aged 50 in 1984, and so on, thus building up income histories for a series of successive cohorts, with each cohort identified by the year in which it reached the age of 50. We excluded those few who died or were lost before reaching age 52. We also excluded individuals who had any income from farming or fishing at ages 50, 51, or 52, since the notion of retirement is conspicuously vague for those occupations. For each tax filer remaining in our observation set, average income from employment at ages 50 to 52 was then calculated as the arithmetic mean of the incomes at those three ages. In order to limit the analysis to individuals with significant labour market attachment, we excluded those for whom this average was less than $10,000, in constant dollar terms.Footnote 11 That figure is arbitrary, but it may be thought of as representing about the amount that would be earned by someone working roughly half-time at the minimum wage rate.
The next step was to identify those who had retired, as indicated by a major and sustained reduction in employment income. For each tax filer, we calculated Ra, the ratio of employment income at each subsequent age, a, to average employment income at ages 50 to 52, for the maximum period permitted by the data. A tax filer is said to have retired at the age at which Ra first falls to or below a critical level, R*, provided that this condition continues to be satisfied in each of the subsequent two years.Footnote 12
In earlier work, several values of R* were considered, ranging from 0.00 to 0.50 (see Denton, Finnie, & Spencer, Reference Denton, Finnie and Spencer2009; and Denton & Spencer, Reference Denton and Spencer2009, for a review of retirement measures). Thus, at one extreme, a person was deemed to have retired only if he/she had no income from employment (R* = 0.00); at the other, the same person could be classified as retired even if income from employment was as much as half as great as its average level when he/she was 50, 51, or 52 (R* ≤ 0.50). We have found that while the overall proportion retired was sensitive to the value of R*, the age pattern of retirement was not. In consequence, we focussed attention on R* = 0.10, and continued with that criterion throughout our analysis. Thus, we deemed a person to have retired when his or her (real) income from employment fell below 10 per cent of what it was at ages 50 to 52, and remained below that level for the following two years.Footnote 13
We note and emphasise that what we measured was first retirement. It is possible that an individual may have retired by our criterion but then subsequently returned to work. However, the criterion is rather demanding, inasmuch as earned income must remain below the threshold ratio for three successive years. Analyses of multiple retirements, of bridging between “full employment” and “full retirement” and other dynamic aspects of retirement behaviour, could be considered in further work. We note also that, using the LAD, we were unable to distinguish whether retirement, as we measured it, was voluntary or involuntary. However, other evidence has suggested that our measure might exclude most involuntary retirement.Footnote 14
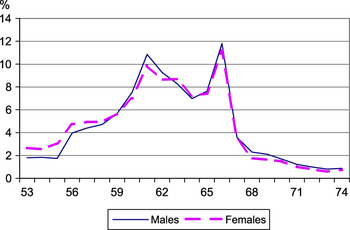
Figure 1 shows the distribution of retirement ages – the per cent who retired at each age – for the 1982 cohort (i.e., the cohort that was 50 years old in 1982). Among those who were employed at ages 50 to 52, women were somewhat more likely than men to retire at younger ages, less likely at older ages, but the differences were small, perhaps surprisingly so. For both sexes the proportion of the cohort retiring at each age tended to increase up to age 61, then dipped until age 64 before peaking again at age 66, after which it tailed off sharply. (Note again that the calculation here refers to age in the first full year of retirement, not age at the exact date of retirement.)
Distribution of age at retirement, 1982 cohort

Income Replacement
The Replacement Ratios
Our retirement criterion was based on employment income but our measures of income replacement were based on total income, from all sources.Footnote 15, Footnote 16 To construct our income replacement ratios, we considered four income measures, over four different intervals. Two of the measures we used relate to the period before retirement: income at prime working age (defined here as ages 50 to 51) and income in the first two of the three years before retirement.Footnote 17 (As we have noted, all income measures are “real”, i.e., price-deflated using the consumer price index.) The two other measures we used relate to the period after retirement: shortly after retirement (the average based on post-retirement years 1 and 2) and, to the extent that data permit, half a decade after retirement (the average of post-retirement years 5 and 6).
We calculated replacement ratios on the basis of relationships between the last two measures (income after retirement) and the first two (income before retirement). The calculations were made for both before-tax and after-tax average income, using the ratio of averages (rather than the average of ratios, which may be quite sensitive to individual outlier observations).Footnote 18, Footnote 19
The 1982 Male Cohort
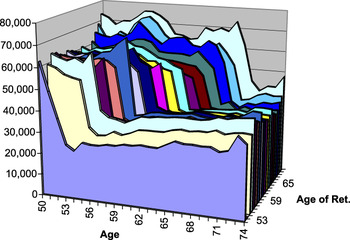
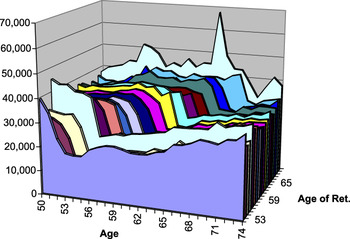
A first look at the age profile of income is provided in Figure 2, which relates to the 1982 male cohort – males of age 50 in 1982. The figure indicates the average income before tax at each age, from 50 through 74, by age of retirement. Some in this cohort retired as young as 53, others at 54, and so on. The figure shows the oldest age of retirement was 70. It is only because the sample on which this analysis has been based is so large that we have been able to provide income measures in such fine age detail. For example, the age patterns of income for those who retired at the youngest ages, 53 through 55, were based on almost 300 observations at each single year of age, in most cases; even at the oldest ages they were based on well over 100 observations. In total, the cohort had more than 16,000 retirees. Even so, caution should be exercised in interpreting the results: a small number of individuals with especially high income levels can have a large effect on an average.Footnote 20 Such effects are evident in the figure, but they do not obscure the broad patterns.
Average income before tax, by age and age of retirement, 1982 cohort, males (Note: Income is in constant dollars, using 2006 as the base. The plot for those who retired at age 54 is excluded; see text.)

Figure 2 shows that a sharp drop in (real) income occurred immediately after retirement. Of particular interest is that the decline appears to have been about the same for those who retired in their mid-50s as for those who worked a decade longer. It also appears that there was a small but fairly persistent increase in the level of income in the years after retirement, a feature that again is largely independent of the age at which people retired. Finally, and perhaps surprisingly, although the circumstances may have differed greatly among individuals, the age of retirement, too, was apparently largely independent of average income in the years just before retirement.
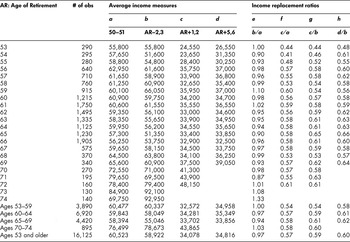
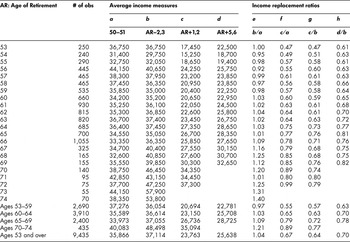
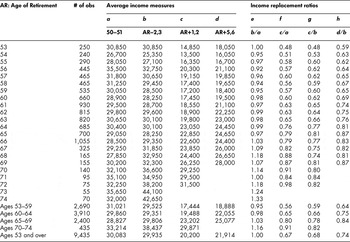
Table 1 provides further information. The columns labelled a through d record our four measures of average before-tax income for each age of retirement. Column a shows the average at ages 50 to 51. The second measure, in column b, shows average income in the first two of the three years preceding retirement (e.g., ages 60 to 61 for those who retired at 63) – a measure referred to hereafter as “income before retirement”. (We included only the first two of the three years in the calculation since the retirement may have commenced during the third year, in which case annual income in that year would likely have been reduced.) Column c shows average income in the two years after retirement (e.g., ages 64 to 65 for those who retired at 63), hereafter referred to as “income after retirement”. Finally, column d shows the average income five and six years after retirement. The measures in columns c and d were not available at the oldest ages.
Income and income replacement by age of retirement: 1982 male cohort, based on income before tax

Key:
obs = observations
Average income measures:
a average before-tax income
b average income in the first two of three years preceding retirement
c average income in the two years after retirement
d average income five and six years after retirement
Measures of income replacement:
f ratios of income after retirement to income at prime age
g ratios of income soon after retirement to income before retirement
h ratios of income half a decade after retirement to income before retirement
Note 1: Based on special tabulations of the Longitudinal Administrative Databank. The number of observations and average income values have been rounded. The number of observations applies to all values in each row. The age intervals that are included in the weighted averages reported at the bottom of the table differ depending on data availability.
Note 2: AR–2,3, AR+1,2, and AR+5,6 indicate number of years before (–) or after (+) retirement.
We note first some interesting features relating to pre-retirement income. Consider average income at ages 50 to 51, a measure at “prime age” that can be compared consistently across the various ages because it is observed for all individuals, regardless of when they retired. Based on the averages shown at the bottom of the table, for the 1982 male cohort we see that later retirement is associated with moderately lower incomes at prime age, at least for those who retire before the age of 70. For example, average incomes at prime age are about three per cent lower for those who retired at ages 65 to 69 than for those who retired 10 years younger.
That result may seem surprising in that those with higher levels of education (and hence, typically, higher levels of income) generally have higher rates of labour force participation at each age.Footnote 21 However, retirement is related not to the participation rates but rather to changes in those rates. Using income as a rough reflection of education level suggests that changes in the participation rates are similar across education groups, but slightly greater for those with higher levels of education (income). The implication regarding education cannot be tested with the LAD, since level of education is not known, but we note that a similar result was found for the United Kingdom and Italy in a study which concluded that “in both countries high earners retire relatively early while those in the lowest income groups tend to retire later” (Gough, Adami, & Waters, Reference Gough, Adami and Waters2008, p. 167). However, the differences in Table 1 are not great – as stated, the prime age incomes of the early retirees in our study were only three per cent higher than those of later retirees, on average.
Interestingly enough, the situation differed significantly for those who retired later, at ages 70 to 74: they had prime age incomes over 30 per cent higher than the average for all ages. It seems likely that a selection process was at work: the late retirees may have consisted of a relatively high proportion of self-employed individuals, including those who became self-employed after retiring as career employees.Footnote 22
A further observation to be made is that income before retirement, at whatever age that occurs, tends to be lower (in real terms) than at prime age. That is true at almost all ages of retirement, and on average, the ratio b/a (shown in column e) decreased with age, at least for those who retired before their early 70s. We note that this does not necessarily indicate an age-related decline in employment earnings potential. It may instead reflect a gradual withdrawal from income-earning activity as retirement approached, with the extent of withdrawal increasing with the age of retirement. That is another matter that could be addressed in further research.
The last three columns of Table 1 show our measures of income replacement. The first, column f, shows the ratios of income after retirement to income at prime age. The last two (columns g and h) show ratios of income soon after retirement, and half a decade after retirement, to income before retirement. The first measure, in column f, has the lowest values, with an average over all ages of retirement of 0.57, as shown in the last row. The next two measures indicate that, on average, income replacement ratios were fully maintained for half a decade after retirement, which was as long as we could observe them. We can see, too, that the replacement ratios generally increased with age of retirement, at least up to age 70, and that they were especially low for those who retired before age 56.
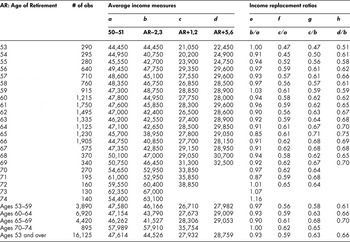
Table 2 provides the same measures as Table 1, but based on income after tax rather than before. The after-tax ratios were higher, as we expected, given the progressive nature of the income tax system, and the differences were greater for those who passed their 65th birthday, reflecting the age allowance in the tax system.
Income and income replacement by age of retirement: 1982 male cohort, based on income after tax

Note: See note to Table 1.
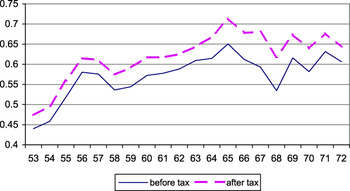
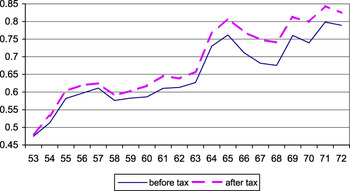
Figure 3 shows the c/b ratios, both before- and after-tax, and brings out two important features of the Canadian income tax and pension systems. The first is the sustained increase in both ratios that began with retirement at age 58 and continued to retirement at age 65. Those who retired at 58 would typically elect to receive their Canada or Quebec Pension Plan (C/QPP) benefits at age 60, the youngest eligible age. The numerator (income at ages 59 and 60 for those who retired at age 58) would be somewhat higher for those who retired at 59 rather than 58, since with another year of contributions their C/QPP benefits would be higher as well. That effect would continue: retirement pension benefits would increase with age of retirement, on average, since the contributory period would be longer.
Income replacement ratio c/b, by age of retirement, 1982 cohort, males

The effect is further enhanced for those who retired at ages 63, 64, and 65, since their numerators (income one and two years after retirement) would now include Old Age Security and Guaranteed Income Supplement (OAS/GIS) benefits, which commenced at age 65.Footnote 23 The after retirement income of those who retired at 66, 67, or 68 would already include OAS/GIS benefits, while the denominator (income before retirement) would become progressively higher with the age of retirement, thereby reducing the ratio as age increased. After age 68 the ratio was relatively constant, aside from what is perhaps sampling variability, since these considerations would no longer apply.
The second feature we note in Figure 3 is the difference between the before- and after-tax replacement ratios. The difference is fairly constant, at about 0.04, for those who retired at age 63 or younger. However, starting at age 64 the gap increased steadily, reaching 0.09 at age 67. That increase reflects the receipt of income-related OAS/GIS benefits and the “age amount” allowance, both of which would have taken effect at 65. They affect the numerator (income after retirement) starting at age 63. The gap diminished steadily after age 67, as the gains were reflected more fully in the denominator (income before retirement). That these measures should reflect so effectively these aspects of the tax and transfer system attests to the quality of the underlying data.
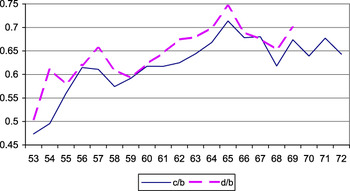
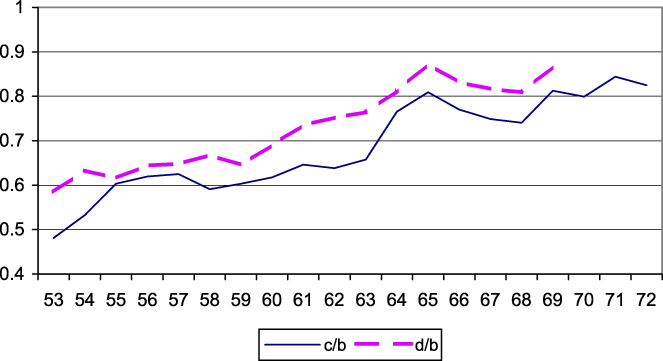
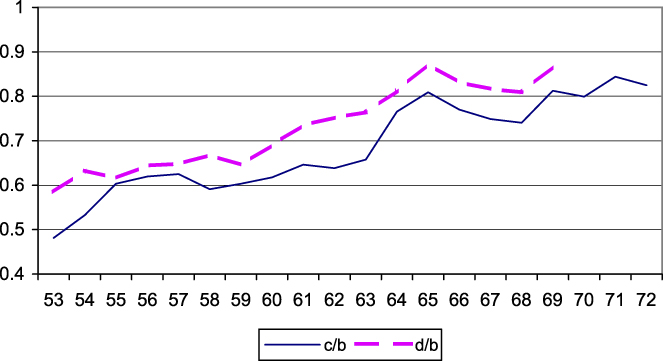
Figure 4 compares the c/b and d/b income replacement ratios, in each case based on income after tax. We see again the sustained increase in the c/b ratio from retirement ages 58 through 65 and the subsequent decline to age 68. We note also the similar pattern in the d/b ratio, but starting a year later, at retirement age 59. That resulted from the different numerator – income half a decade after retirement – which would start to rise with eligibility for benefits that begin at age 65. Thus the main results held up across alternative measures of income replacement, and they differed in ways that reflect retirement-related institutional arrangements.
After-tax income replacement ratios, by age of retirement, 1982 cohort, males

The 1982 Female Cohort
Recall that all the women in our sample, like the men, had experienced significant labour force attachment: their average annual employment earnings were at least $10,000 (measured in dollars of 2006) when they were aged 50–52. However, the sample sizes for women were somewhat smaller, which (while expected) invites further caution in the interpretation of results.
Figure 5 shows the age-income profile for each age of retirement based on income before tax; it corresponds to Figure 2, which relates to men. The difference in income levels stands out: incomes at prime age were about 40 per cent lower for women. However, the sharp decline in income associated with retirement was similar to that for men.
Average income before tax, by age and age of retirement, 1982 cohort, females

Tables 3 and 4 show the before- and after-tax measures for the 1982 female cohort. We found, for males, that income tended to decline somewhat after prime age, a difference that increased with age of retirement. For women, we found the opposite: incomes were generally higher shortly before retirement than at prime age. The difference may be associated with work histories: women in the 1982 cohort would, on average, have had much less labour force experience at age 50 than men, hence have been much younger in a career sense, and therefore continued to experience gains in earnings. It may be associated also with a transition towards more full-time and less part-time work as their children came to need less care. Whatever the reason, women who retired in their late 60s had incomes before retirement nine per cent above those in prime age, on average, while men had incomes six per cent below.
As with men, before age 70 there was an inverse relationship for women between prime age income and age of retirement: those who retired early had higher earnings at prime age than those who retired later. The relationship was somewhat stronger for women than for men.
Income and income replacement by age of retirement: 1982 female cohort, based on income before tax

Note: See note to Table 1.
Income and income replacement by age of retirement: 1982 female cohort, based on income after tax

Note: See note to Table 1.
While women’s average earnings before retirement were more than 40 per cent lower than those of men, their replacement ratios, c/b and d/b, were somewhat higher. Even so, the age patterns were generally similar, as Figures 6 and 7 indicate. The higher replacement ratios for women reflect the characteristics of the public-source income support system, which is geared to providing relatively high levels of support for those with lower incomes. Aside from level, the major difference is that the ratios increased more strongly with age of retirement for women. That is reflected in the differences between the male and female ratios; for example, for women the after-tax d/b ratio rose from 0.64 for those who retired before age 60 to 0.84 for those who retired at ages 65 to 69. The corresponding rate for men rose from 0.61 to 0.70.
Replacement ratio c/b, by age of retirement, 1982 cohort, females

After-tax income replacement ratios, by age of retirement, 1982 cohort, females
Income Replacement for Later Cohorts
We consider now the patterns of income replacement of later cohorts, and how they differed from those of the 1982 cohort. For this purpose, we selected those cohorts that reached age 50 five and ten years later – that is, in 1987 and 1992. The choice was arbitrary, but it allowed us to follow cohorts from when they were age 50 to retirement at ages as old as 69 (the 1987 cohort) or 64 (the 1992 cohort).
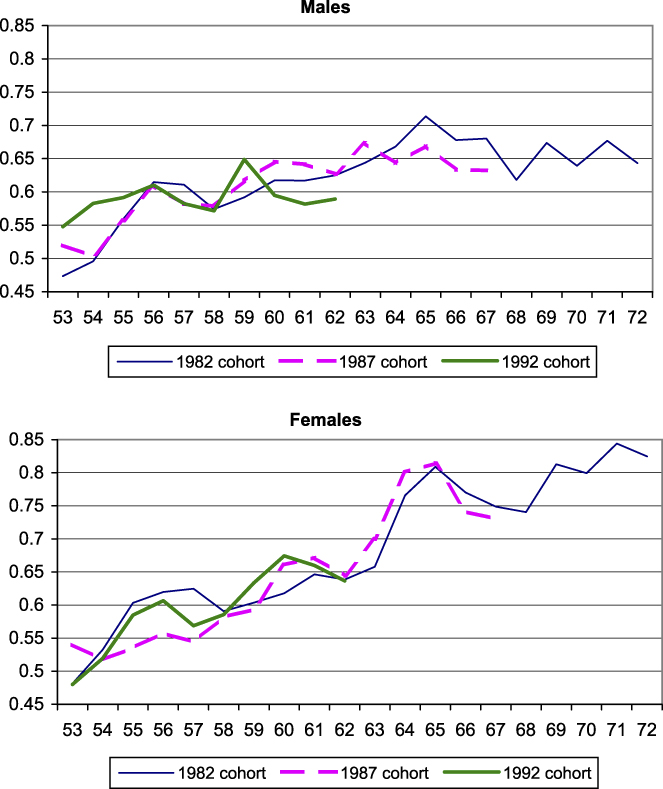
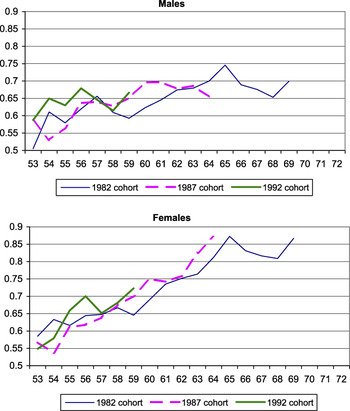
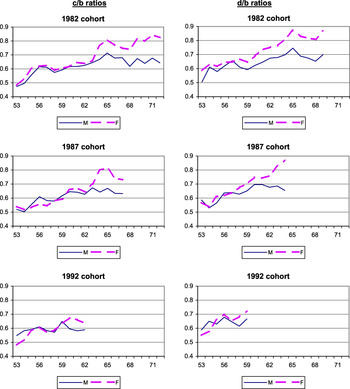
Figures 8 and 9 display the after-tax c/b and d/b ratios, respectively, for all three male and female cohorts. The tendency for each of the replacement ratios to increase with age of retirement is evident, but much more strongly so for women than for men. Also clear in the case of women is the impact that features of the Canadian income support system have on the age pattern of replacement ratios as we have described. That impact appeared to be strong also for men in the 1982 cohort, but was less evident in the later cohorts. Further research is needed to understand the differences.
After-tax income replacement ratio c/b, by age of retirement, selected cohorts, by sex
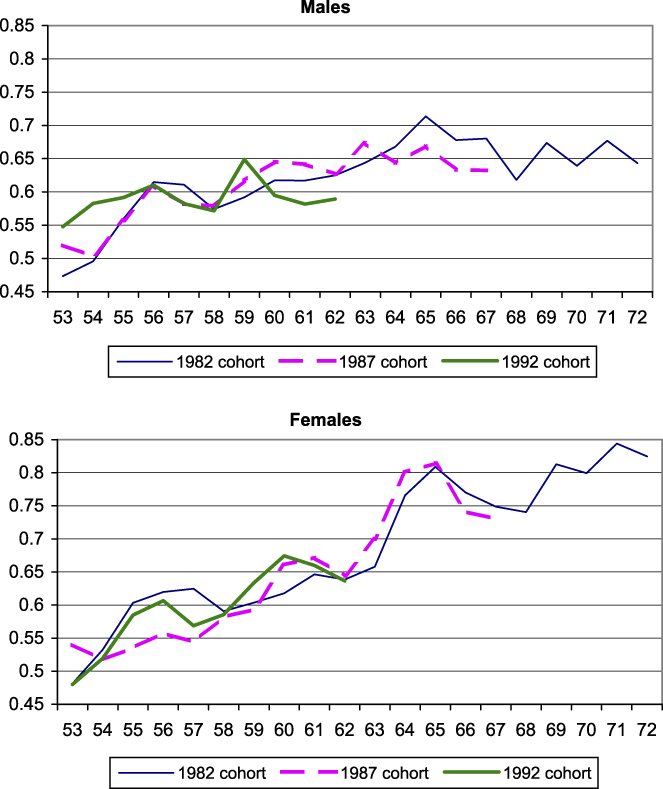
After-tax income replacement ratio d/b, by age of retirement, selected cohorts, by sex

The male-female differences in replacement ratios are evident in Figure 10, as is their persistence from one cohort to another. The differences were quite small for those who retired before age 60, but tended to increase with age of retirement. That again reflects the extent to which the public income support system is directed towards older people, and especially those with lower incomes, a group that is over-represented by women.
After-tax income replacement ratios, by age of retirement, selected cohorts, male-female comparisons

Income Replacement across the Income Distribution
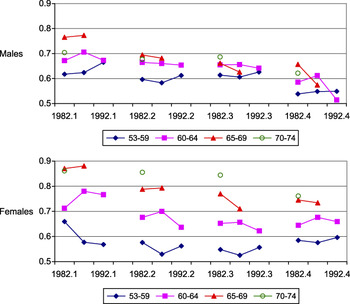
To assess how retirement patterns vary with the pre-retirement level of income, we classified those in our sample into income quartiles based on average employment income at ages 50 to 52. Figure 11 shows how the after-tax income replacement ratio c/b varies by quartile. Average values of the ratios are shown separately for males and females for each of four groupings by age of retirement – between ages 53 and 59, 60 and 64, 65 and 69, and age 70 and over.
After-tax income replacement ratio c/b, by age group and income quartile, selected cohorts

We would expect to find that replacement ratios generally declined with income, and that is typically what we found. Men in the first (i.e., lowest) quartile had after-tax replacement ratios that were 12 to 26 per cent higher than those in the fourth quartile, depending on the year and the age of retirement; for women the differences were less clear, especially for those retiring at the youngest ages. We would expect also to see that, within each quartile, the replacement ratios would be higher for those who retired later; that, too, is generally what we found. We found, also, that the difference in the ratios between retirement at, say, ages 65 to 69 and 53 to 59, diminished as income increased.
Since women in each quartile had lower earnings than men, on average, we might expect to find that they would have higher replacement ratios. That, too, is what we found in most cases. While there were exceptions, especially for those who retired at the youngest ages, the replacement ratios for women in each quartile generally exceeded those for men, often by a wide margin.
Concluding Remarks
It is generally accepted that people prefer a constant standard of living to one that fluctuates or declines over time. That preference applies to the years in retirement, when maintaining the pre-retirement standard is presumably desired. Whether that goal is achieved may depend on the extent to which income is reduced at retirement, and that reduction may be greater than expected if there is an unanticipated decline in the value of income-producing assets accumulated while working. It may depend also on the ability or willingness of individuals to draw down their assets, a major component of which is typically owned housing. Beyond that, many may have few assets on which to draw. Measures of income replacement ratios – ratios of pre-retirement to post-retirement incomes – therefore provide useful information about well-being in retirement as compared to the period before retirement.
Our study focus was specifically with those who retired and how successfully they have maintained their incomes (and hence their standards of living) after retirement. In that regard, we were fortunate in being able to draw on a longitudinal data file that provided us with the basis for a strict definition of retirement, the age at which retirements took place, and the income levels year-by-year for an extended period, both before and after retirement. Furthermore, the file is large enough to permit analyses of how cohort retirement patterns and income replacement ratios have evolved over time, to allow us to consider men and women separately, and to examine differences across the income distribution.
We restricted our sample to those who had significant labour force attachment when they were in their early 50s, as indicated by their level of earnings at that time. Their retirement was indicated by a substantial and sustained drop in earned income. Using that criterion, we determined how the age distribution of retirement changed over time and across cohorts. We found that the age distribution of retirement is similar for men and women, perhaps remarkably so. Age 66 was the most popular age of retirement (the first full year of retirement, that is) among those aged 50 in 1982, with an “early retirement” peak at age 61. That pattern continued for later cohorts, but the proportion waiting until 66 declined somewhat, and a further early retirement peak emerged at age 56. Women tended to retire a little younger than men, but the differences are small. A full analysis of the evolving patterns of retirement across successive cohorts is provided in Denton, Finnie & Spencer (Reference Denton, Finnie and Spencer2009).
Our major findings, which build on the retirement patterns, relate to income replacement ratios of real (i.e., price deflated) incomes. We focused (necessarily, given the data and nature of our analysis) on these ratios for individuals, not families or households. In that way we have been able to relate the measure of income replacement to those who have, in fact, retired. While our findings are largely descriptive, they provide, for the first time in Canada, comparisons of income in retirement with income in the pre-retirement years, and show how patterns of income replacement differ, depending on gender, age at retirement, number of years in retirement, and the pre-retirement level of income.
Our main conclusions are as follows. First, in the two years immediately after retirement, the after-tax income replacement ratios average about two-thirds when calculated across all ages of retirement. That is true of the oldest cohort, for which information about retirement is most complete, and a similar pattern appears to be sustained among younger cohorts, at least up to those ages at which retirement can be observed in the data. Our two-thirds ratio is somewhat lower than reported in the recent Canadian study by LaRochelle-Coté et al. (Reference LaRochelle-Côté, Myles and Picot2008). In part that is because our ratios relate only to those who had significant labour force attachment when they were in their early 50s and had subsequently retired. By contrast, LaRochelle-Côté et al. reported ratios that relate to age alone, and were not restricted only to those who had in fact retired. Also, our ratios are lower because the replacement measures relate to individual rather than size-adjusted family income. The majority of households, including those with retired people, have two or more persons. Both types of ratios are informative, in our view, and complement each other.
Our second main conclusion, and one that seems to have no counterpart in the literature, is that the ratios tend to increase with the age of retirement. That is true for both men and women, with the exception of the oldest male age-of-retirement group (those who retired after 70; for them, the ratios are about the same as for those who retired at ages 65 to 69). As one example, for the cohorts aged 50 in 1982 and in 1987, the after-tax replacement ratios for those who retired between 65 and 69 are 12 to 17 percentage points higher than for those who retired before age 60.
Our third conclusion, which we think also to be new, is that the replacement ratios increase with years in retirement, at least in the first few years. Half a decade after retirement the average replacement ratio for men is about five percentage points higher than it was after two years; for women it is more than 10 per cent higher. (All income measures have been adjusted for inflation, so the gains are real, not nominal.)
Our fourth conclusion relates to how replacement ratios vary across the income distribution. We find that they are highest in the lowest income quartile and generally decline as income increases; that is as one would expect with a public income security system that directs support to those with lower income levels. For example, in the lowest quartile the after-tax income replacement ratio that compares income shortly after retirement to shortly before averages about 0.74 for women and 0.68 for men, exceeding the ratio for those in the highest income quartile by about 14 per cent for women and 15 for men. We find also that within each quartile the replacement ratios are higher for those who retired later than for those who retired earlier.
What explains these patterns? As we have said, any explanation at this stage is somewhat speculative, but it appears that they reflect, in large part, features of the Canadian income support system, especially those relating to the age of eligibility for work-related public pension benefits (C/QPP) and income support programs targeted to the elderly (OAS/GIS). Features of the system also help to explain why the replacement ratios for women are higher than for men: the public income support system is designed to provide relatively larger transfers to those whose pre-retirement income levels are lower, which has been true, on average, for women. These findings point to the importance of the system in maintaining minimal post-retirement incomes in old age. We observe also that the (somewhat surprising) post-retirement increase in the replacement ratio could be explained in part by the (optional) delayed receipt of pensions, and/or by our focus on individual rather than household replacement ratios. For example, survivor pension benefits and the income from assets previously in the hands of a now-deceased spouse would increase the income of the survivor. Future work may assess the importance of the death of a spouse in this regard.
We conclude by noting two other of the many topics that could be addressed in future research. We have focussed attention on the average income from all sources, or average total income. However, it is evident that the sources of income change after retirement, since income from employment will be greatly reduced (to zero in many cases) while income in the form of pension benefits will increase and income from investments may play a larger role. Future work might explore how the composition of total income changes in the years after retirement for those who have in fact retired, and how it differs by age of retirement and position in the income distribution. The fine quality of the income information in the LAD and the sheer size of the sample should facilitate this kind of analysis. In addition, our concern so far has been to provide a description of how income changes at retirement, how replacement rates change with age in the post-retirement period, and whether the patterns differ across cohorts. Another direction for future research would be an investigation of why the changes have occurred, taking into account the inevitably endogenous relationship between age of retirement and income in retirement.