

Historical Context
Item Response Theory (IRT) has its roots in Thurstone's work to scale tests of “mental development” in the 1920s (Bock, Reference Bock1997). As discussed by Bock, Thurstone envisioned a measurement model in which the probability of success on a given intelligence test item was a function of the chronological age of the respondent. In other words, older children would have more success on more challenging test items because their mental abilities were more developed. Perhaps more importantly, the model that Thurstone conceptualized included parameters describing characteristics of the individual items and was built around the premise that respondents and items could be placed on the same quantitative latent continuum.
Thurstone's conceptualization was formulated in subsequent years as the mathematical advances needed to realize his vision were developed (Lord & Novick, Reference Lord and Novick1968; Rasch, Reference Rasch1960), along with extensions from manifest constructs, such as chronological age, to latent (i.e., unseen) constructs, such as mathematical ability, physical functioning, and pain. The advantages of IRT have been described in a number of papers and book chapters: continuous, interval-level scoring, item-level parameters that facilitate the development of valid measures, precise scoring, and reliability estimates, and valid comparisons of respondents who took more, fewer, or different items (DeVillis, Reference DeVillis2006; Embretson & Reise, Reference Embretson and Reise2000; Hambleton & Jones, Reference Hambleton and Jones1993; Hays, Morales, & Reise, Reference Hays, Morales and Reise2000; van der Linden & Hambleton, Reference van der Linden and Hambleton2013). These advantages are important, as they, respectively, obviate assumptions (e.g., strictly parallel forms) that are difficult to satisfy and allow measures to be obtained more efficiently.
The relevance of IRT and measurement theories, generally, and to brain impairment research specifically, is twofold. First, many of the targets of interest in this research community are latent constructs (i.e., functions or symptoms along a continuum from low to high, or mild to severe) that are commonly assessed using clinician-rated or patient-reported outcome questionnaires, including functional status, participation, symptom frequency and severity, and quality of life. Second, the quality of our measures is fundamental to our science, governing the sample sizes of our studies, and accordingly, their cost, the time it takes to complete the research, and ultimately, the scientific progress that our fields are able to make. The sections below introduce IRT concepts and metrics. In addition, a Rasch-model analysis of the 10-item Eating Assessment Tool (EAT-10), a self-administered, symptom-specific outcome instrument for dysphagia (Belafsky et al., Reference Belafsky, Mouadeb, Rees, Pryor, Postma, Allen and Leonard2008), is provided to illustrate IRT. Finally, Table 1 includes definitions introduced throughout the paper.
Selected Definitions Introduced Throughout the Paper

Description of the Technique
IRT models can be grossly categorized into 1-parameter logistic (1PL), 2-parameter logistic (2PL), and 3-parameter logistic (3PL) models. The parameter in the 1PL model is the natural log of the odds of “success” on a dichotomous (e.g., correct/incorrect, yes/no) item or “endorsement” of a category on a polytomous item (e.g., mild/moderate/severe, not at all/several days/more than half of the days/nearly every day). The 2PL model includes both the log-odds of endorsement and additionally, a discrimination parameter, which is the slope of the S-shaped logistic curve at its inflection point. 3PL model includes both the log-odds of endorsement and discrimination parameter from other models and additionally, a pseudo-chance “guessing” parameter, which is the lower asymptote of the logistic curve. Figure 1 shows the S-shaped logistic item characteristic curve, the discrimination (slope), and the pseudo-guessing parameter at the lower asymptote of the logistic curve. A steeper discrimination slope than that shown in Figure 1 would more precisely discriminate success or failure on an item (y-axis) as a function of person ability (x-axis).
Example of item characteristic curve.

1PL “Rasch” models (named after Danish mathematician Georg Rasch) and 2PL models are used commonly in the development and scoring of health-related outcomes, the latter is often used when sample sizes (>1000) permit modelling a discrimination parameter and the former when they do not. Philosophical considerations are also key factors in the choice between 1PL and 2PL models for health outcomes (Andrich, Reference Andrich2004). The 3PL model is applied in educational settings but rarely in measuring health-related outcomes because it is difficult to assume that guessing is involved in self- or clinician-reported health measures.
A high-level overview of the calculation process in the dichotomous Rasch model, for example, is as follows: First, the proportion correct for each person measured and each item administered are calculated. Next, the proportions correct are converted into person “ability” (also called theta) and item “difficulty” estimates by taking the natural log of the odds of success. Subsequently, in an iterative process, the item difficulty and person ability estimates are compared and adjusted until the sum of the squared item residuals is relatively stable between iterations and as close to zero as possible. Finally, the primary output from these calculations are logit (low-jit) values, which range, theoretically, from ± infinity, but commonly in practice, from ± 4.0. These logit values scale the persons and items together and allow, for example, for one to calculate the probability of success of persons on items with different logit values: the probability of success of a person on an item with the same logit estimate is 50%, on an item that is one logit greater is 27%, and on an item that is one-half logit less is 63%.
When to Use IRT Models
IRT models are useful in developing, validating, and refining multi-item latent construct measures, where individual items evaluate different positions along the continuum of the latent construct. The models originated in educational testing circles and are most readily applicable to multi-item survey questionnaires, which are test-like in that they use many items to approximate the different facets of complex constructs (e.g., mathematics ability, depression). Multi-item questionnaires are also similar to educational tests in that they are summed or combined in some other way to produce a score, which is a composite of the different facets of the latent construct. These similarities between educational tests and survey questionnaires facilitated the application of IRT models to health measurement constructs.
IRT models are less useful for questionnaires that treat single survey items as discrete measures of latent construct. For example, in a study of medical decision making, Zikmund-Fisher and colleagues asked respondents to rate health care decision making for a variety of health decisions: “Was it mainly your decision, mainly the health care provider's decision, or did you and the health care provider make the decision together?” (p. 88S). In the analysis, the responses of “mainly the provider”, “shared”, and “mainly the patient” for each decision (e.g., medication initiation, cancer screening) were compared. In this example, the degree of shared decision making for a particular medical condition is a latent construct, in and of itself, and is assessed with a single questionnaire item, not multiple items.
It should be pointed out that although IRT models are useful in developing, validating, and refining multi-item latent construct measures, they are more esoteric and less familiar that Classical Test Theory (CTT) approaches. CTT considers observed scores (X) simply as the product of a respondent's True Score (T), the average of repeated observations of observed scores, and error (E), i.e., the difference between observed and true scores (see DeVillis, Reference DeVillis2006 and Kean & Reilly, Reference Kean, Reilly, Hammond, Malec, Nick and Buschbacher2014 for thorough contrast of CTT and IRT). Additionally, the IRT transformation from raw scores to logits may complicate the clinical use of scores, though this may be obviated by logit-to-T-score or percentile transformations for audiences who are familiar with these concepts (Kroenke, Monahan, & Kean, Reference Kroenke, Monahan and Kean2015).Though arguable, the relative lack of refinement realized in measures developed with CTT vs. IRT methods may be better attributed to the failure of scale developers to carry out a comprehensive set of instrument development and evaluation approaches than to the statistical approach used, despite the statistical advantages of IRT.
Precision in Measurement
Despite being less straightforward and requiring stronger assumptions (discussed below) than CTT, IRT models often improve the precision of measurement (i.e., the inverse of error, reliability) (Fries, Bruce, & Cella, Reference Fries, Bruce and Cella2005). Precision in the measurement process and consistency of scores is critical and perhaps under-appreciated in health measurement relative to educational measurement research communities. Consider, though, that less error results in more accurate assessment of measured abilities and of change, such as the improvement associated with a clinical intervention. Accordingly, improved accuracy can reduce the standard deviation (SD) (i.e., the spread) of baseline assessments or change scores because the variability in outcomes would be less affected by measurement error and would more closely approximate the true estimate of symptom burden, or the effect of the intervention in the study population. A reduction in the SD of baseline or change scores results in greater effect size (ES) estimates, as the SD of baseline or changes scores is used as the denominator in common ES calculations (e.g., Cohen's d, Standardized Response Mean, respectively). In sum, greater reliability results in less error, and generally, smaller SDs and greater ES estimates.
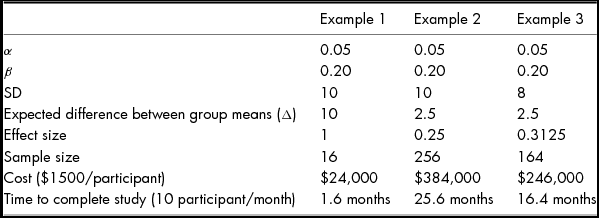
Standard deviations and effect size estimates are critical because they govern the sample size of the study and, accordingly, the per patient study costs and time to complete the study. This can be illustrated using a sample size calculation comparing the means of two groups on a continuous measure – a common clinical trial design. Using conventional thresholds for type I and type II error, 0.05 and 0.20, respectively, the sample size is equal to 16 times the SD2/Δ2. Table 2 illustrates the impact of more precision in measurement.
A Comparison of Three Hypothetical Measures and Their Associated Study Sample sizes, Costs, and Study Durations

Example 1 is an unlikely scenario in brain impairment research because the expected study effect size (i.e., expected difference between groups/SD) is 1/1 = 1, and our interventions rarely move outcomes to this degree. It is included here because the simplicity of the math most plainly illustrates the relationships. The effect size in Example 2 is realistic in this context, and, in comparison with Example 1, the sample size, costs, and time to complete the study increase dramatically. The most illustrative comparison is that between Examples 2 and 3, which differ only by the SD of scores in study samples and to a degree that can reasonably be expected from the greater precision realized by a more reliable outcome measure.
Though the difference between SDs is modest, the impact is considerable: the study completed with the more precise outcome measure can be completed with two-thirds of the resources and will be finished nearly a year earlier than that done with the less precise outcome measure. These time and costs savings are critical components to increasing the impact of research on clinical care. As such, the application of measurement theory concepts is useful at any stage in the development and refinement of outcome measures, including exploratory analysis, as well as in the planning stages of research.
Concepts and Metrics to Achieve Greater Measurement Precision
One way to conceptualize measurement is to think of it as the assignment of value. To assign values, we need units. We could measure distance, for instance, by using rocks as units, lining them up in a straight line, and counting them. Our accuracy might be poor, though, because rocks vary in size and because our line may not be straight or level. Measures developed using CTT can suffer from the same problems as our line of rocks: the units vary in size and the line is usually not straight.
Interval-Level Measurement
Take, for instance, a rating scale with the following response options: 0 = no difficulty, 1= mild difficulty, 2 = moderate difficulty, 3 = severe difficulty. The numerical labels for the response options suggest that there is a one-to-one correspondence between the ordered natural numbers and the response options. If true, this would produce an interval-level scale in which the difference between categories is interpretable. However, we do not know that the magnitude of difficulty that separates mild and moderate difficulty is the same magnitude as that which separates moderate and severe difficulty; the labels could just as easily be 0 = no difficulty, 2.3 = mild difficulty, 4 = moderate difficulty, 14 = severe difficulty. When the “space” between the points on rating scales is evaluated, it is often the case that the units vary in size.
In the CTT approach, interval-level measurement can be assumed if both the true latent trait and a set of observed scores are normally distributed. Although the latter can be evaluated, the former cannot, and making such an assumption is unreasonable in many circumstances. IRT makes no assumptions and instead models interval-level measurement, when the data fit the model, using the raw score-to-logit transformation. In the case of polytomous rating scales, each response option is modelled, so if the metric distance between “no difficulty” and “mild difficulty” is different from the distance between “moderate difficulty” and “severe difficulty”, that difference can be accounted for in the scoring of persons. The focus of IRT approaches at the item level and on the response options instead of the summed score results in more precise score estimates, improving the accuracy and efficiency of research.
Unidimensionality
The notion of “straight and level” is associated with the term “dimensionality” in measurement theory and our rock distance measure in a hilly area would be “multi-dimensional”, as it measures the distance between two points as well as changes in elevation between the two. Though both CTT and IRT assume unidimensionality – a single dimension of measurement – the assumption is usually given more attention in IRT. The ubiquity and conceptual accessibility of CTT undoubtedly contribute to this assumption being overlooked. Regardless of cause, ignoring this assumption results in less measurement precision, just as the rock measure of distance is less precise in a hilly context relative to a flat one.
If the rocks in our line are all the same size, our measurements could still be inaccurate if the rocks are not carefully arranged in a straight line and sitting on level ground. Though both traditional and modern measurement development methods assume a level and straight, or unidimensional, foundation, this property receives far more attention in modern approaches, and as a result, the accuracy of the assignment of values increases.
The most common way to evaluate dimensionality is through factor analysis, which produces linear combinations of observed variables based on the inter-correlations of items. This approached is used in both CTT and IRT paradigms, though more regularly in the latter. Highly inter-correlated items would be unidimensional, whereas variable item inter-correlations would be multi-dimensional. Parallel analysis is another approach to evaluate dimensionality that is paradigm agnostic (CTT or IRT). In addition to these, Principal Components Analysis (PCA) of the item residuals is often used in the Rasch paradigm. The residuals come from items that do not fit the model perfectly. The PCA is used to identify relationships between the items outside of the relationship accounted for by the IRT model. Additionally, item fit is related to dimensionality and represents the degree of discrepancy between observed responses on a given item and what was expected by the model. Item fit is unique to IRT because of the item-level focus of the analysis. Item misfit can arise due to a host of different measurement problems, including multi-dimensionality, poor item quality, or data quality errors.
Targeting and Person Separation
Targeting and person separation also contribute to the precision of measurement. Targeting, or coverage, means a good match between the distribution of persons and item logit scores. In a well-targeted sample, there will be groups of items wherever there are groups of persons. Well-targeted samples achieve high person separation, a reliability metric that reflects the reproducibility of person ability estimates. Low person separation in a sample indicates that the measure may not be not sensitive enough to distinguish between high and low performers.
Data Assumptions
IRT models have three basic assumptions. The first is unidimensionality, discussed above, and restated here as a single trait accounting for the respondent's performance on a set of items. This is an assumption of the vast majority of models, though some models assume that more than one trait underlies item responses and this assumption of multidimensionality is reflected in the mathematical formulation. Nearly all IRT models used to model health outcomes assume unidimensionality. The second assumption is local independence, which means that there is no relationship between items that is unaccounted for by the IRT model. In other words, the respondent's performance on an item reflects only the respondent's latent trait ability and characteristics of the item. The final assumption is monotonicity, which means that the probability of more extreme or greater responses on an item corresponds with a greater amount of the latent trait being measured. For example, there should be a correspondence between higher levels of depression and more extreme (e.g., nearly all of the days) categories on the item rating scales.
The sample size requirements for IRT analyses depend upon the structure of the data, the missingness in the data, and the IRT model used in calibration. Reasonable precision may be obtained using simple data structures and simple models with 100–150 respondents, whereas more complex data structures and complex models require a minimum of 1000 respondents. IRT models are generally robust to missing data.
Findings of Prior Studies of the EAT-10
The EAT-10 is a 10-item, self-administered, symptom-specific outcome instrument for dysphagia (Belafsky et al., Reference Belafsky, Mouadeb, Rees, Pryor, Postma, Allen and Leonard2008). The 10 items are rated on a 5-point rating scale (0–4) with labels “0 = No problem” and “4 = Severe problem”. Table 3 displays the EAT-10 item stems.
Item Fit and Point-Measure Correlation for All Observations

The initial validation of the EAT-10 was conducted by Belafsky and colleagues (Reference Belafsky, Mouadeb, Rees, Pryor, Postma, Allen and Leonard2008). Initially, clinicians wrote 20 items that were subsequently reduced to 10 after the least reliable and most redundant items were identified in a clinical sample using test-retest and inter-item correlations, respectively. The 10 items were administered to 100 healthy volunteers to define the upper limit of normal, which was defined as 2 SD from the summed score mean. Test-retest reliability, internal consistency, and validity of the EAT-10 were evaluated in a clinical sample using Pearson product-moment coefficient, Cronbach's coefficient alpha, and responsiveness to intervention, respectively. The results indicated that the EAT-10 demonstrated reasonable intra-item test-retest coefficients (0.72 to 0.91), high internal consistency (0.96), and statistically significant change between pre-treatment (19.87 ± 10.5) and post-treatment (5.2 ± 7.4) scores in group of patients with dysphagia.
Subsequently, Rasch-model IRT analysis of the EAT-10 was performed by Cordier et al. in a population of persons with oropharyngeal dysphagia receiving evaluations at outpatient dysphagia or otorhinolaryngology clinics in Italy, Spain, Sweden, and Turkey (Cordier et al., Reference Cordier, Joosten, Clavé, Schindler, Bülow, Demir and Speyer2017). They reported on rating scale validity, operationalized as monotonically increasing scores, on the fit of persons and items to the model, on the dimensionality of the measure, on differential item functioning, and on floor and ceiling effects of the measure.
There were several key findings from the Cordier et al.’s (Reference Cordier, Joosten, Clavé, Schindler, Bülow, Demir and Speyer2017) report. First, they found evidence that a subset of items had questionable fit with the model using standardized but not mean-square fit statistics and evidence that the measure was reasonably, if not strictly, unidimensional. Next, they found person separation <2 and 23% of the sample at the floor of the measure (i.e., a minimum possible score of 0), indicating that the measure inadequately differentiated levels of oropharyngeal dysphagia in the sampled population. Additionally, they noted monotonically increasing average measure scores, consistent with the assumption of IRT models, but large steps (relative to the centre of the rating scale) and disorder between the average item thresholds where adjacent categories are equally probable (i.e., Rasch–Andrich thresholds: the sum of (person measures−item measures)/count of observations in a category). Based on this disordering, Cordier and colleagues (Reference Cordier, Joosten, Clavé, Schindler, Bülow, Demir and Speyer2017) suggested that thought should be given to collapsing rating scale categories.
Worked Example
Our worked example is an extension of the Cordier et al.’s (Reference Cordier, Joosten, Clavé, Schindler, Bülow, Demir and Speyer2017) report in a new population of 1036 persons following surgical intervention of the cervical spine. The data set was complete (i.e., no data were missing). The mean age of the sample was 55.39 years (13.99), and included 543 females and 493 males. Data were analysed using joint maximum likelihood estimation in the Masters Partial Credit Model as implemented in Winsteps version 3.92.0.1.
Item Fit
Item fit is reported in many places in Winsteps. The output here was from Winsteps Table 14 and the IFILE output file. The last column of Table 3 displays the point-measure correlation (PTMZ), which is a Pearson correlation between the individual items and the measures of the respondents who received those scores. These PTMZs should be positive but the size of correlation is less indicative of fit with the model than fit statistics, which average the squared standardized residuals between actual and modelled data.
These all exceed 0.40, indicating the scores on the individual items accord with the average scores across the remaining items. The second and fourth columns display the mean-squared fit statistics (MNSQ) for infit and outfit, respectively. These indicate how well the item responses fit the model. Infit is more sensitive to unexpected response to items that are well targeted to the heart of the distribution of persons, whereas outfit is more sensitive to unexpected responses on items that fall at the extremes. The third and fifth columns display the standardized weighted (infit) and unweighted (outfit) MNSQ (ZSTD), respectively, which convert the mean-square into an approximate t-statistic that is less sensitive to sample size than MNSQ values. Misfit on MNSQ is generally indicated by values >1±0.4 and on ZSTD values >2.0. Larger, but not smaller, fit values compromise measurement and suggest deviation from unidimensionality.
Infit MNSQ thresholds (>1∓0.4) identified items 7 and 9 as misfitting, and outfit MNSQ thresholds identified items 1, 7, and 9 as misfitting. Infit (weighted) ZSTD thresholds (>±2.0) and outfit (unweighted) ZSTD thresholds identified items 1, 4, 7, 9, and 10 as misfitting. The misfit of items in the present study largely accords with the findings of Cordier et al. (Reference Cordier, Joosten, Clavé, Schindler, Bülow, Demir and Speyer2017), who also reported misfit with item 6. However, for these items (save item 6), the estimates reported by Cordier and colleagues (Reference Cordier, Joosten, Clavé, Schindler, Bülow, Demir and Speyer2017) were smaller, not larger, than expected and indicate “overfit” – the model predicts the data better than expected. Although overfitting items can result in inflated summary statistics, these very well-fitting items are usually retained in the analysis.
Dimensionality
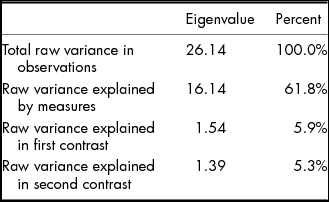
Analyses of dimensionality can be reported in many ways through Winsteps. The output here was obtained from Winsteps Table 23. Table 4 reports the Eigenvalues and percentage of variance in the data and that explained by the measures and by the first and second contrasts. Eigenvalues are items’ worth of data (total eigenvalues are equal to the number of items).
Raw Score Variance Explained in Total, by Measures, and by Principal Components of Item Residuals

Contrasts are “dimensions” in the item residuals – the “left over” variance unexplained by the Rasch “dimension”. Consistent with the analysis of Cordier and colleagues (Reference Cordier, Joosten, Clavé, Schindler, Bülow, Demir and Speyer2017), a single dimension accounts for most (16.14 Eigenvalue units; 61.8%) of the variance, and similarly, the first (1.54 Eigenvalue units; 5.9%) and second (1.39 Eigenvalue units; 5.3%) contrasts account for a small amount of unexplained variance.
We could conclude, using the cutoffs Cordier et al. (Reference Cordier, Joosten, Clavé, Schindler, Bülow, Demir and Speyer2017) used (>40% explained variance by the Rasch dimension; 2.0 Eigenvalue units), that despite being somewhat noisy, the EAT-10 is reasonably unidimensional and that the noise may be attributable to a number of items have content that contributes significantly to both noise and measurement. Another approach is to examine the content of the items in the contrasts to determine if the items with positive and those with negative loadings have something in common conceptually outside of their relationship with other items. The last column of Table 3 shows the PCA loadings of the item residuals on the first contrast with the negative loadings in bold typeface. However, this comparison does not appear to point to an obvious conceptual driver of the relationships between items. Additionally, Winsteps Table 23 shows correlations between item residuals. High positive correlations between item residuals may indicate local dependence between pairs of items, a violation of an IRT model assumption. In the present analysis, the correlations were all negative and none were larger than −0.26. Consistent with the conceptual comparison of items, it appeared that noise, rather than substance, was responsible for the unexplained variance.
Targeting and Person Separation
Targeting and person separation were examined and are available in Winsteps Table 3.1. This analysis indicated that 595 of the 1036 respondents had a minimum extreme score of 0. Accordingly, the mean logit score of the items was 0.00 (by default) and the mean score of persons was −4.22. Going back to our logit to probability relationship, the mean of persons in the sample has a 98.5% chance of being “above” (e.g., less dysphagia symptoms) the mean item threshold. This is akin to giving a first grade math test to eigth grade students – the measure is so easy that it is nearly uninformative with respect to differentiating the level of the latent construct (e.g., symptoms or math skills) for most of the sample. This floor effect was larger than that (23%) reported by Cordier and colleagues (Reference Cordier, Joosten, Clavé, Schindler, Bülow, Demir and Speyer2017), though differences in the prevalence of dysphagia between the populations seem to explain the differences. The person separation (0.86) and reliability (0.42) in the sample were, accordingly, low. Cronbach's coefficient alpha (internal consistency) was 0.95.
However, examination of the 441 (non-extreme) persons who reported some dysphagia symptoms or quality of life compromise suggested that the measure is better at differentiating levels of dysphagia among those reporting some burden. In this subpopulation, the difference between the item and person means was −2.31 logits, still large but better. The person separation and reliability estimates rose to 1.93 and 0.79, respectively. Therefore, within the subpopulation of persons reporting some dysphagia burden, the EAT-10 can distinguish nearly three statistically different levels of dysphagia burden ((4×1.93+1)/3 = 2.91; Wright & Masters, Reference Wright and Masters1982). These values are close to the rule-of-thumb minimum person separation (2.0) and reliability (0.80) values put forth in the literature and suggest that the EAT-10, perhaps with modifications, could reliably differentiate levels of dysphagia burden in a symptomatic population.
Ordering of Polytomous Categories
As mentioned above, Cordier et al. (Reference Cordier, Joosten, Clavé, Schindler, Bülow, Demir and Speyer2017) reported five distinct and correctly ordered categories when looking across the items. Though not reported, their choice to look across items may have been a result of their use of the Andrich Rating Scale Model (the default model in Winsteps), which models all items with the same rating scale. The approach taken in the present analysis was to model the data using the Masters Partial Credit Model, which allows the rating scale structure to vary from item to item, and then to look at the category ordering item-by-item. Also across item, Cordier et al. (Reference Cordier, Joosten, Clavé, Schindler, Bülow, Demir and Speyer2017) examined average item thresholds (relative to the centre of the rating scale) where adjacent categories are equally probable (i.e., Rasch–Andrich thresholds) and found large steps and disordering between the categories. Based on this disordering, Cordier and colleagues (Reference Cordier, Joosten, Clavé, Schindler, Bülow, Demir and Speyer2017) suggested that thought should be given to collapsing rating scale category 0 with 1 and 3 with 4 to produce a 3-point rating scale (i.e., 0,1,2 vs. 0,1,2,3,4).
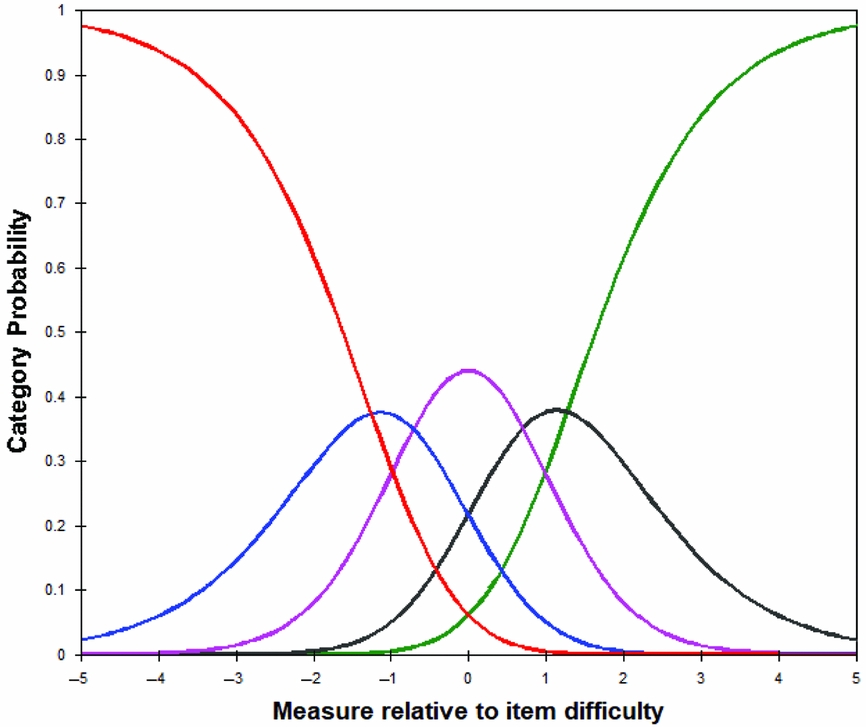
We examined the category probability curves for each item. The curves are model-based probability (y-axis) of observing each category of the response structure at each level of item difficulty (x-axis). Figure 2 shows the category probability curve for item 1.
Category probability curves for EAT-10 Item 1, “My swallowing problem has caused me to lose weight”.

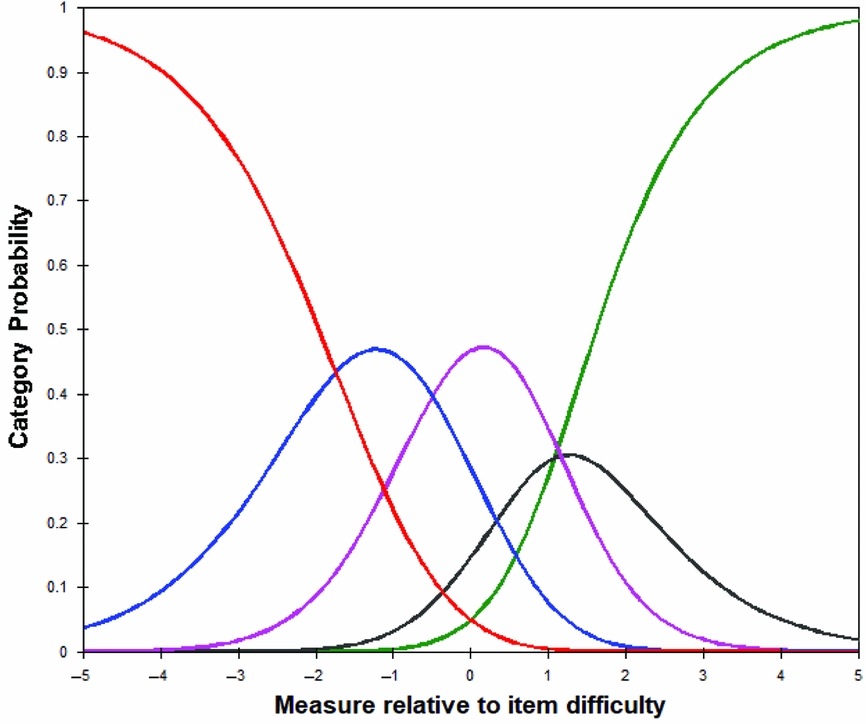
The colours correspond to the different rating scale options: 0 = red, 1 = blue, 2 = pink, 3 = black, 4 = green. The categories are ordered from 0–5 across the item difficulty; as the difficulty increases, the probability of greater degree of problem on the item also increases. Importantly, all categories are most probable at some point on the continuum. This correspondence between rating scale and item difficulty held for all items except items 3 and 8. Figure 3 shows the category probability curve for item 3.
Category probability curves for EAT-10 Item 3, “Swallowing liquids takes extra effort”.

It shows that all of the categories are logically ordered but that category 3 is not most probable at any point on the continuum (i.e., the black curve is smaller than adjacent curves at all points on the continuum). The curves for item 8 were nearly identical; showing that category 3 was never most probable and indicates that for items 3 and 8, collapsing categories 3 and 4 may improve precision of measurement. However, collapsing categories 3 and 4 across all items, as suggested by Cordier and colleagues (Reference Cordier, Joosten, Clavé, Schindler, Bülow, Demir and Speyer2017), risk losing information because category 3 was most probable in 8 of the 10 EAT-10 items. This analysis did not support collapsing categories 0 and 1 in any items.
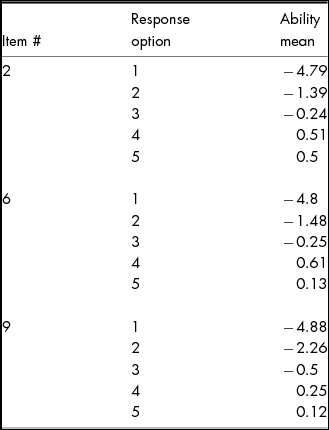
The average measure for a category is also used to evaluate rating scale functioning. This metric represents the model-estimated average ability, in logits, of persons who respond with that category on a particular item. The average measure increased monotonically for each item except items 2, 6, and 9. Table 5 shows the average measures for these three items, which can be obtained from many tables in Winsteps, including Table 14, as these were.
Average Measure of Persons (Relative to Each Item) Who Responded with Each Rating Scale Category

For each item, the average measure went down slightly between categories 4 and 5, suggesting that thought be given to collapsing these categories.
Concluding Comments
The application of the Rasch model to the EAT-10 yielded findings that were largely consistent with those of Cordier et al. (Reference Cordier, Joosten, Clavé, Schindler, Bülow, Demir and Speyer2017): the EAT-10 has a considerable floor effect, appears to measure a broad but single dimension, identifies just two levels of oropharyngeal dysphagia severity (high, low) in the subsample who report dysphagia symptoms, and EAT-10 items 1 and 9 fit the measurement model poorly. In addition, Cronbach's coefficient alpha, the CTT internal consistency metric, was estimated to be 0.95, nearly identical to the estimate of 0.96 reported by Belafsky and colleagues. The use of IRT modelling in this example sheds light beyond the estimate of the internal consistency of items and to elements that speak more directly to the precision of measurement.
Reflection on the concepts from the introduction is useful as we consider these results. First, the high internal consistency (0.95) is significantly influenced by the large percentage of the sample at the floor of the measure – there is a strong association between all of the zeros from respondents who are poorly targeted by the EAT-10. However, the zeroes tell us nothing about levels of the latent trait in a large percentage (57%) of the sampled population, and more zeroes would lead to higher alpha estimates but tell us even less about dysphagia in a similar population. Although floor and ceiling effects are understood as problematic in the CTT tradition, the construct of targeting (i.e., coverage) and the reflection of poor targeting in the person separation metric help quantify the problem. If we were to exclude the extreme scores and analyse only respondents with some burden, coefficient alpha would likely drop as a result of the increased variability in scores despite the improved ability of the measure to differentiate levels of dysphagia within the sample, as reflected by the increase in person separation reported for non-extreme respondents. Although there are approaches in the CTT tradition that could be used to understand these limitations of the EAT-10, they are used less often, perhaps because they are less commonly available in statistical packages or because those who are aware of these approaches are also aware of IRT models and the distinct advantages of this modelling approach over analogous routines in the CTT tradition.
Administering the measure to a symptomatic population would likely improve the targeting. The logistic transformation of raw scores by the IRT modelling may also help improve the precision of the measure. Additionally, the analyses of dimensionality and ordering of the rating scales suggest that further improvements may be possible by targeting a narrower, or perhaps more carefully defined unidimensional construct, by designing items that operationalise that definition and that are written in the voice of persons with dysphagia, and through careful consideration and empirical testing of the rating provided to rate item stems.
Acknowledgements
This work was supported by US Department of Veterans Affairs Rehabilitation Research and Development (J.K., grant number IK2RX000879).
Conflict of Interest
None.
Ethical Standards
The authors assert that all procedures contributing to this work comply with the ethical standards of the relevant national and institutional committees on human experimentation and with the Helsinki Declaration of 1975, as revised in 2008.