


Introduction
The polar oceans are changing in response to climate change, particularly the Arctic sea-ice cover during the summer season. Over the past few decades, Arctic sea ice has thinned, shifted from predominately perennial ice to seasonal (first-year) ice, and declined in extent at a rate of 13% per decade relative to the 1979–2000 average at the end of the summer melt period (Jeffries and others, 2013). The resulting increase in the absorption of shortwave radiation by the ocean tends to induce additional melt, and forms the basis of the positive ice albedo feedback. Severe storms, such as that of early August 2012, which destroyed 400 000 km2 of sea ice in just a few days (Reference ParkinsonParkinson and Comiso, 2013), are also occurring more often at high latitudes in both hemispheres, with increased fetches apparently triggering amplified wave activity within the marginal seas and along newly exposed coastal borders (Reference Young and ZiegerYoung and others, 2011). It is therefore crucial to determine whether a changing wave regime could further enhance ice retreat and thinning, through increased melt rates due to floe breakage and water movements, acting as an additional positive influence on ice albedo feedback.
Driven by these observations there has been a resurgence of interest in understanding how ocean waves interact with sea ice. The goal is to improve the accuracy of ice/ocean models, which have been unable to predict the recent fast decline of the Arctic sea-ice cover (Jeffries and others, 2013). The WIFAR (waves-in-ice forecasting for Arctic operators) project was a first attempt to integrate ocean waves into a coupled ice/ocean model (Reference SquireSquire and others, 2013; Reference Williams, Bennetts, Squire, Dumont and BertinoWilliams and others, 2013a,Reference Williams, Bennetts, Squire, Dumont and Bertinob). Momentum exchanges between ocean waves and sea ice are largely based on conservative physics, where ocean wave scattering by ice floes governs the dynamics of the system. This is achieved using the methods described by Reference Bennetts and SquireBennetts and Squire (2011), who consider wave propagation in a single horizontal dimension. While several wave vectors at different angles can be accommodated, they are independent so that transmission and reflection by ice floes is constrained to a single direction. This is a major simplification that is reasonable deep into the ice interior (Reference SquireSquire and others, 2009), but is likely to be imprecise within the marginal ice zone (MIZ), where the waves are thought to be multiply scattered in all directions by the constituent ice floes (Reference Wadhams and SquireWadhams and others, 1986). Each floe present will produce circular wavefronts that interact with the floes around it, to quickly produce a confused sea state that tends towards being isotropic in its directional composition, particularly when wave periods are low.
Three-dimensional (3-D) models, which incorporate multiple 2-D wave scattering, have been developed to study the attenuation of ocean wave energy in the MIZ (Reference Bennetts and SquireBennetts and Squire, 2009; Reference PeterPeter and Meylan, 2009; Bennetts and others, 2010). Wave attenuation is induced via linear conservative scattering processes only, producing an effective decay of the wave energy with distance from the ice edge, with no other nonlinear dissipative phenomena considered. However, these models had unrealistic periodicity imposed on the floe size distribution (FSD). Reference PeterPeter and Meylan (2009), in particular, developed a model in which small modules of floes are repeated periodically in one horizontal direction. The interaction theory employed within the modules bears some resemblance to the method used here.
In this paper we describe an energy-conservative model with no periodicity limitation and full randomization of the FSD. We use it to characterize wave reflection and transmission properties of a row composed of a few tens of circular floes, after averaging over many random realizations of the FSD, allowing us to eliminate features that relate to a particular realization. Our approach extends the single-row models proposed by Reference PeterPeter and others (2006) and Reference Bennetts and SquireBennetts and Squire (2008), which are based on a periodicity condition that causes the scattered waves to travel only at a finite number of angles determined by the floe spacing. For an arbitrary array, however, the full directional spectrum must be considered. The main mathematical challenge is to compute reflection and transmission wave characteristics for scattering by circular floes. We use an integral transformation to recast the circular waveforms into plane waves travelling at different angles, utilizing and extending methods originally developed for acoustic and electromagnetic wave scattering (Reference TwerskyTwersky, 1962; Reference Cincotti, Gori, Santarsiero, Frezza and SchettiniCincotti and others, 1993; Frezza and others, 2010). The approach is new for water waves travelling through an ice field and is particularly efficacious, as it allows the attenuation and directional evolution to be found simultaneously, by dividing up the propagation medium into strips. The theoretical aspects of the method are described in the following section.
The version of the model presented here is suitable to replicate the behaviour of ice edge bands, i.e. consolidated structures that form off the ice edge of the MIZ, which aroused considerable interest during the marginal ice zone experiment (MIZEX; Reference Martin, Kauffman and ParkinsonMartin and others, 1983; Reference WadhamsWadhams, 1983). While the origin and causal mechanism of ice edge bands are reasonably well understood (Reference WadhamsWadhams, 1983), few data exist that quantify band interactions with penetrating wave trains. Accordingly, this work is of geophysical interest, as bands are a frequent resident off the ice edge of certain MIZs. Useful data regarding the FSD of ice bands are provided by Reference Wadhams and SquireWadhams and others (1986), which we use to parameterize realistic ice conditions and simulate the propagation of a directional wave spectrum through the band.
After describing the numerical model in the next section, we conduct an analysis for a single row of floes with random perturbations from the regular array arrangement. We test the effect of randomizing the FSD and increasing the extent of the row on the transmitted wave energy. Results for a realistic ice band are then given, and qualitative agreement with the experimental data reported by Reference Wadhams and SquireWadhams and others (1986) is found.
Model
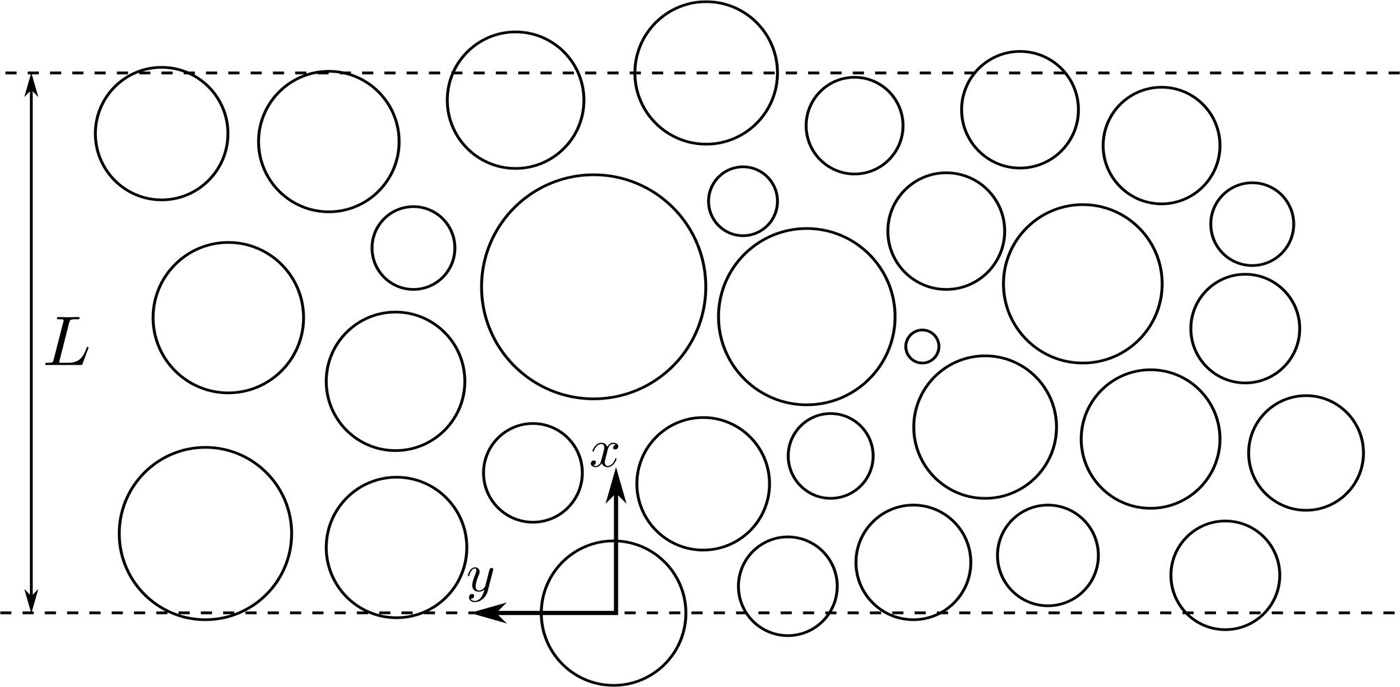
Consider a coherent band of sea-ice floes herded together at the surface of the ocean, which is assumed to have infinite horizontal extent and a finite constant depth, h. Cartesian coordinates x= (x,y,z) are used to position points in the fluid domain, with the z-axis pointing vertically upwards from the origin located on the fluid surface at rest. We assume that the ice floes are circular and vertically uniform, although we let their size, i.e. radius and thickness, and their position be arbitrary, with the restriction that they do not overlap. We conjecture that the idealized circular floe model represents a realistic ice cover if randomness is included and the results are averaged over many simulations. It is supposed that the wave/ice dynamics are governed entirely by conservative scattering effects, so that dissipative phenomena (e.g. friction, floe collisions, rafting, ice fracture and overwash) are not considered at this stage. The wave energy is therefore redistributed spatially due to scattering, but conserved for the whole system. Figure 1 shows a diagram of a typical ice band FSD. The lowermost floe has its centre located at the origin, without loss of generality, and we define the width of the band, denoted by L, as the x-coordinate of the centre of the uppermost floe. We let M denote the number of floes in the band and (xj, yj) be the coordinates of floe j, 1 <j<M.
Schematic of a typical band of ice floes with width L.
Governing equations
Under the standard assumptions of potential flow, for an incompressible fluid with density p = 1025 kg m 3, and assuming periodic motion with angular frequency ω>, we describe the fluid motion using a potential function defined as the gradient of the velocity field. It is written as where g≈ 9.81 m s 2 is acceleration due to gravity. The complex-valued function ϕ> satisfies Laplace’s equation

everywhere in the fluid, with V = (<9 x , dy).
Boundary conditions must be imposed on the seabed and on the fluid upper surface. Assuming no flow through the seabed, we have ∂zϕ = 0 on the plane z = h. The fluid upper surface comprises both open water and ice-covered regions. We invoke linear water wave theory at the free surface, which provides the condition

valid in open-water regions, where ω2/g is the deep-water wavenumber. We account for the flexural motion experienced by the ice floes under wave action, but neglect any form of horizontal motion. A standard hydroelastic model, based on thin-elastic plate theory, provides the corresponding condition

valid in the ice-covered fluid regions, for an ice floe with thickness D, density p i ≈ 922.5 kg m 3 and draught d = (ρ i /ρ)D. The stiffness parameter, β = F/ρg, is defined in terms of the flexural rigidity, F = ED 3/12(1 v2), where E ≈ 6GPa is the effective Young’s modulus for sea ice and v ≈ 0.3 is Poisson’s ratio. Further boundary conditions are applied to ensure that the bending moment and vertical shear stress of the floes vanish at their edges (e.g. Reference Montiel, Bennetts, Squire, Bonnefoy and FerrantMontiel and others, 2013). A radiation condition is also imposed in the far field, to ensure the decay of scattered wave components (e.g. Reference Montiel, Bennetts, Squire, Bonnefoy and FerrantMontiel and others, 2013).
Directional wave spectrum
A key goal of the present study is to analyse how angular spreading is affected by a band of ice floes. We consider a monochromatic wave forcing with normalized angular distribution, incident on the ice band from the negative x-axis. We set the directional spread of the incident wave as a standard cosine-squared directional spectral density function, S(τ), –π/2 < T < π2, i.e.

where τ is the angle with respect to the x-axis. The incident wave potential, (ϕIncan then be defined as a continuous superposition of plane waves travelling in different directions in (–π/2, π /2). The following integral representation follows naturally as

where k is the open-water wavenumber, i.e. the solution of the dispersion relation ktanhkh=α wave amplitude spectrum is defined as
Given the representation of the wave field used in Eqn (5), it is sensible to define the reflected and transmitted components that arise from scattering by the band, in the form

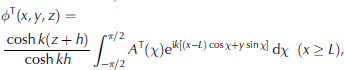
where ∆R(x) and ∆T(x) are the reflection and transmission spectra, respectively, which are unknowns of the problem and depend continuously on the wave direction, x,7r/2 < x < T / 2 . Note that the validity of the these expressions comes from the validity of the integral mapping used to derive the reflection and transmission spectra (Eqn (11) further below). We further decompose the transmitted spectrum into a scattered wave component, A T(x), and the contribution from the ambient field, such that. Also note that we have
neglected the effect of the evanescent wave components in these representations, as we are only interested in the reflected and transmitted energy.
Solution method
We first solve the multiple scattering problem in the band, using a standard interaction theory (e.g. Reference KagemotoKagemoto and Yue, 1986; Reference PeterPeter and Meylan, 2004), which states that the wave field incident on a floej, 1 < j < M, is the superposition of the ambient wave forcing and the scattered wave field from all the other floes present. We use local cylindrical coordinates (rj , # j , z), with origin at the centre of floe j, to parameterize the incident and scattered wave fields for floe j. The ambient wave forcing given by Eqn (5) is then expressed in terms of cylindrical harmonic functions as
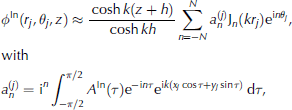
where Jn is the Bessel function of the first kind of order n and the infinite sum has been truncated to 2 N + 1 terms for computational purposes. N describes the number of angular modes. We also represent the scattered wave field for each floej in the form

where b *L, N < n < N, 1 <j<M, are unknown coefficients and Hn denotes the Hankel function of the first kind of order n. We have also assumed that the evanescent modes are negligible; the so-called wide-spacing approximation. The validity of this approximation was tested for the kind of geometry sketched in Figure 1, and we found an accuracy of four significant digits on the value of the coefficients bn, which is more than sufficient for the analysis conducted in this paper.
At this point, solving the scattering problem for a single circular floe is necessary to map the total incident wave field on floe j to the scattered wave field. We use a standard eigenfunction-matching method, which provides reasonable numerical accuracy for the present problem. The method is described by Reference Montiel, Bennetts, Squire, Bonnefoy and FerrantMontiel and others (2013), and also provides a solution in the ice-covered region. Note that evanescent modes were included to compute the single floe responses with sufficient accuracy.
Using the superposition principle from the interaction theory and Graf’s addition theorem yields a mappingbetween the unknown amplitudes, and the forcing matrix equation (Reference MontielMontiel, 2012)

The column vectors a and b have length M(2N+1) and contain the amplitudes an and bn, respectively. The mapping matrix, D, is usually referred to as the diffraction transfer matrix of the array. We have used a self-consistent approach, properly accounting for all the interactions between floes. The diffraction transfer matrix, D, differs from that derived by Reference PeterPeter and Meylan (2009) for a module, however, as the scattered field components due to each floe are expressed in the local coordinate systems of each floe, as opposed to being expressed in a global system, as was done by Reference PeterPeter and Meylan (2009).
The solution given by Eqns (9) and (10) is not compatible with the plane wave expression of the scattered field described by Eqns (6) and (7). Therefore, we use a plane wave representation of the cylindrical harmonic functions,
H n (krj ) exp (inθj), to obtain the necessary change of coordinates. Reference Cincotti, Gori, Santarsiero, Frezza and SchettiniCincotti and others (1993) give such a representa in the context of electromagnetic wave scattering. Adapting their expression to the present context, we have H n (krj ) exp (inθj)=
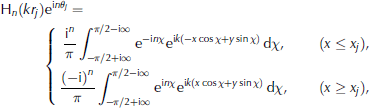
for each floe j. These expressions are valid along infinite lines parallel to the y-axis (i.e. for fixed x). In particular, we can express the reflected components from each floe on the line x = 0 and the transmitted components on the line x = L. Also note that the range of integration in Eqn (11) spreads into the complex plane. It can be shown, however, that for complex x the plane wave term decays exponentially. It is then reasonable to limit the integration range on the real line to ( {-π/2,π/2), by neglecting the contribution of the evanescent components.
We are now in a position to express the scattered wave field in the form of Eqns (6) and (7). Substituting Eqn (11) into Eqn (9) and using Eqns (10) and (8), we can obtain the integral mappings
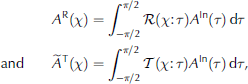
where R(X:T) and T(X:T)are the reflection and transmission kernels, respectively. The kernel functions, R/T, map an incident wave with angle T to a reflected/transmitted wave travelling at angle x.After some algebra, we obtain analytical expressions for the kernels
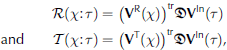
where VR x, VT x and VIn T are column vectors of length M(2N+1) with entries
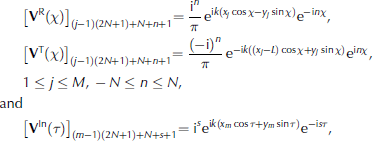
1≤m ≤M, -N≤s≤N, and the superscript tr indicates matrix transpose.
We obtain a numerical solution by discretizing the angular variables, x and T, in the range [- π/ 2, π / 2] with 2Na + 1 evenly distributed samples {x i = iπ/2N a, N a < i < Na}. We refer to Na as the angular sampling parameter. The reflection and transmission kernels thenbecome square 2 N a + 1, with entries

1 ≤p, q≤ 2Na+1. The discretized reflection and transmission spectra are calculated from Eqn (12) using standard numerical integration techniques (e.g. a trapezoidal rule).
Results
The model imposes no assumptions on the FSD in the band, except that the number of floes must be finite. This allows us to define the FSD randomly and generate results using ensemble averaging, given a certain ice concentration (relative surface area covered by sea ice). However, the computational cost increases significantly with the number of floes, thus limiting the extent of the MIZ that can be considered (solving the problem for >300 floes generally becomes impractical). Nonetheless, the present model is well suited for the ice band problem, which has a limited extent by nature. In this section, we first analyse the effect of both randomness and increasing the number of floes in a simple band setting, and then show results for more-realistic ice bands.
The amplitude spectra, ∆R(x) and ∆T(x), calculated from Eqn (12), provide information on both the angular distribution and energy intensity of the reflected and transmitted wave components. The total reflected and transmitted energies are given by

respectively, and are defined relative to the normalized incident energy. Energy conservation in the system yields ER + ET = 1, and provides a useful numerical check for convergence with respect to Na . Convergence of the results with respect to Na and N will be assumed throughout, ensuring an accuracy of four significant digits. The water depth is considered fixed at h=200m, which provides deep-water conditions for wave periods T ≤ 20s.
Single row: randomness and band extent
We consider first a single row of identical ice floes (with radius a and thickness D) with centres aligned along the y-axis and with constant centre-to-centre spacing, S = 300 m. We assume that there is an odd number of floes M = 2Nf + 1. The case Nf = 0 corresponds to a single floe centred at the origin and, for positive N
f, we add N
f floes on either side of the x-axis, so the problem is symmetric with respect to the x-axis. This regular array defines the reference geometry, from which random arrays are obtained by introducing a perturbation on the radius, thickness and position of each floe. We denote by e, a uniformly distributed random parameter taking values between 1 and 1. Then for each floe, j, N f <j< Nf, we define the radius  , the thickness
 and the centre position
 The parameters
 and
 control the variance of the associated distributions. In the following, results given for randomized arrays of floes are averaged over 50 simulations, unless otherwise specified.
Transmitted energy
We analyse the effect of randomizing the FSD and increasing the number of floes on the transmitted energy, (ET), where (X) refers to the ensemble average of a quantity X. We consider first an array with low concentration (∼20%). We set a = 75m, D=1.5m, ã = 2 5 m,  and e x = e y = 50 m. Figure 2a shows the transmitted wave energy plotted against wave period in the range T = 5-15 s, corresponding to wavelengths 40-350 m. Results are given for the regular array configuration
 and the random case, with the same mean properties as for the regular case. In each case, we vary the number of floes in the band with N
f = 0,1 and 50. Randomizing the FSD and averaging over many simulations removes the local maximum observed for the regular case at T « 6.8 s. The transmitted energy then gradually decreases for shorter periods without resonance or near-resonance effects, which characterize the response in the regular array problem.
Ensemble average of transmitted wave energy plotted against wave period for a floe concentration of (a) 20% and (b) 50%. We compare the responses of the regular and random arrays, for different values of N f, i.e. N f = 0 (dash-dotted and solid), N f = 1 (dotted and dashed) and N f = 50 (circles and squares).
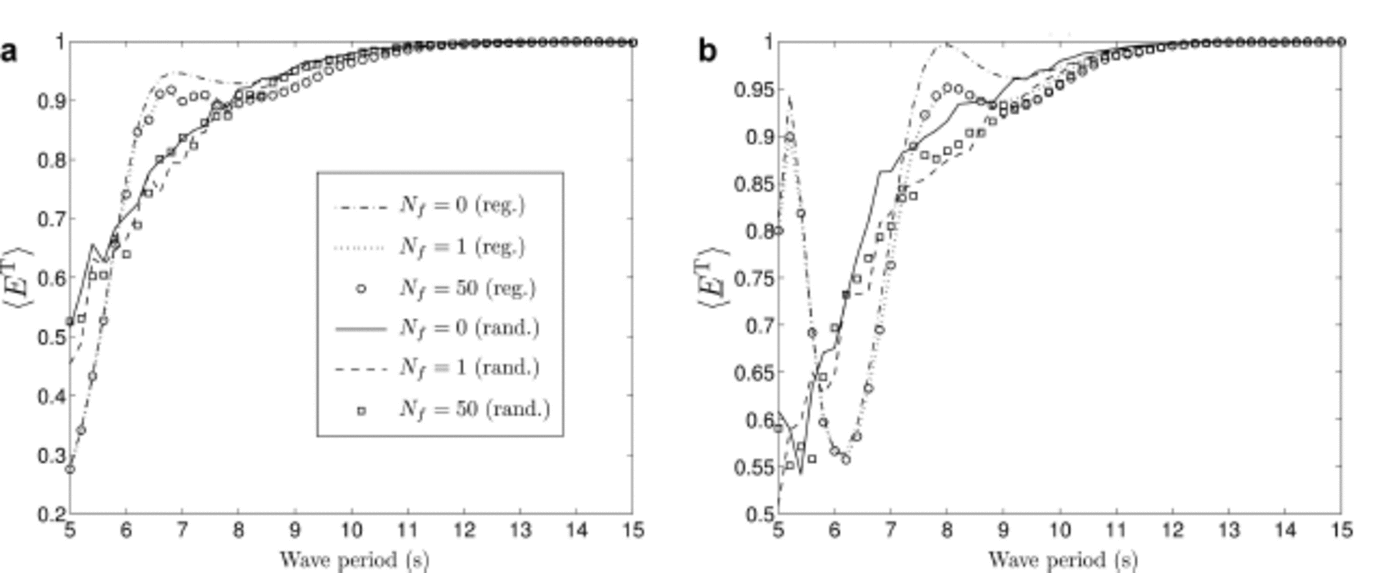
Increasing the number of floes in the array, we see that the transmitted energy converges surprisingly fast to the long-array response for both regular and random cases. The single floe case (N f = 0) already provides a reasonable approximation, and for three floes (N f = 1) the transmitted energy is very close to the response for 101 floes (N f = 50). This suggests that the spatial repartition of the scattered energy for a single row of floes is mostly governed by the single floe response. Multiple interaction effects within the row have little influence on how much wave energy travels through the row. However, the situation may be different when we consider multiple adjacent rows (future work), and will probably require us to take more floes to obtain a converged response.
In Figure 2b, we consider a denser FSD with a = 120 m, D = 1.5 m, ã = 10 m, D = 0.5 m and  In this case, the ice floe concentration is ∼50%. The response for the regular array case exhibits significant near-resonance features with local maxima at T «5.2 and 7.9 s and a minimum at T ≈ 6.2 s. Randomizing the FSD removes all these features, as in the previous example. We again observe that the single floe response is the main factor determining the amount of wave energy transmitted through the array, and only three floes are needed to account for multiple scattering effects.
The results obtained here suggest that wave-scattering properties in newly formed pancake ice fields, characterized by fairly regular floe sizes and thicknesses, differ from those in MIZ-type ice fields that have undergone significant erosion and which have a more diverse floe size distribution. A more thorough analysis of ocean wave propagation through different ice types is needed to understand these processes better.
Directional spectra
The total reflected and transmitted energies are average quantities over the whole directional spectrum. We now characterize the effect of randomizing and increasing the number of floes on the directional spreading properties of the transmitted energy, i.e. 〈|A T(x)| 2〉. For a random configuration, the symmetry with respect to the x-axis is broken in general, but taking an ensemble average over many simulations restores symmetry. To limit the number of simulations required to obtain symmetry, we only randomize the position of the floes, leaving radius and thickness fixed, i.e. a = D = 0.
We consider the low ice concentration case (∼20%) first, with a, D, x and y as before. In Figure 3a and b, the directional spectrum of the transmitted energy, 〈 |A T|2〉, is plotted over the angular range –π/ 2 < x < π/ 2, for the regular and random array cases, respectively. For each case, we vary the band extent (number of floes in the band), from 1 floe (N f = 0) to 51 floes (N f = 25). For the regular array arrangements, increasing the number of floes generates an oscillatory behaviour in the spectrum, which converges to the long finite array response quickly, i.e. for only 7 floes (N f = 3). The oscillatory behaviour makes sense, as it is well established that for an infinite regular array, the transmitted waves travel only at certain angles, called the scattering angles, determined by the spacing between the floes (e.g. Reference PeterPeter and others, 2006).
Ensemble average of the transmitted energy directional spectrum, 〈 | AT| 2〉, for four different band extents, Nf = 0, 1, 3, 25, under an incident spectrum (dotted curve) of period T = 6s. Spectra are given for the regular array configuration in (a) and (c), for ice concentrations 20% and 50%, respectively. Likewise, the corresponding spectra for random arrays are plotted in (b) and (d).
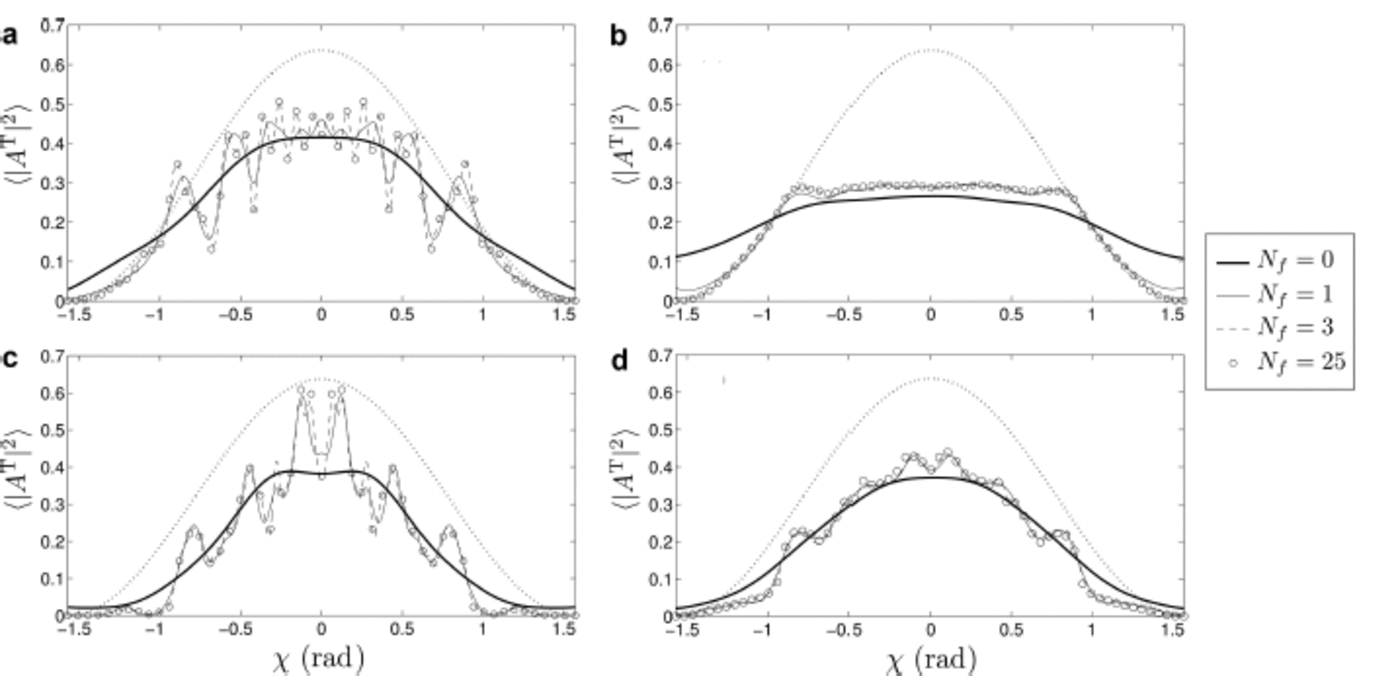
In the random array case, the oscillations disappear due to the averaging process. As a consequence, the convergence is quicker, with only 3 floes (N f = 1) required to approximate the long array response over most of the angular domain. We observe a quasi-flat spectrum in the angular range (1, 1 ) rad, suggesting that an isotropic transmission of the energy occurs there. This means that, statistically, there is no preferred direction of propagation in this sub-domain. Outside this angular range, the transmitted spectrum follows the incident spectrum closely, so that the array does not influence wave transmission in a statistical sense.
Figure 3c and d show the same transmitted spectra for an ice concentration of 50%. For the regular array case, we again observe the oscillatory behaviour associated with the scattering angles of the periodic structure, but unlike the low-concentration example, the oscillations persist when we randomize the FSD, although they are significantly dampened. We conjecture that this is due to the lower variance of the random perturbation in the high-concentration case (x = ỹ = 10m), so that the floes have less freedom to be positioned away from the mean value compared with the low-concentration arrays, for which we have x = y = 50 m. The difference in variance also influences the number of simulations required to approximate the ensemble average accurately. In practice, the convergence was determined, so the symmetry of the transmitted spectra inherited from the symmetry of the average FSD would be preserved. For the low-concentration case, we had to perform 3000 simulations to obtain symmetry, while for the high-concentration case, only 500 simulations were required. It is remarkable that, again, the long array response can be approximated with only 3 floes for the random array case. However, we expect that more floes will be needed for incident directional spectra that are less smooth than the one considered here.
Realistic band
We now model the propagation of a directional wave spectrum in a band of ice floes, reconstructed from field data provided by Reference Wadhams and SquireWadhams and others (1986). The data are used to approximate a realistic ice band and test it for energy transmission using our model. We do not perform a quantitative comparative analysis between experimental data and numerical results in this paper, as morphological and physical property data are not presented to a sufficient level of detail by Reference Wadhams and SquireWadhams and others (1986).
The experimental measurements were conducted as part of the MIZEX-84 campaign and took place in the Greenland Sea in June-July 1984. A band experiment was performed, in addition to more traditional attenuation experiments in the MIZ. The authors placed a wave buoy on each side of the band to record the incoming spectrum and the transmitted spectrum. The ice band extent (in the y-direction in our model) was ∼15km, and its width varied between 230 m (narrowest) and 1.3 km (widest). A schematic diagram provided by Reference Wadhams and SquireWadhams and others (1986) suggests that the wave buoys were located around the narrowest part of the band, which was composed of about six rows of floes. In their paper, the FSD is provided after binning the floe properties into five categories for computational purposes. The bins are defined by their characteristic radii, 6.25, 12.5, 17.5, 27.5 and 50m, and proportions of the total ice-covered surface area, 20, 30, 30, 10 and 10%, respectively. The thickness is set to D = 2 m for all floes. No information is given regarding the ice concentration in the band, although we expect that it will be high (>80%), as ice edge bands are known to be densely packed structures (Reference WadhamsWadhams, 1983).
In our model, we construct the arrangement of floes using a rectangular grid of 6 x 15 square cells. We then randomly place 1 floe per cell from the FSD defined earlier, although we discard floes with radii 25.7 and 50 m, as they only account for 1.5% and 0.4% of the total number of floes, respectively. Choosing the cell size to be 35 m, we obtain an array of floes with 35% ice concentration. We acknowledge that our rectangular grid method is not ideal to define highly concentrated arrangements of floes, but it allows us to include randomness relatively easily. The incident directional wave forcing is the same as that considered in the previous section.
Figure 4a shows the ratio of transmitted to incident-plus-reflected energy, denoted E, by the ice band in the range of wave periods T=3-10s. This is the quantity plotted by Reference Wadhams and SquireWadhams and others (1986) to analyse wave energy attenuation by the band. The solid curve is the averaged energy ratio from 50 random realizations of the band, specified by the FSD described above. We observe a relatively smooth increase in the transmitted energy from ∼10% for short waves to full transmission for long waves. Qualitatively, our results are similar to those provided by Reference Wadhams and SquireWadhams and others (1986, Fig. 18), as the transition from full reflection to full transmission occurs in the same frequency range. Quantitatively, however, our results seem to consistently overestimate the transmitted energy, which is likely to be explained by the difference in ice concentration. Higher ice concentration tends to magnify scattering effects and therefore lowers the transmitted wave energy, which is consistent with our conjecture for the discrepancy.
Analysis of the transmission properties of the wave energy averaged over many random representations of the ice band. (a) The ratio of transmitted to incident-plus-reflected energy, he E}, plotted against wave period. Responses obtained from our 3-D model and the 2-D model of Reference Bennetts and SquireBennetts and Squire (2011) are compared. (b) The directional spectrum of the transmitted energy for wave periods T =3,5,7 and 10s. The incident spectrum (dotted line) is shown for reference.
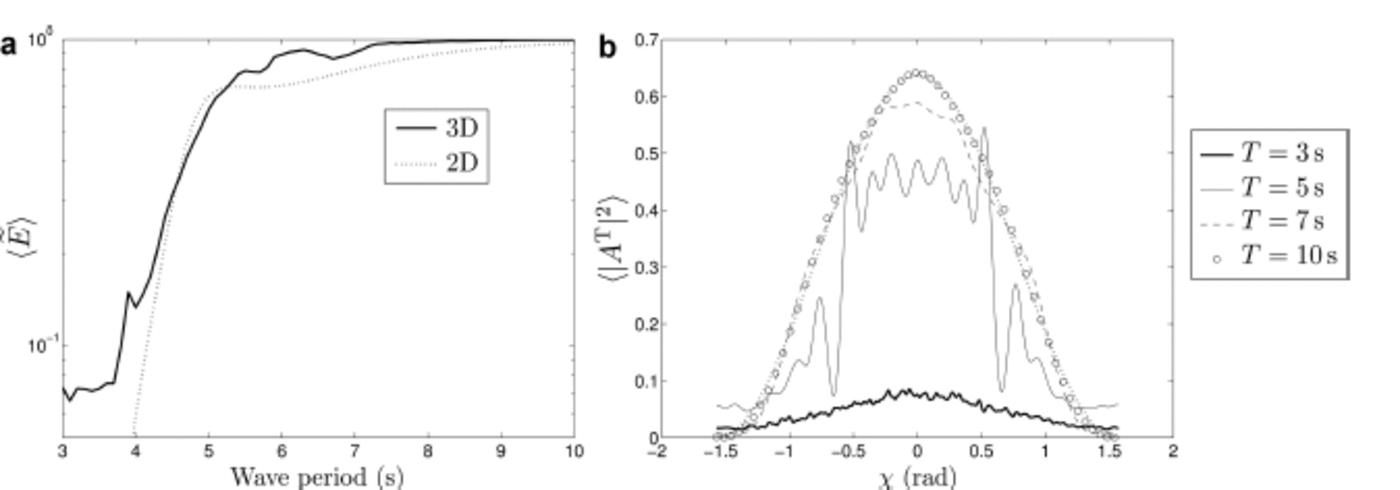
We compare our results with the response provided by the 2-D model of Reference Bennetts and SquireBennetts and Squire (2011) (dotted line), calibrated using binning in the FSD, as described above. We observe a general good agreement in the mid- and low-frequency range. The models differ significantly for low periods (T< 4 s ), however, as the 2-D model predicts ∼100% reflection, while our 3-D model allows for a small proportion of transmitted energy, which is more consistent with observations reported by Wadhams and others (1986). In addition, including wave directionality in the model eliminates certain features, such as the local maximum in transmitted energy at T « 5.2 s seen in Figure 4a for the 2-D model. More work is needed to fully understand the influence of wave directionality on the attenuation of ocean wave energy in the MIZ.
We then analyse how the wave directional spectrum is affected by travelling through the ice band. Figure 4b shows the directional spread of the transmitted energy for different values of the wave period, each of which is averaged from 200 simulations. For long waves (T = 7 and 10s), the wave field travels through the band almost unaffected, as suggested by Figure 4a (hE T) > 90%), and the transmitted spectrum is similar to that of the incident waves. For T = 5 s, the directional spread of the transmitted energy has an oscillatory nature, similar to that observed for regular arrays in the previous section. Evidently, the wave field responds to an underlying regular structure of the FSD at this frequency, but we cannot provide a conclusive explanation for this behaviour. We note, however, that the wavelength (∼39 m) is similar to the mean spacing between the floes (35 m), which could explain the strong interaction between the wave field and the band.
For short waves (T = 3 s), much of the wave energy has been reflected (〈E T〉≈10%). We also observe that the transmitted directional spectrum becomes almost isotropic, although it still peaks around the normal direction. This phenomenon is typical of wave propagation in the MIZ, as reported by Reference Wadhams and SquireWadhams and others (1986). For such short waves, multiple scattering effects become chaotic within the band, and the ensemble average does not favour a particular direction at which the transmitted wave will propagate. For wider regions of sea ice, we expect all frequency components will eventually become isotropic at a certain distance from the ice edge, along with a concomitant reduction in wave amplitude.
Conclusions and Future Outlook
We have devised a new model of wave scattering by a small array of arbitrary circular ice floes, which provides the angular characteristics of the waves reflected and transmitted by the array. Important new features are (1) the ability to consider an ambient wave forcing with a realistic continuous directional spread and (2) the possibility of computing the ensemble average of the reflected and transmitted wave properties by randomizing the floe size distribution in the array. The solution method combines the self-consistent interaction theory for 2-D multiple scattering and the plane wave integral representation of circular wave components. We express the reflected and transmitted waves as a continuous superposition of plane waves travelling in all directions of the angular range. A numerical solution is obtained by discretizing the angular spectrum.
We analysed results for a single row of floes perturbed from the regular arrangement. The main findings are summarized as follows:
Computing an ensemble average for the perturbed array over many random simulations eliminates near-resonance features of the transmitted energy and dampens the oscillatory behaviour of its directional spread, both of which are observed in the regular array case.
The long array response can be approximated surprisingly well with just a small number of floes for both regular and random arrays. This suggests that the spatial repartition of the scattered energy is mainly governed by the single floe response, i.e. multiple scattering has very little effect for the single row geometry. We conjecture that it is a feature of the smooth incident wave spectrum, which peaks along the normal direction, with much less energy travelling at large angles. We expect that more floes will be needed for more perturbed spectra. This behaviour may also be different for non-circular floes.
Results were also obtained for a realistic ice band, parameterized using data provided by Reference Wadhams and SquireWadhams and others (1986). Qualitative agreement has been found for the transmitted energy in the swell-wave frequency range, while significant discrepancies in ice floe concentration did not allow us to reproduce the experimental data quantitatively. For short waves, we showed that the transmitted directional spectrum becomes nearly isotropic, in agreement with observations reported by Reference Wadhams and SquireWadhams and others (1986).
The present paper is a first step towards constructing a cell-based wave/ice interaction model with 2-D scattering for use in integrated Arctic system models such as TOPAZ (Reference Sakov, Counillon, Bertino, ter and KorablevSakov and others, 2012) and oceanic general circulation models such as that in the NEMO framework. NEMO (Nucleus for European Modelling of the Ocean) is a state-of-the-art multinational modelling framework for oceanographic research, operational oceanography seasonal forecast and climate studies (http://www.nemo-ocean.eu/). In future studies, our goal will be to extend the single row approach to include multiple strips of ice floes. This will effectively allow us to study large-scale MIZs composed of thousands of floes, under the same deterministic framework.
Acknowledgements
The work described in this paper is embedded in the US Office of Naval Research (ONR) Departmental Research Initiative ‘Sea State and Boundary Layer Physics of the Emerging Arctic Ocean’. The authors are grateful to ONR Award No. N00014-131-0279 and to the University of Otago for financial support. L.G.B. acknowledges funding support from the Australian Research Council (DE130101571) and the Australian Antarctic Science Grant Program (Project 4123).



