Introduction
Snow is a dominant feature on the Antarctic landscape. While most of Antarctica is covered by permanent ice, small coastal areas do become snow-free during the summer months. In the future, these could be expanded by a warming climate, such as has been observed in areas of West Antarctica (Anisimov et al. Reference Anisimov, Vaughan, Callaghan, Furgal, Marchant, Prowse, Vilhjálmsson and Walsh2007). Byers Peninsula on Livingston Island, South Shetland Islands, is one of the largest ice-free areas of Maritime Antarctica (Thomson & López-Martínez Reference Thomson and López-Martínez1996). In this region, annual precipitation is higher than on continental Antarctica (Van Lipzig et al. Reference Van Lipzig, King, Lachlan-Cope and van den Broeke2004), and typically ranges from 700–1000 mm (Bañón Reference Bañón2004).
Snow is a dynamic medium that changes continuously and forcing processes operate at multiple scales. Small research areas studied in detail may exhibit extreme heterogeneity, while larger research areas studied in less detail may exhibit patterns and homogeneity (Blöschl Reference Blöschl1999). For Antarctica, a limited number of studies have examined the spatial distribution of snow and most have focused on continental Antarctica, such as Dronning Maud Land (e.g. Richardson-Näslund Reference Richardson-Näslund2004, Vihma et al. Reference Vihma, Mattila, Pirazzini and Johansson2011). Station meteorological data have been collected along the Antarctica Peninsula and used to determined snowpack sublimation and drift in regional atmospheric models (e.g. Van Lipzig et al. Reference Van Lipzig, King, Lachlan-Cope and van den Broeke2004) or in Maritime Antarctica for energy balance studies of the King George Island ice cap (e.g. Bintanja Reference Bintanja1995, Braun & Hock Reference Braun and Hock2004).
To date, no data have been published on the distribution of snow in Maritime Antarctica. In this study snowpack data were collected on Byers Peninsula in late November 2008 as part of a Spanish Polar Commission contribution to the International Polar Year. This paper presents the distribution of snow depth and since the variation of snow density is often assumed to be limited across a watershed (Elder et al. Reference Elder, Dozier and Michaelsen1991), the density variation down the snowpack will be presented for five different locations.
The distribution of snow
Much of the research examining the distribution of snow has focused on mountainous regions. Meiman (Reference Meiman1968) presented the correlation between snow accumulation patterns and topographic variables (elevation and aspect) as well as forest canopy properties. Subsequent research has used topographic variables as surrogates for the meteorological variables that dictate the distribution of snow in alpine regions (Elder et al. Reference Elder, Dozier and Michaelsen1991, Winstral et al. Reference Winstral, Elder and Davis2002). Various methods have been used to relate topography with the distribution of snow, such as binary regression trees (Elder et al. Reference Elder, Dozier and Michaelsen1991) and geostatistics (Erxleben et al. Reference Erxleben, Elder and Davis2002). A comparison of interpolation methods often illustrates that the optimal method is location specific (Erxleben et al. Reference Erxleben, Elder and Davis2002, López-Moreno & Nogués-Bravo Reference López-Moreno and Nogués-Bravo2006).
Snow sampling has occurred at several location across the Arctic. The distribution of snow has been investigated in areas such as the Canadian Archipelago (e.g. Woo Reference Woo1998) and Svalbard (e.g. Bruland et al. Reference Bruland, Sand and Killingtveit2001, Winther et al. Reference Winther, Bruland, Sand, Gerland, Marechal, Ivanov, Glowacki and König2003). The work in the Canadian high Arctic focused on watersheds of about the same size as the Byers basin, while much of the Svalbard work focused on larger areas where elevational gradients dictate accumulation amounts (Winther et al. Reference Winther, Bruland, Sand, Gerland, Marechal, Ivanov, Glowacki and König2003). An important difference between the Arctic regions and this study site is that the Arctic sites are located closer to the pole and receive substantially less solar radiation with no sunlight for several months during the winter. The Canadian sites are also much drier with only a fraction of the annual precipitation (100–200 mm vs 700–1000 mm) typical for Byers Peninsula. The present study considered the influence of solar radiation, which can be important for metamorphism during accumulation and specifically for ablation.
Very limited vegetation is present in Maritime Antarctica. With the absence of trees and shrubs, strong winds can play a significant role in snow distribution through sublimation, wind scour and deposition (Essery et al. Reference Essery, Li and Pomeroy1999, Winstral & Marks Reference Winstral and Marks2002, Erickson et al. Reference Erickson, Williams and Winstral2005). For less rugged terrain with limited large vegetation, such as the Canadian prairies, slope and curvature have been shown to influence local meteorological conditions that drive the distribution of snow (Lapen & Martz Reference Lapen and Martz1996).
Since the Byers Peninsula may be different from alpine or prairie regions where the distribution of snow has been examined, the objectives for this paper are: 1) to determine the topographic variables controlling the presence (snow-covered) or absence (snow-free) of snow, and 2) to determine the topographic variables controlling the distribution of snow depth (within the snow-covered area).
Study site
The Lake Limnopolar basin is a small tundra watershed (Fig. 1) located at c. 62°40′S, 60°5′W on Byers Peninsula on the west side of Livingston Island, South Shetland Islands, Antarctica (Quesada et al. Reference Quesada, Camacho, Rochera and Velázquez2009). Byers Peninsula is of interest for climate change research since it started deglaciating in the last 5000 years with the most recent retreats occurring c. 400 years ago (Björck et al. Reference Björck, Hjort, Ingólfsson, Zale and Ising1996). The western terminus of the Rotch Dome ice cap that covers Livingston Island is 6.5 km to the east of the watershed.
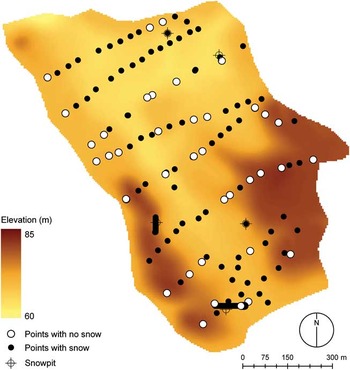
The distribution of elevation and the location of the snow depth measurements (snow-covered and snow-free) and the snow pits.

Livingston Island has a much less extreme climate than continental Antarctica. Mean summer temperatures range from 1–3°C with daily maximums and minimum being ± 10°C (Rochera et al. Reference Rochera, Justel, Fernández-Valiente, Bañón, Rico, Toro, Camacho and Quesada2010). Winter temperatures remain colder than 0°C with lows reaching -27°C (Rochera et al. Reference Rochera, Justel, Fernández-Valiente, Bañón, Rico, Toro, Camacho and Quesada2010). The region is snow-covered for eight or more months of the year with some perennial snowpacks. Winds blow mostly from the west with average speeds from 5–15 m s-1 during peak accumulation (Fassnacht et al. Reference Fassnacht, Toro Velasco, Meiman and Whitt2010).
Methods
Snow data
Snow depths were measured across the Lake Limnopolar basin in late November 2008, representing peak snow accumulation at the site (Figs 1 & 2). At this time, snowpack in the catchment usually exhibits large spatial variability and terrain characteristics exert a strong control on its distribution. At each measurement location, five snow depth measurements were taken as four points in a 2 m plus pattern from a centre point. Each snow depth was measured to the nearest cm using an aluminium depth probe with the global positioning system (GPS) location (in UTM co-ordinates with elevation) recorded at the centre point. Replicates were taken to negate the effect of local anomalies related to microtopography, stones, or the erroneous perception of reaching the ground surface when encountering a frozen layer. The final depths were obtained by averaging the five measurements, while rejecting the individual measurements with a bias greater than 25% compared to the other four (e.g. López-Moreno et al. Reference López-Moreno, Fassnacht, Beguería and Latron2011). A random sampling strategy was adopted to obtain a large number of measurements avoiding sectors with difficult access due to topography and to provide greater flexibility in handling the heterogeneity of the snowpack.
Snow pits were dug at five locations across the watershed. At each snow pit, density was measured in 10 cm intervals using a 1 litre wedge cutter. Each density sample was weighed after extraction. For a particular 10 cm interval, a minimum of two samples were taken. If the difference in mass of the second sample was more than 10 g (or a density of 10 kg m-3) compared to the first sample, a third and possibly a fourth sample was extracted. Snowpack temperature was measured to the nearest 0.5°C at the same 10 cm interval using a dial-stem thermometer. Different snowpack layers were identified visually and manually from changes in hardness. For each layer the snow grain shape (fresh, rounded, sintered, faceted or ice layer) and average grain size was recorded.
Digital elevation model
A digital elevation model (DEM, Fig. 1) was created primarily by transect data collected in 2006 across the study area using a total station. These data were supplemented by three additional sets of points collected with GPS units: a sequence of points along the boundary between the snow-covered (C) and snow-free (F) areas, points at high elevations within the F areas including along the watershed divide, and points at the centre of the snow depth measurements. For the last set of points, the GPS elevation was lowered by the snow depth. It should be noted that the stated GPS horizontal accuracy was 3–4 m, which is good for non-survey grade units. While the absolute error in the elevation is unknown, the relative error is assumed to be small. Also, the points collected with the GPS units were examined and all anomalous elevations, compared to the total survey station data, were removed. The DEM was derived on a 2 x 2 m grid size using the triangulated irregular network (TIN) interpolation procedure available in the ArcGIS 10.0 software package.
Topographic variables
Terrain parameters used as predictor variables of C and F areas were subsequently derived from the DEM. The selection of potential predictors was based on their ability to affect the rain/snow limit, the motion of fresh snow (i.e. wind drift), and snow ablation. The selected independent variables were:
a) Elevation (Fig. 1), which determines the type of precipitation (solid or liquid) and the evolution of melting in a given area (Caine Reference Caine1975, Balk & Elder Reference Balk and Elder2000). At the local scale investigated here there is a limited elevational gradient (Fig. 1) and elevation is probably a surrogate for redistribution and snowmelt energetics.
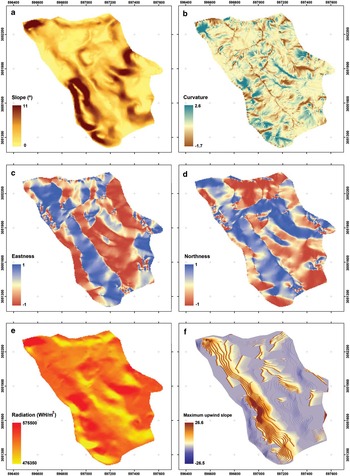
b) Slope (Fig. 2a), which is recognized to affect snow redistribution processes (Mittaz et al. Reference Mittaz, Imhof, Hoelze and Haeberli2002).
The distribution of key topographic variables that will be used as surrogates for the meteorology driving the distribution of snow across the Lake Limnopolar watershed. a. Slope, b. easting, c. northing, d. curvature, e. relative solar radiation, and f. maximum upwind slope.

c) and d) Geographic location given as eastness and northness (Fig. 2b & c), informed on the east–west and north–south orientations of the slopes, respectively. These variables were quantified via the sines and cosines of the aspect, respectively, in a procedure that converted the linear units of the aspects (from 1–360) to circular units (from 1 to -1). Both variables, which logically have co-linearity with potential incoming solar radiation, were introduced as predictors because they potentially reflect the effects of snowdrift or deposition by wind (López-Moreno et al. Reference López-Moreno, Latron and Lehmann2010).
e) Mean curvature (Fig. 2d), which was used to identify concave and convex areas of the catchment. Landscape curvature, defined as the derivative of the rate of change of the landscape, helps to quantify the shape of the landscape surface. Mean (or overall) curvature is a combination of profile and planiform curvature, and is useful for determining local high and low points. This parameter may play an important role in snowdrift or the deposition of fresh snow by wind, as well as introducing local modifications into the distribution of incoming solar radiation (López-Moreno et al. Reference López-Moreno, Latron and Lehmann2010).
f) Average solar radiation (RAD as Fig. 2e), received by each cell of the DEM from April–November under clear-sky conditions. This parameter was obtained from a physically based computational model (implemented in the MIRAMON GIS software) that considers the effects of terrain complexity (shadowing and reflection), including slope angle and aspect variables. A detailed description of the model can be found in Pons & Ninyerola (Reference Pons and Ninyerola2008). Typically the radiation data are presented in watt-hours per square metre (Wh m-2). However, while many snow distribution studies in alpine areas use clear-sky radiation, the study site is dominated by cloud cover, and since the amount of cloud cover was not included, solar radiation was reported from maximum to minimum as cloud cover only scales the computed amount. This is further justified since the study basin is small and the solar radiation blockage can be assumed to be uniform across the entire basin.
g) Maximum upwind slope (Winstral et al. Reference Winstral, Elder and Davis2002), which was used to quantify the extent of shelter or exposure provided by the terrain upwind of each pixel on the prevailing wind direction (Fig. 2f). For this study, it was calculated for an azimuth of 260, determined from a wind rose compiled for the Limnopolar meteorological station (Fassnacht et al. Reference Fassnacht, Toro Velasco, Meiman and Whitt2010).
Data analyses
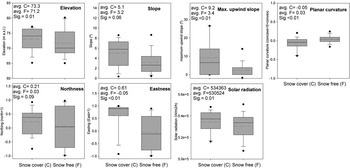
For a first attempt to elucidate the topographic control on the spatial distribution of C and F areas, we compared the topographic characteristics of C and F points sampled during the snow survey (Fig. 3a–g). The existence of statistically significant differences was assessed by means of the Wilcoxon Mann-Whitney test (Siegel & Castelan Reference Siegel and Castelan1988). Although the Wilcoxon Mann-Whitney test is slightly less powerful than parametric tests such as the t-test, it was preferred here because of its robustness against non-normality of the variables (Helsel & Hirsch Reference Helsel and Hirsch1992).
Box plots of the topographic characteristics found in snow-covered (C) areas and snow-free (F) areas, including the average values for C and F areas plus the statistical significance of the difference between samples based on the Mann-Whitney test for the variables presented in Fig. 1.

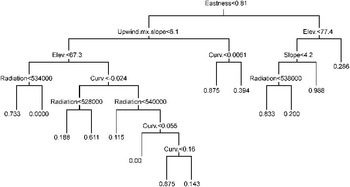
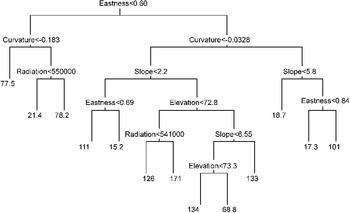
The prediction of C and F areas, and snow depth distribution areas from terrain characteristics were done using regression tree models. Binary regression tree models are non-parametric methods based on the recursive splitting of the information from the predictor variables in order to minimize the sum of the squared residuals obtained in each group (Breiman et al. Reference Breiman, Friedman, Olshen and Stone1984). To apply a regression tree model, the size of the tree must first be selected since fitted trees may be more complex than is warranted by the available data (Anderton et al. Reference Anderton, White and Alvera2004). An excessive number of nodes hinders the environmental interpretability of data splits. Here, we considered that the inclusion of a new node should contribute to a reduction in unexplained variance by at least 5%. Regression tree models also provide an alternative to the assumption of linearity in relationships between the response variable and the physical characteristics of the terrain (Anderton et al. Reference Anderton, White and Alvera2004, López-Moreno et al. Reference López-Moreno, Nogués-Bravo, Chueca-Cía and Julián-Andrés2006). For modelling the distribution of C and F areas (Fig. 4), the response variable is binomial (0 and 1, for F and C respectively), and the tree models provide the probability of the existence of snow cover ranging from 0 to 1. In the case of the snow depth (Fig. 5), the response variable, and hence the prediction, are in continuous units (cm of snow depth).
The regression tree for determining the fractional probability of snow cover.

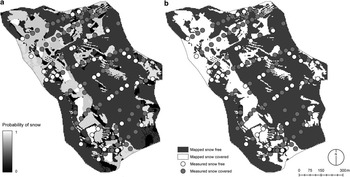
Map of the basin illustrating a. the probability of snow cover classification, and b. the snow-covered and snow-free areas.

A cross-verification procedure (Guisan & Zimmerman Reference Guisan and Zimmermann2000) was used to ensure that verification of the models was done with independent data to that used for model calibration. This technique works by omitting one of the cases, fitting the model to the remainder and then applying the equation obtained to the omitted case in order to calculate its predicted value. This procedure was repeated for all cases in the dataset. Kappa values, K, were used to assess the predictive capacity of the model to predict the existence of C and F areas. The Kappa statistic allows the evaluation of model efficacy by assessing the extent to which models predict occurrences that are better than chance occurrences (Fielding & Bell Reference Fielding and Bell1997, Manel et al. Reference Manel, Willia and Ormerod2001). For example, a Kappa of 0.85 means there is 85% better agreement than by chance alone. Kappa values are drawn from a confusion matrix obtained from the validation dataset. The confusion matrix contains information about observed and predicted snow cover presence or absence through use of a classification system. Kappa values can then be categorized as: predicted and observed; not predicted and not observed; not predicted but observed; and not observed and not predicted classes (Fielding & Bell Reference Fielding and Bell1997). Different threshold probabilities to obtain Kappa values (0.1, 0.2, 0.3, 0.4, 0.5, 0.6, 0.7, 0.8 and 0.9) were used in order to obtain a more robust validation and to avoid problems such as prevalence (Forbes Reference Forbes1995). Kappa values vary between 0 and 1. K values < 0.4 are considered as being poor, 0.4 < K < 0.75 are accepted as being good, while K values > 0.75 are excellent (Landis & Koch Reference Landis and Koch1997). Observed and predicted snow depths were directly compared and accuracy assessed by the coefficient of determination (r 2), mean bias error (MBE) and mean absolute error (MAE). The two latter were calculated as the average of the difference between the predicted and observed values and the average absolute difference between the predicted and observed values, respectively.
Results and discussion
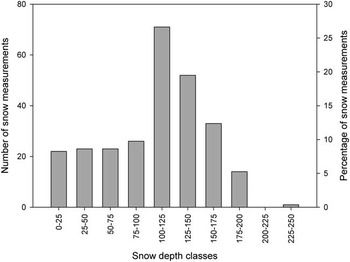
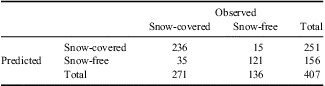
Almost 30% of the snow measurements were from 100–125 cm in depth, with an almost equal distribution of depths shallower than 100 cm (Fig. 6). However, the difference between the C and the F areas is quite prominent. Most of the topographic variables that dictate the meteorology that drives the presence or absence of snow are significantly different (Fig. 3a–g). Only slope and northness are not significantly different (significance > 0.05) between C and F with eastness, curvature, and maximum upwind slope being considerably different. These differences can also be seen in the regression tree for predicting the probability of snow cover (Fig. 4). Again the variables related to wind effect are those that are more frequent for splitting branches (Fig. 4). The confusion matrix (Table I) highlights how well the regression tree worked. Using a threshold for predicted probability of 0.5 to discriminate C and F classes, 88% of the 407 classes used were properly classified. The errors of omission (predicted as being snow-free but being snow-covered) were 12.9% (35/271) and the errors of commission (predicted as being C but actually being F) were only 6% (15/251). Overall the Kappa score was 0.73, which is considered an excellent score according to the classification suggested by Landis & Koch (Reference Landis and Koch1997).
Histogram of snow depth classes.

Confusion matrix illustrating the classification capability of the tree model for assigning snow-covered vs snow-free areas over the study watershed. The error of commission is 6% and the error of omission is 22.4%. Overall 88% of the pixels were correctly classified.
The probability of snow determined by the binary regression tree (Fig. 4) was applied to the topographic variables to yield a map of the probability of snow cover classification (Fig. 5a). The difference between C and F areas was used as the optimum detected threshold, a value of 0.5 to produce the C vs F map (Fig. 5b).
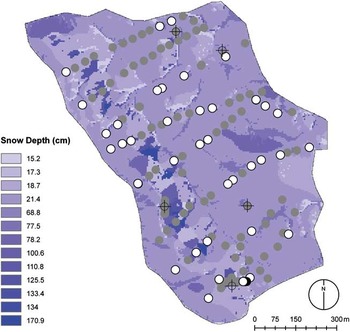
Subsequently for areas with snow cover, the snow depth was determined from a binary regression tree (Fig. 7). Eastness then curvature were the first two variables included. Slope, elevation and solar radiation were also included in the pruned tree. The areas with deeper accumulation are well represented, but the model predicts some snow in areas where it was actually snow-free. This is mostly a consequence of the discrete nature of the tree model predictions, as snow depth is estimated for all the cells of the study area (Figs 7 & 8). In the case of snow cover, the model also predicts the probability of snow cover for all cells (Figs 4 & 5a), but the selection of a threshold of probability (probability > 0.5) to discriminate between C and F areas yields a realistic snow distribution across the study area (Fig. 5, right map).
The regression tree for distributing snow depth (in centimetres).

Map of the distribution of snow depth across the Lake Limnopolar watershed.

During the snow survey, areas of snow cover were observed to be contiguous and the banding within the probability of snow map (Fig. 5a) and C vs F map (Fig. 5b) is a result of using a regression tree model and possible artefacts of the DEM generation. These bands can be seen in the maximum upwind slope (Fig. 2f and second node in Fig. 4). This topographic variable is relevant, yet due to the use of the TIN method to interpolate the DEM, slope bands (Fig. 2a) and thus maximum upwind slope bands (Fig. 2f) could have DEM generation artefacts. Other interpolation methods were tested, such as kriging, but they produced less realistic DEMs based on a visual comparison. The original DEM created through the Spanish Polar Programme had some errors of the order of 10 m. Therefore the original data used to generate that DEM were individually evaluated and anomalous points were removed. It is recommended that the area be resurveyed and DEM generation be evaluated while on-site.
Statistically, the snow depth binary regression tree fit the observed data well with an r 2 value of 0.81 and a mean bias error of only -1.43 cm. The mean absolute error was 21.4 cm. Use of residual interpolation, as per Balk & Elder (Reference Balk and Elder2000), would reduce these errors and produce an improved distribution of snow depth. However, the objectives of this paper are to determine the topographic variables controlling the presence/absence of snow and the distribution of the depth of snow rather than to map snow. Due to persistent high winds in these areas, often faster than 15 m s−1 (Bañón Reference Bañón2004, Fassnacht et al. Reference Fassnacht, Toro Velasco, Meiman and Whitt2010), the topographic variables associated with wind dictate the presence and distribution of snow.
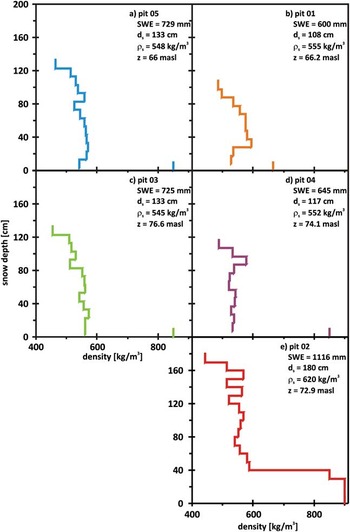
Snow density profiles were measured at the peak accumulation and/or during the initiation of snowmelt. All snow pits were isothermal to the bottom of the snowpack, i.e. the temperature was 0°C throughout. A basal ice layer was present but its temperature was not measured since equipment was not on hand to access the soil. The five snow pit density profiles illustrate that the top of the snow is the least dense (450 kg m-3) with some ice layers approaching 600 kg m-3 (Fig. 9). For all snow pits, the bottom of the snowpack was much denser. Pits 3, 4 and 5 had an impenetrable basal ice layer of 13, 3, and 3 cm and thus the density of the bottom few centimetres was estimated. Pit 1 had slush at the bottom and pit 2 had standing water at the bottom 30–35 cm. These densities were also estimated. Computing snow density ignoring the bottom ice, slush or water layer yielded an average of 546, 544, 536, 532, and 541 kg m-3 for snow pits 1–5 respectively. These averages are all similar, as illustrated in Fig. 9. The denser bottom layers, such as basal ice layers, form primarily due to the presence of permafrost on Byers Peninsula. An active layer forms as the permafrost melts in F areas. The spatial thermodynamics between the F and C areas must be considered when estimating energy within the snowpack and the soil. The proximity and gradient with respect to F areas should be considered when estimating the average snowpack density. The snowpack densities observed herein are at least 100 kg m-3 denser than much deeper snowpacks measured in the western United States of America (Mizukami & Perica Reference Mizukami and Perica2008), probably due to densification by the persistent winds in Maritime Antarctica. At peak snow accumulation it is probably acceptable to assume a mostly homogeneous snow density such as presented by Logan (Reference Logan1973).
The variation in snowpack density across the profile and at five locations in the Lake Limnopolar watershed.

The permafrost distribution has been mapped most recently by López-Martínez et al. (Reference López-Martínez, Serrano, Schmid, Mink and Linés2012), but it is provided at a scale coarser than snow is mapped in this paper. The distribution of permafrost may influence the distribution of snow, but conversely, the snow distribution does influence the depth of the active layer as deeper snow and later snowmelt hinders the melting of the active layer, i.e. more snow could imply a shallower active layer at the end of the summer. It is possibly that the presence of snow influences the depth of the permafrost.
Conclusions
The presence (snow-covered) or absence (snow-free) of snow at Lake Limnopolar watershed on Byers Peninsula is dominated by topographic variables related to wind. For the binary regression tree, eastness was the first node, with maximum upwind slope, elevation and curvature subsequently dictating the probability of snow. Radiation and slope were also relevant in the model. Neither slope nor northness were statistically different between the snow-covered and snow-free terrain at the 0.05 significance level.
For the distribution of snow depth, eastness was also the dominant variable in the binary regression tree. Curvature, then slope, were next included in the model. Elevation and radiation also appeared. Interpolation of the residuals from the binary regression trees is recommended to produce maps of the distribution of snow depth.
The snowpack density was essentially the same at the five snow pits, when the bottom layers that are influenced by permafrost are disregarded. The total snow water equivalent was different but that is a function of snow depth. Differences in average density across the entire snowpack must consider the proximity and gradient with respect to snow-free areas.
Acknowledgements
Travel to and accommodation in South America was provided by the International Programs at Colorado State University. Travel to Antarctica and logistical support for fieldwork was provided by the Spanish Polar Programme, grant POL2006-06635/CGL from the Education and Culture Ministry (Spain), and from the Las Palmas crew (Spanish Navy). Carlos Calvo of the UTM (Maritime Technology Unit, CSIC) and Brendan Keely of the University of York assisted with data collection. Adam Winstral of the Agricultural Research Service in Boise ID provided the code to compute the maximum upwind slope. We would also like to thank two anonymous reviewers for their important insight and their assistance in improving this paper. Thanks are due to Javier Zabalza of the Instituto Pirenaico de Ecología for his assistance with the GIS work.