I. INTRODUCTION
Pioneering work on dislocation pileups against thin (oxide) films began in 1959 as an extension of the Ph.D. thesis researches of Head at Bristol.Reference Head1 His work was further extended to a Hall-Petch (H-P) type of analysis for dislocation pileups within elastically anisotropic materialsReference Armstrong and Head2 and to catastrophic pile-up releases at obstacle breakthroughs.Reference Head3, Reference Armstrong, Coffey and Elban4 An important concern in current researches is with pileups within the thin films themselves and, especially, within both larger and smaller nanoscale grain structures as well as within counterpart bulk materials. Already there is clear demonstration that the mechanical strength levels of isolated nanopolycrystalline thin layer or bulk materials developed for electronic or other design applications are approximately an order of magnitude higher than that for the same materials with conventional microstructures.Reference Armstrong5
II. DISLOCATION PILE-UP RESULTS/PREDICTIONS
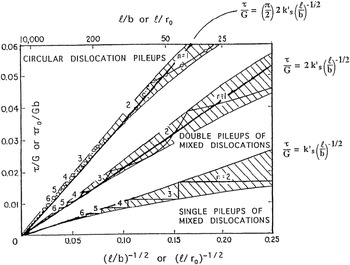
Figure 1 shows adaptation to fracture mechanics crack geometries of model dislocation calculations reported for single-ended, double-ended and circular pileups.Reference Armstrong6 In the figure, the effective shear stress acting on the pileups, τ, is divided by the shear modulus, G, and the pile-up length taken to equal a material grain diameter, ℓ, is divided either by the dislocation Burgers vector, b, or the dislocation core radius, r0. The discrete dislocation character is revealed at small numbers, for example, providing the relation for relative shear strength decrease caused by addition of each dislocation to a single ended pileup of n dislocations of
 $${\rm{\Delta \tau /\tau }}\,{\rm{ = }}\,{\rm{ - 1/n}\quad.}$$
Model dislocation pile-up calculations at small number of dislocations for single-ended, double-ended, and circular geometries and relation to fracture mechanics crack size-dependent predictions.Reference Armstrong6

The cross-hatched area for each pile-up geometry in Fig. 1 covers the limiting H-P slope values, or stress intensities, that could be fitted to the theoretical dependencies; and, the linear dependencies defined inside the figure area are the fracture mechanics relations for edge crack, internal two-dimensional crack, and circular crack geometries. The top-end scale of the figure gives, with dislocation Burgers vector, b, or dislocation core radius, r0 = ∼0.2 nm and, say, ℓ/b = 25, an indicated grain diameter of ∼5 nm.
A. One or few grains through the thickness
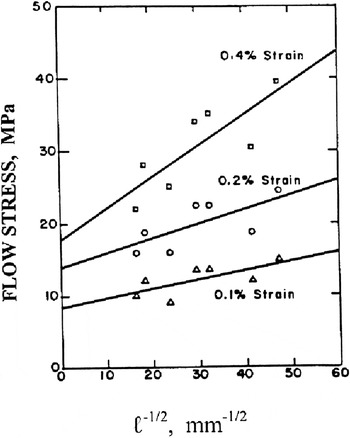
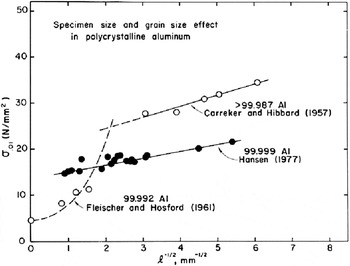
Figure 2 provides a pioneering determination of H-P results for an Al-1% Si alloy film of 1 μm thickness tested in plane stress by means of a Beams-type bulge test.Reference Griffin, Brotzen and Dunn7 Brotzen has provided a helpful review of the bulge test method and other test methods for thin film materials.Reference Brotzen8 Attention is directed in the figure to the experimental scatter and otherwise indication of low values of the H-P stress intensity, for example, of the reported kε (slope) values equal to 0.13, 0.20, and 0.43 MPa mm1/2 at increasing strain values. The kε values compare with a lowest value of kε ≥ ∼1.3 MPa mm1/2 for relatively pure Al as shown for a number of results reflecting multicrystal and bulk aluminum (Al) behavior in Fig. 3.Reference Armstrong, Faester, Hansen, Huang, Juul Jensen and Ralph9
Hall-Petch flow stress dependence on grain size for 1-μm thick Al-1% Si material as determined in a bulge test system.Reference Griffin, Brotzen and Dunn7, Reference Brotzen8

Comparison of the H-P results for the different materials shows that the effect of 1% silicon (Si) in the Al alloy of Fig. 2 has neither increased the experimental friction stress intercept, σ0ε, nor kε in the H-P relation
 $${\rm{\sigma }}_{\rm{\varepsilon }} \,{\rm{ = }}\,{\rm{\sigma }}_{{\rm{0\varepsilon }}} \,{\rm{ + }}\,{\rm{k}}_{\rm{\varepsilon }} \ell ^{{\rm{ - 1/2}}}\quad. $$
And there does not seem to be any evidence of transition to higher strength level for ℓ−1/2 ≥ 31.6 mm−1/2 for grain sizes smaller than the film thickness, perhaps because sufficiently smaller grain sizes were not obtained (on the smaller grain size side of ℓ−1/2) to achieve a condition of true polycrystalline deformation behavior.
Under the plane stress condition for these tested films, there is no shear stress in the surface plane whereas plastic deformation proceeds through the film thickness with expectation of screw dislocation pileups at the through-thickness grain boundaries. VoskoboinikovReference Voscoboinikov13 has reported recently on Head’s problem of a screw dislocation near the interface of a coated solid. Perhaps for the results of Griffin et al.,Reference Head1, Reference Griffin, Brotzen and Dunn7 there is addition of a small restraining effect of the film surfaces as for Head’s concern for an oxide film barrier? Nevertheless, the lesser constraint on grain deformations produces a condition somewhat analogous to the “grains per specimen cross-section” effect indicated in Fig. 3 for the few grains per cross-section shown for the Hosford and FleischerReference Fleischer and Hosford10 results as compared with the results reported by HansenReference Hansen11 who purposely went to larger specimen cross-sections for his larger grain size material.Reference Armstrong12 Keller et al.Reference Keller, Hug, Retoux and Feaugas14 have reported analogous specimen size-dependent grain size results spanning the range of partially polycrystalline to fully polycrystalline nickel (Ni) materials. The lower kε values and greater scatter of experimental measurements in Fig. 2 are in line with concern for influence of a specimen size effect.
Specimen size and Hall-Petch grain size dependences for several Al materials of different purities.Reference Fleischer and Hosford10–Reference Armstrong12

B. Micro- to nanopolycrystal H-P results
The strength properties of relatively thicker material layers that have been deposited have often been monitored by hardness testing, for example, as reported for reasonably deep layers of electrodeposited chromium (Cr) materialReference Brittain, Armstrong and Smith15 that was shown to exhibit a Hall-Petch-type dependence for diamond pyramid microhardness measurements as
 $${\rm{H}}\,{\rm{ = }}\,{\rm{H}}_{\rm{0}} \,{\rm{ + }}\,{\rm{K}}_{\rm{H}} \ell ^{{\rm{ - 1/2}}}\quad. $$
More recently, the same type of nanoindentation hardness dependence has been reported for electrodeposited copper (Cu) films as shown in Fig. 4.Reference Bull, Sanderson, Moharrami and Oila16 In this case, the relatively constant hardness of individual grains was measured at the indicated larger grain sizes and an indentation size effect (ISE) was also revealed. Normally for bulk material behavior, the value of kH from Eq. (3) is given by ∼3kε and the value of kH = ∼25 MPa mm1/2 for the Fig. 4 results compares reasonably favorably with a value of 3kε = ∼15.0 MPa mm1/2 obtained for direct tensile flow stress measurements.Reference Armstrong, Faester, Hansen, Huang, Juul Jensen and Ralph9 Other indentation results have been reported for determining a transition in hardness between layer and substrate, for example, as demonstrated for that of diamond-like carbon thin films and their 316L stainless steel substrates.Reference Chicot, Gil, Silva, Roudet, Puchi-Cabrera, Staia and Teer17
Nanoindentation measurements for single grain and Hall-Petch hardness dependences.Reference Bull, Sanderson, Moharrami and Oila16

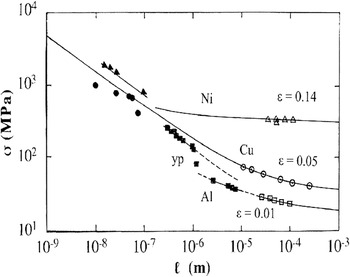
Connection between the H-P results of conventional, fully polycrystalline and nanopolycrystalline material is usefully demonstrated on a log/log basis as shown in Fig. 5 for a compilation of selected Al, Cu, and Ni material results. For such logarithmic depiction made for a direct dependence of σε on ℓ, the H-P relation of Eq. (2) gives a level (constant) value of σ0ε at large grain size and an asymptotic straight line dependence of slope (−1/2) at small grain sizes. In Fig. 5, the conventional (open square) grain size results for Al are from Carreker and HibbardReference Carreker and Hibbard18 (shown in Fig. 3) as compared with the less pure (filled square), conventional and nanoscale results reported by Tsuji et al.Reference Tsuji, Ito, Saito and Minamino19 For Cu, the open circle results are from Hansen and RalphReference Hansen and Ralph20 as compared with a compilation of individual filled circle results compiled by Lu et al.Reference Lu, Chen, Huang and Lu21 For Ni, the indicated larger 0.14 strain, open triangle results are from Keller and HugReference Keller and Hug22 whereas the closed triangle results are plotted as H/3 from Torrents et al.Reference Torrents, Yang and Mohammed23
Log/log type compilation of conventional and nanopolycrystalline Hall-Petch results for Al, Cu, and Ni materials.Reference Armstrong12, Reference Keller, Hug, Retoux and Feaugas14, Reference Carreker and Hibbard18–Reference Torrents, Yang and Mohammed23

The indicated correlation of results in Fig. 5, with due account taken of their being compiled for different materials and test conditions, provides an important comparison of relative σ0ε and kε values for the designated face-centered cubic (fcc) metals. Such fcc metals and alloys had been relegated in importance in the past studies regarding the influence of grain size on determining the polycrystalline strength. And there are two reasons for such disregard: (i) the kε values are relatively low when compared with body-centered cubic (bcc) and hexagonal close-packed (hcp) metals; and (ii), as indicated for the Keller and HugReference Keller and Hug22 Ni results in Fig. 5, both σ0ε and dσ0ε/dε values are relatively high when compared with the magnitude of the kεℓ−1/2 term. Broadly representative kε values in units of MPa mm1/2 are ∼24 for steel and ∼10 for magnesium (Mg) as compared with ∼5 for Cu and Ni, and ∼1.3 for Al.Reference Armstrong, Faester, Hansen, Huang, Juul Jensen and Ralph9
The comparatively lower fcc kε values, particularly for Al, have been attributed to the requirement of cross-slip at grain boundaries as compared with strain hardening of the polycrystal grains by dislocation density-controlled build-up of line intersections occurring with increasing strain.Reference Armstrong, Borland, Clarebrough and Moore24 The raised σ0ε value for the Keller and Hug nickel results shown in Fig. 5 at ε = 0.14 shows the importance of such fcc strain hardening property. Nevertheless, H-P strengthening in fcc metals is being researched as important at nanoscale grain sizes and also it accounts for an approximate order-of-magnitude increase in strength level. Very interestingly, the results shown by the study of Tsuji et al.Reference Tsuji, Ito, Saito and Minamino19 for the relatively impure 99.3% Al material in Fig. 5 exhibit a relatively high value of kε = ∼4.8 MPa mm1/2 in the nanoscale grain size regime.
C. Transition to one dislocation loop
A natural question to ask about the dislocation pile-up explanation of the H-P relation is what happens as the number of dislocations in a pileup is squeezed down to the lower limiting case indicated in Fig. 1 of one dislocation loop expanding against the grain boundary resistance. The answer is found by adding τC onto the equation for expansion of a single dislocation loop, for example, asReference Li and Liu25
 $$\sigma \,{\rm{ = }}\,{\rm{m[}}\tau _{\rm{0}} \,{\rm{ + (3Gb/4\pi }}\ell {\rm{)\{ (5/6)({\bf{ln}}[4}}\ell {\rm{/b] - 1) - 1/16\} + \tau _{\rm{C}} {\rm{]}\quad.}$$
In Eq.(4), m is the Taylor orientation factor, τ0 is the multislip shear stress for deformation within the grain volumes, ℓ is the loop diameter taken equal to the grain diameter, and τC is the needed shear stress for penetration of the grain boundary obstacle.
In Eq. (4), the quantity, mτ0 = σ0ε in Eq. (2). The value of τC may be evaluated from the H-P model evaluation of kε that is given as
 $${\rm{k}}_{\rm{\varepsilon }} \,{\rm{ = }}\,{\rm{m[\pi m^*Gb\tau }}_{\rm{C}} {\rm{/2\alpha ]}}^{{\rm{-1/2}}}\quad. $$
In Eq. (5), m* is a Sachs orientation factor and α is a factor (of ∼0.8) for an average dislocation edge and screw character.Reference Armstrong, Faester, Hansen, Huang, Juul Jensen and Ralph9 For Mg, τC had been shown to be controlled by the requirement of prism slip for which the temperature dependence of the resolved shear stress was measured in single crystal experiments.Reference Armstrong26 The same type positive comparison was made for Cu between kε and τIII, the cross-slip stress.Reference Armstrong27 And, as will be utilized later in the present article relating to combination of measurements made for Cu and Ni materials, it is useful to point out that they have very similar kε values because the multiplied product of their otherwise very different individual values of G and τIII is essentially equivalent in Eq. (5).Reference Armstrong, Faester, Hansen, Huang, Juul Jensen and Ralph9
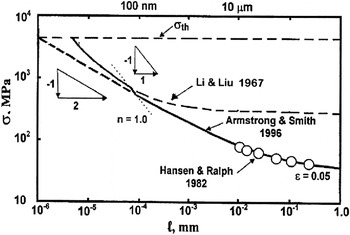
Figure 6 shows for Cu a further connection on a dislocation pile-up model basis of Eqs. (4) and (5), this time involving extrapolation into the ultrafine grain size regime of the H-P results reported by Hansen and RalphReference Hansen and Ralph20 (and shown in Fig. 5). And in Eq. (5), the value of kε = 5.0 MPa mm1/2 from Hansen and Ralph was used with other known values of the constants to determine τC. Thus, with it and τ0 determined from σ0ε for the Hansen and Ralph results, Eq. (5) could be plotted in the figure. The resultant curve is the lower dotted one beginning from larger grain sizes and transitioning to the solid curve at n = 1.0 as also evaluated on a calculated pile-up basis from
 $${\rm{n}}\,{\rm{ = }}\,{\rm{2\alpha k}}_{\rm{\varepsilon }} \ell ^{{\rm{\,-1/2}}} {\rm{/\pi mGb}\quad.}$$
Hall-Petch model of transition for Cu from a pileup to a single dislocation loop expanding against the grain boundary resistance.Reference Armstrong, Faester, Hansen, Huang, Juul Jensen and Ralph9, Reference Hansen and Ralph20, Reference Li and Liu25

Thus Fig. 6 shows the transition of a pileup to a single dislocation loop expanding against the grain boundary obstacle for Cu and, very importantly, leads at ℓ < ∼100 nm to an increase in stress above the extrapolated H-P line. At the smaller range of grain sizes covered by the solid curve, the relatively high value of τC leads to the curve appearing as a shift upwards of a somewhat similar type of ℓ−1/2 dependence. The most important result of Fig. 6, however, is that transition to a single dislocation loop equation does not lower the material strength and therefore another explanation must be sought for nanoscale experimental measurements showing a lower degree of H-P strengthening. One explanation that has been given for opposite lower strength measurements is based on a disordered grain boundary structure being produced by certain nanoscale material processing methods and in this way leading to reduced values of kε through a lower resistance to slip penetrations from within the grain volumes.Reference Armstrong, Conrad, Nabarro, Ovid’ko, Pande, Krishnamoorti, Lavernia and Skandan28, Reference Armstrong29 Conrad has provided a review of Cu experimental measurements, most of which fall below expected H-P strength levels and argued for a classification of results into the three grain size-defined regions of: control at larger grain sizes mainly by the dislocation density thus corresponding to σ0ε being dominant; then, an intermediate range of smaller grain sizes where the pileup-induced kε represents a more substantial part of the material strength; and last, at the smallest grain sizes, the H-P relation being reversed because of relative grain boundary weakening.Reference Conrad30
D. The strain rate sensitivity measured by reciprocal value of activation volume
Early measurements demonstrating a grain size dependence of the strain rate sensitivity (SRS) of the hcp metals, Zn and Mg, were associated with a temperature dependence of the H-P kε value.Reference Armstrong31, Reference Prasad and Armstrong32 And for polycrystalline cadmium (Cd) material, whose value of kε had been determined to be controlled by pyramidal slip, a grain size-dependent strain rate sensitivity measured by means of reciprocal value of the activation volume, v*, was obtained by differentiating both σ0ε and kε terms in Eq. (2) with respect to ln(dε/dt) to obtain an H-P type of dependence as
 $${\rm{(1/v^*)}}\,{\rm{ = }}\,{\rm{(1/v}}_{\rm{0}} {\rm{^*)}}\,{\rm{ + }}\,{\rm{(k}}_{\rm{\varepsilon }} {\rm{/2m\tau }}_{\rm{C}} {\rm{v}}_{\rm{C}} {\rm{^*)}}\ell ^{{\rm{ - 1/2}}}\quad. $$
In Eq. (7), v0* is the activation volume determined from σ0ε and vC* is that obtained from τC* in Eq. (4). Very importantly, the product τCvC*was shown to be constant at small strainsReference Armstrong31; and thus, the prediction of Eq. (7) offered a complementary H-P type of dislocation pile-up model dependence analogous to that obtained in Eq. (2).Reference Prasad and Armstrong32 Quantitative verification of Eq. (7) was established later through separate measurements made for cadmium material of the various terms in Eq. (7).Reference Rodriguez, Armstrong and Mannan33
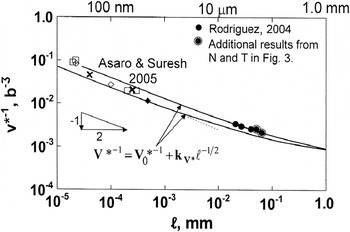
There is application of Eq. (7) to pure fcc metals because of the requirement of thermally-activated cross-slip being needed in the grain boundary regions, in line with match of the temperature and strain rate dependencies of τIII and kε measurements for Cu.Reference Armstrong27 In addition, compiled SRS measurements have been reported for Cu and Ni v* values at nanoscale grain sizes with the consequent amplification at much smaller values of ℓ, hence larger values of ℓ−1/2, as shown in Fig. 7.Reference Armstrong and Rodriguez34 In the figure, a lesser but definite H-P type of Eq. (7) dependence for conventional grain size Ni material, reported by Narutani and Takamura,Reference Narutani and Takamura35 has been extrapolated to nanoscale grain sizes for temperatures of 195 and 300 K to encompass a number of compiled v* measurements reported by Asaro and Suresh.Reference Asaro and Suresh36 The effect of grain size magnification through Eq. (7) has resulted in an order-of-magnitude increase in v*−1. Through consideration of the two v* terms in Eq. (7) being for dislocation intersections (in v0*) and cross-slip (in vC*), RodriguezReference Rodriguez37 was able to resolve difficulty pointed to by Narutani and Takamura in correlating their separate measurements of v* for the mechanical tests and by means of electrical resistivity.
A Hall-Petch dependence for the reciprocal activation volume, v*−1, for a compilation of Cu and Ni materials covering nanoscale and conventional grain sizes.Reference Armstrong and Rodriguez34–Reference Rodriguez37

III. DISCUSSION
The positive H-P results for well-defined nanopolycrystalline materials point to an enabling strength effect in thin films, layers on substrates, and bulk materials under all circumstances in which true nanopolycrystalline material is appropriate, of course, with due regard also to taking into account other material design requirements. From a mechanical strength viewpoint, it seems relevant to discuss the reduction of any H-P kε value either due to disorder at the grain boundaries or even because of the reverse in H-P behavior already established for a few materials at their limiting small nanoscale grain sizes, say <10 nm; see Fig. 5. In fact, Lu et al.,Reference Lu, Chen, Huang and Lu21 while compiling those H-P strengthening measurements shown for Cu in Fig. 5 and confirming the measurements with their own test results, also demonstrated a reverse H-P behavior moving downward in grain size from ∼10 nm.
The reverse H-P measurements of Lu et al. can be shown to follow a linear dependence of decreasing stress, as ℓ gets smaller. The same linear dependence had been exhibited in results for Zn reported by Narayan and Conrad.Reference Conrad and Narayan38 One more or less universal grain size weakening expression that derives from a model of grain boundary shearing during high temperature deformation isReference Langdon39
 $${\rm{(d\varepsilon /dt)}}\,{\rm{ = }}\,{\rm{(AD}}_{\rm{L}} {\rm{Gb/kT)(b/}}\ell {\rm{)}}^{\rm{p}} {\rm{(\sigma /G)}}^{\rm{q}}\quad. $$
In Eq. (8), A, P, and q are experimental constants; and, DL is the lattice diffusion coefficient. The linear dependence of decreasing stress on decreasing ℓ for the Zn results leads to an assumption of p = q =1. And then a reciprocal activation volume is easily determined from Eq. (8) as
 $${\rm{v^*}}^{{\rm{ - 1}}} \,{\rm{ = }}\,{\rm{(1/kT)[}}\partial {\rm{\tau /}}\partial {\rm{{\bf{ln}}(d\varepsilon /dt)]}}_{\rm{T}} \,{\rm{ = }}\,{\rm{\sigma /mkT}\quad.}$$
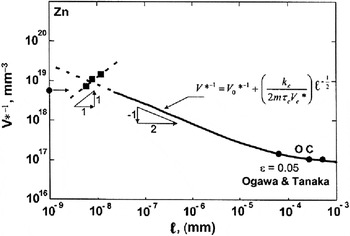
Such dependence has been evaluated for Zn and compared (as filled square points) in Fig. 8 in which comparison may also be made with extrapolation of conventional grain size results reported by Ogawa and TanakaReference Ogawa and Tanaka40 for a normal H-P dependence of v*−1. Of particular interest on the ordinate axis in Fig. 8 is the filled circle point that corresponds to a smallest dislocation value of b−3 for the pyramidal slip established to control τC in kε. Thus, the v* measurements shown in the figure for a reversed H-P dependence are seen to be smaller than required for any conventional (pyramidal) slip mechanism in the grain boundary regions. The comparison supports a mechanism of smaller displacements for a reversed H-P dependence likely corresponding to shearing of a disordered grain boundary structure.
Prediction of a reversed v*−1 Hall-Petch dependence on grain size for the strain rate sensitivity of Zn materials as compared with a normal dependence at conventional grain size.Reference Conrad and Narayan38, Reference Ogawa and Tanaka40

IV. SUMMARY
The historical background for dislocation pileups against thin film coatings has provided the beginning point for a newer consideration of pileups occurring in thin films or thicker material layers. Electronic and other material applications are enabled by an approximate order-of-magnitude increase in strength level for nanopolycrystalline grain structures. To this end, a description is given for small dislocation pile-up characteristics that lead to the Hall-Petch relation and its connection with relative grain and material layer dimensions and material test conditions, including plane stress testing in the bulge test and of conversion to strength values of hardness test results. Theoretically, strengthening of Cu is predicted to occur for transition of a circular dislocation pileup to a single loop expanding against the grain boundary obstacle. One possibility for the more often made observation of less than extrapolated H-P strength results being obtained is that grain boundary disorder might occur during material production and such disorder should lower the grain boundary resistance. Special advantage is shown for investigating the strain rate sensitivity properties of materials. A complementary H-P type dependence is obtained that, with interpretation on a thermal activation basis, provides connection to the mechanisms of plastic flow within grain volumes and in the boundary regions. Such SRS information is shown to be usefully extended to interpretation of a reverse H-P behavior at lower limiting grain sizes.
ACKNOWLEDGMENTS
Appreciation is expressed to Professor Jay Narayan and colleague guest editors for inviting the present article for the MRS “Focus Issue on Frontiers in Thin-Film Epitaxy and Nanostructured Materials”.