1. Introduction
China's rapid economic development in recent decades has been accompanied by severe environmental pollution. The central government of China has put forward the development requirements for ‘scientific development’ and ‘ecological civilization’ to improve environmental quality and realize sustainable development. However, environmental quality remains suboptimal, while air pollution has become an even more severe problem (Xie et al., Reference Xie, Huang and Qin2018). The continuous deterioration of environmental quality reflects the urgent need to transform and upgrade the mode of economic development and also shows that China's current environmental governance continues to require improvement.
In China, local governments are responsible for local environmental governance; however, local government officials lack adequate incentives to protect the local environment (Mol and Carter, Reference Mol and Carter2006; Kostka and Mol, Reference Kostka and Mol2013; Tian et al., Reference Tian, Tian, Chen and Shao2020). When environmental protection is incompatible with local economic development, sacrificing environmental quality to ensure economic development becomes the option of choice for most local government officials (Wu et al., Reference Wu, Deng, Huang, Morck and Yeung2014; Kahn et al., Reference Kahn, Li and Zhao2015).
Notably, institutional and politico-economic explanations can be made for the lack of incentives for environmental protection by local government officials. Local governments and officials are the main agents of local affairs in China's administrative governance system (Cai and Treisman, Reference Cai and Treisman2006; Guo, Reference Guo2009). Reform in the form of administrative decentralization, which began in the 1980s, gave local governments greater autonomy in economic development, especially regarding fiscal revenue and public expenditure (Jin et al., Reference Jin, Qian and Weingast2005; Weingast, Reference Weingast2009). In this decentralization arrangement, local governments and officials received strong incentives to develop local economies to obtain tax revenue (Chen and Kung, Reference Chen and Kung2016).
Additionally, local officials have crucial personal influence over local affairs (Eaton and Kostka, Reference Eaton and Kostka2014; Jia et al., Reference Jia, Kudamatsu and Seim2015). However, these officials are not adequately motivated to protect the environment. After China's reform and opening up, the central government established a basic evaluation system for local officials focused on economic construction; after that, the evaluation system of local officials was gradually replaced with political loyalty for economic performance (Guo, Reference Guo2009). Under this new system, the evaluation and promotion of local officials are directly linked to the economic growth of their jurisdictions; therefore, local officials have strong political incentives to develop the local economy (Li and Zhou, Reference Li and Zhou2005). However, the restrictions of limited tenure and budget constraints encourage local officials to pursue short-term economic growth at the expense of both economic efficiency and environmental protection. Environmental protection cannot realize short-term economic benefits for local governments and officials; to make the problem more complicated, environmental protection may even hamper local economic growth (Liang and Langbein, Reference Liang and Langbein2015; Tian et al., Reference Tian, Tian, Chen and Shao2020). For instance, strict environmental regulations could reduce foreign direct investment (FDI), one of the main drivers of China's economic growth (Bao et al., Reference Bao, Chen and Song2011; Cai et al., Reference Cai, Lu, Wu and Yu2016). Furthermore, local governments may attract capital inflows, including FDI, by relaxing the enforcement of environmental regulations (Di, Reference Di2007; Cole et al., Reference Cole, Elliott and Zhang2011).
To increase the likelihood of promotion, local officials have political incentives to emphasize short-term goals (e.g., economic growth) and ignore long-term goals (e.g., environmental protection) (Xu, Reference Xu2011; Wu et al., Reference Wu, Deng, Huang, Morck and Yeung2014). Within this context, career-focused local officials make corresponding adjustments to their resource allocation strategies (Guo, Reference Guo2009; Shi and Xi, Reference Shi and Xi2018). Inadequate political incentives for local officials to promote environmental protection are considered the main institutional cause of China's environmental pollution and environmental governance dilemma (Wu et al., Reference Wu, Deng, Huang, Morck and Yeung2014; Kahn et al., Reference Kahn, Li and Zhao2015). However, identifying the impact of local officials’ political incentives on environmental pollution is challenging for two reasons. First, the political incentives of local officials are difficult to quantify, and the estimation of those incentives is likely affected by measurement error (Persson and Zhuravskaya, Reference Persson and Zhuravskaya2016). Second, some studies have questioned the very existence of an official evaluation system focusing on economic performance alone (Shih et al., Reference Shih, Adolph and Liu2012; Su and Tao, Reference Su and Tao2017).
With the help of the exogenous Provincial Communist Party Congress (PCPC) events, we reveal the impact of local officials’ political incentives on environmental pollution by examining the relationship between urban pollution emission intensity and the convening cycle of the PCPCs. PCPCs are held once every five years on a schedule that is unrelated to the economic situation or the political relations of government officials (Yu et al., Reference Yu, Xiao and Gong2015). The primary agenda of PCPCs is to discuss important local issues and select new leadership for the party committee (Nie et al., Reference Nie, Jiang and Wang2013). Additionally, an essential role of PCPCs is the evaluation of city government officials in the province (Yu et al., Reference Yu, Xiao and Gong2015). Therefore, the convening cycle of PCPCs can be regarded as an exogenous shock to city officials. Some studies have found that to obtain a proper evaluation and increase their likelihood of promotion, local officials have strong political incentives to implement aggressive economic policies before the PCPCs (Nie et al., Reference Nie, Jiang and Wang2013; Tsai, Reference Tsai2016; Huang and Du, Reference Huang and Du2017).
We match the pollution data of 281 prefecture-level and above cities in China from 2003 to 2014 with the corresponding personal attributes data of city leaders (including party secretaries and mayors) and PCPCs to test the relationship between the PCPC cycle and pollution emission intensity. We highlight the existence of a significant political pollution cycle in China. Pollution emission intensity exhibits a periodic feature associated with the convening cycle of PCPCs. Pollution emission intensity increases in the two years ahead of a PCPC, peaks in the year the PCPC is held, and then declines. PCPCs are usually accompanied by the centralized turnover of city leaders, and this turnover effect may interfere with the impact of PCPCs on pollution emission intensity. When we control for the turnover effect, the results indicate that pollution emission intensity can still be associated with the convening cycle of PCPCs, thus indicating a significant positive impact of city officials’ political incentives on environmental pollution.
This study makes three primary contributions. First, to the best of our knowledge, this study provides the first estimate of the impact of PCPCs on pollution emission intensity by merging city macro data with the corresponding personal attributes data of city officials and PCPCs. Second, we explore the impact of city leaders’ political incentives on pollution emission intensity after controlling for the personal attributes of city leaders, such as age, education, local work experience and tenure in office. Third, we examine the impact of city leader turnover on pollution emission intensity. This study provides new evidence for research on the relationship between political incentives and environmental pollution while shedding light on the prospects for China's environmental governance.
The remainder of this paper is organized as follows. Section 2 provides background on the political incentives of China's local officials and the PCPCs. Section 3 details the model and data. Section 4 presents the regression results, heterogeneity analysis and robustness checks. Section 5 provides the concluding remarks.
2. Background and mechanism
2.1. Political incentives
Local governments play a positive and important role in China's economic development by striving to use all available resources to develop the local economy (Huang, Reference Huang2002; Cai and Treisman, Reference Cai and Treisman2006; Han and Kung, Reference Han and Kung2015). However, with the rapid growth of the local economy, many regions have experienced negative outcomes such as redundant construction, over-investment and environmental pollution. These outcomes are closely related to the political incentives of local government officials (Wu et al., Reference Wu, Deng, Huang, Morck and Yeung2014; Persson and Zhuravskaya, Reference Persson and Zhuravskaya2016; Chen et al., Reference Chen, Tang, Wan and Chen2017).
Since the reform and opening up of China, the central government has shifted its focus to economic development. The promotion and evaluation criteria of local officials have gradually changed from political performance to economic performance, which has encouraged career-focused local officials to implement the central government's economic development policies (Guo, Reference Guo2009; Jia et al., Reference Jia, Kudamatsu and Seim2015; Yu et al., Reference Yu, Zhou and Zhu2016). Under an evaluation mechanism focused on economic performance, the promotion and evaluation of local officials are guided by the economic performance of their jurisdictions. As such, rapid economic growth helps officials complete the evaluation requirements and increases their likelihood of promotion. Conversely, slow or negative economic growth could increase the probability of local officials leaving core positions (Li and Zhou, Reference Li and Zhou2005).
An official evaluation mechanism focused on economic performance could objectively and effectively solve the problem of diminishing supervision and information asymmetry within vertical governments. This mechanism is characterized by low cost and high feasibility and can effectively motivate local officials to implement the central government's policies on economic development (Li and Zhou, Reference Li and Zhou2005; Guo, Reference Guo2009). For instance, GDP growth rates are the primary content of government work reports at all levels. The target GDP growth rate in the coming year is set in these reports. Moreover, the expected GDP growth rate of a lower-level government is usually higher than that of its superior government. Under the centralization arrangement, the central government can easily transmit its preferences to all levels of local government, especially with regard to measurable preference indicators such as GDP growth rate, resulting in lower-level governments setting incremental targets to cater to the preferences of higher authorities.
Generally, local officials are enthusiastic about infrastructure construction, investment attraction and other policies that can bring significant short-term economic performance during their tenure. These projects allow local officials to complete evaluation targets and improve the probability of promotion. A large body of literature attributes China's economic miracle to the strong political incentives for local officials to focus on local economic growth (Jin et al., Reference Jin, Qian and Weingast2005; Li and Zhou, Reference Li and Zhou2005; Xu, Reference Xu2011; Su and Tao, Reference Su and Tao2017). However, political incentives with economic growth as the key target result in local officials investing an inordinate amount of effort in short-term economic growth at the expense of efficiency improvement, which is the main reason for the deterioration of environmental quality in China (Zheng et al., Reference Zheng, Kahn, Sun and Luo2014).
Notably, the tenure of China's leading cadres has been changed from a lifelong position to a tenure position since the reform and opening up, with the session of local government officials now being five years. Therefore, local government officials in China face restrictions of limited tenure, resulting in their needing to implement reasonable resource allocation strategies during their tenure to maximize their utility.
In addition to economic development, local governments face a range of additional tasks, such as the provision of local public services and environmental protection (Xu, Reference Xu2011). However, under the influence of an official evaluation mechanism centered on economic performance and the constraints of tenure and budget, local officials lack political incentives to protect the environment for the following three reasons. First, economic performance can be measured by the gross domestic product (GDP) growth, yet no single indicator measures environmental protection and other public services. Therefore, local officials prioritize tasks that are easier to quantify, such as economic growth (Li and Zhou, Reference Li and Zhou2005; Yao and Zhang, Reference Yao and Zhang2015). Second, strict environmental regulation might not be conducive to short-term economic growth, with some studies suggesting that local governments could attract FDI by relaxing environmental regulations (Cole et al., Reference Cole, Elliott and Zhang2011; Lan et al., Reference Lan, Kakinaka and Huang2012). Third, functional environmental governance is a long-term process that has a spillover effect, implying that the benefits of governing to favor the environment might not be observed during the tenure of local officials. Meanwhile, the spillover effect of environmental pollution offsets unilateral environmental protection (Zheng et al., Reference Zheng, Kahn, Sun and Luo2014; Kahn et al., Reference Kahn, Li and Zhao2015). Therefore, career-focused local officials lack political incentives to protect the environment due to their limited tenure.
2.2. Provincial Communist Party Congresses
China implements a two-line management system with the Communist Party Committee and government. The Communist Party Committee is in charge of decision-making, while the government is responsible for implementation and management (Yao and Zhang, Reference Yao and Zhang2015). The National Communist Party Congress (NCPC), held once every five years, is the Communist Party's supreme organ of power. Reviewing government work reports and selecting the leadership of the new Communist Party Committee are the two core roles of the NCPC (Nie et al., Reference Nie, Jiang and Wang2013; Tsai, Reference Tsai2016).
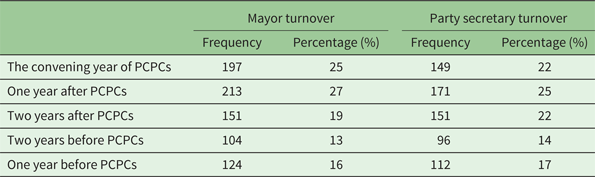
PCPCs select the new leadership of provincial Communist Party Committees and serve a critical role in evaluating and positioning the deployment of subordinate cadres, such as city leaders (Yu et al., Reference Yu, Xiao and Gong2015). Table 1 shows the turnover of city leaders within two complete PCPC cycles, from 2005 to 2014. The convening year and the following year represent the main turnover period for city leaders. More than half (52 per cent) of the turnover of mayors, and nearly half (47 per cent) of the turnover of party secretaries, happens during this period. Notably, while the turnover decisions of some leaders may have been made in the convening year of the PCPCs, the appointment and removal of leaders may only be announced officially in the following year (Shi and Xi, Reference Shi and Xi2018).
Frequency distribution of city leader turnover during 2005–2014

Note: The sample includes 281 prefecture-level and above cities.
The PCPCs are held once every five years and cannot be postponed without special circumstances in each province. The date of the PCPCs has no relevance to the economic situation or the political connection network of government officials; thus, PCPCs can be regarded as an exogenous event for city governments and officials (Xi et al., Reference Xi, Yao and Zhang2018).
Because the PCPCs are predictable political events accompanied by an official evaluation and centralized turnover, city officials have higher expectations of turnover during the PCPCs. Previous studies have confirmed that career-focused local officials have strong political incentives to pursue short-term economic growth before the PCPCs to improve their evaluation objectives and the probability of promotion during the PCPCs (Yu et al., Reference Yu, Xiao and Gong2015; Tsai, Reference Tsai2016; Xi et al., Reference Xi, Yao and Zhang2018). The pursuit of short-term economic performance by city officials inevitably requires the expansion of investment scale, the promotion of industrial production and even the relaxation of environmental regulations; unfortunately, these policies can increase energy consumption and pollution emissions (Wu et al., Reference Wu, Deng, Huang, Morck and Yeung2014).
The intensity of political incentives for city officials to pursue short-term economic performance is different before and after the PCPCs. After PCPCs, political incentives for city officials to pursue short-term economic performance are reduced by the mitigation of evaluation pressure and turnover expectations. As a result, city officials may adjust the expansionary economic development strategy adopted before the congress (Yu et al., Reference Yu, Xiao and Gong2015). Career-focused officials may adopt different resource allocation strategies according to PCPC dates, which has various effects on the social and economic development of local regions (Huang and Du, Reference Huang and Du2017; Xi et al., Reference Xi, Yao and Zhang2018). Environmental pollution may have periodic features associated with the convening cycle of the PCPCs, resulting in a political pollution cycle. A political pollution cycle could be used to prove the existence of political incentives for local officials to pursue short-term economic performance and ignore environmental protection measures.
3. Methodology and data
China's environmental pollution comes mainly from industrial emissions. Due to statistical constraints, existing research has typically used industrial wastewater or waste gas to measure China's environmental pollution (Cole et al., Reference Cole, Elliott and Zhang2011; Lan et al., Reference Lan, Kakinaka and Huang2012). In this study, environmental pollution is measured by industrial sulphur dioxide (SO2) emissions. We use the ratio of industrial SO2 emissions to GDP to measure environmental pollution because this ratio enables comparisons and can reflect the efficiency of green production (Tian et al., Reference Tian, Tian, Chen and Shao2020).
Most Chinese cities are facing severe air pollution. One of the main air pollutants, SO2, has a direct negative impact on human health and the urban ecological environment (Schreifels et al., Reference Schreifels, Fu and Wilson2012). SO2 originates from the combustion of coal and oil in industrial processes; therefore, SO2 emissions are closely related to industrial production and economic growth (Wang, Reference Wang2010). Because governments can push companies to reduce SO2 emissions by raising emission standards, industrial SO2 emissions have a certain level of policy sensitivity and controllability.
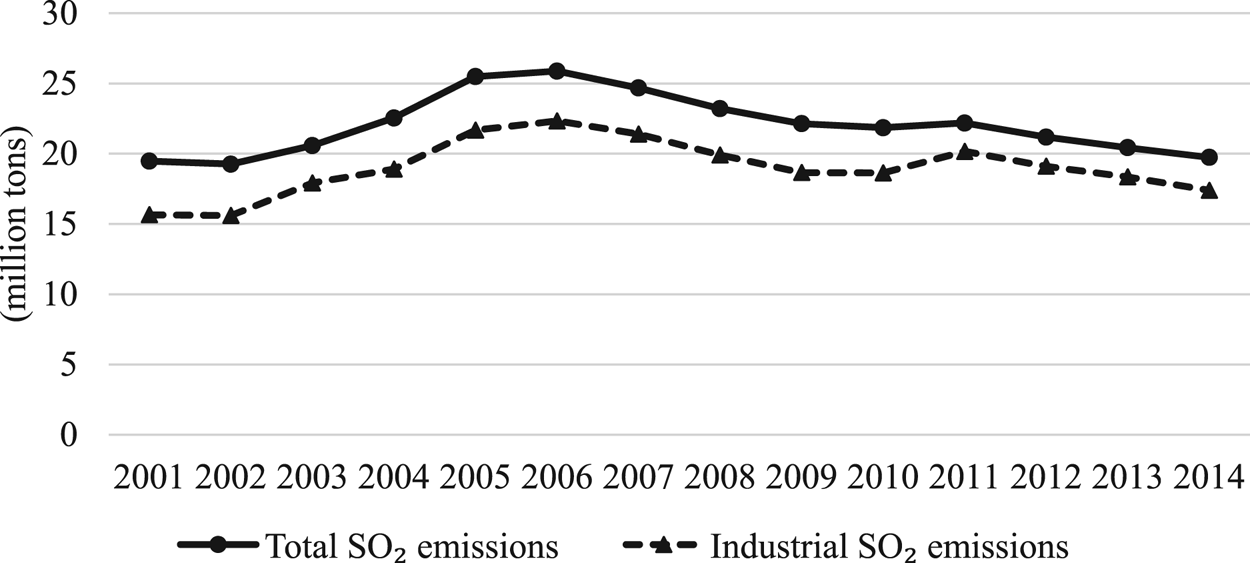
Reducing SO2 emissions, especially industrial SO2 emissions, has been a priority for China's environmental authorities since the 1990s. For example, China began to formulate emission-reduction policies for SO2 from the 9th Five-year Plan (from 1996 to 2000). SO2 reduction was also enacted in the 10th Five-year Plan (from 2001 to 2005) by setting a 10 per cent SO2 reduction target. However, this reduction target was not well implemented at the local level. Figure 1 presents the trend of SO2 emissions and industrial SO2 emissions during our sample period. Total SO2 emissions increased by roughly 31 per cent, from 19.5 million tons in 2000 to 25.5 million tons in 2005. Notably, these emissions peaked in 2006, the year before the 17th NCPC.
SO2 emissions in China (2001–2014).
Data source: China Statistical Yearbook.

The 11th Five-year Plan (from 2006 to 2010) also set the same 10 per cent SO2 reduction target. However, to force local governments to adhere to the pollution reduction policy, local officials would be held accountable for reaching the pollution reduction target set by the central government in their administrative region during the 11th Five-year Plan period, including the SO2 reduction target (Chen et al., Reference Chen, Li and Lu2018). Since then, environmental performance has been included as an indicator when evaluating the performance of local officials. As a result, total SO2 emissions decreased by roughly 15.5 per cent, from 25.8 million tons in 2006 to 21.8 million tons in 2010. However, total SO2 emissions rose again in 2011 – the year before the 18th NCPC – and then declined in the years that followed. Notably, the changing trends of industrial SO2 emissions are consistent with total SO2 emissions. Overall, SO2 emissions at the national level have remained relatively high and have shown relevance to the NCPC.
According to the dates of PCPCs in each province, we construct the time dummy variables of the PCPC cycle during the sample period for each province, including one year before PCPCs (pre1), two years before PCPCs (pre2), the convening year (t0), one year after PCPCs (post1) and two years after PCPCs (post2). Unlike the date of the NCPC, the dates of PCPCs are not uniform. For example, the NCPC was held in October 2007 and November 2012 during our sample period, whereas PCPCs were usually held before the NCPC. Thirteen provinces (i.e., Anhui, Fujian, Hebei, Henan, Hunan, Guangxi, Jiangsu, Jiangxi, Inner Mongolia, Liaoning, Shanxi, Xinjiang and Yunnan) held a PCPC between September and December one year before the NCPC (2006 and 2011). Seventeen provinces (i.e., Beijing, Chongqing, Gansu, Guangdong, Guizhou, Hainan, Heilongjiang, Hubei, Jilin, Ningxia, Qinghai, Shaanxi, Shandong, Shanghai, Sichuan, Tianjin and Zhejiang) held a PCPC between April and June in the convening year of the NCPC (2007 and 2012). The constituent units of these two groups are randomly distributed and irrelevant to factors such as economic development and geographical location. Therefore, we can effectively distinguish the congress effect from the time effect by using the different convening times of PCPCs between the two groups of provinces.
We match the pollution data of 281 prefecture-level and above cities in China from 2003 to 2014 with the corresponding personal attributes data of city leaders (including party committee secretaries and mayors) and the PCPC cycle to test the relationship between the PCPC cycle and pollution. The basic empirical model is as follows:

where i denotes city; t represents year; SO2 stands for industrial SO2 emission intensity; and t0, post1, pre1 and pre2 represent the time dummy variables for the year in which PCPCs are held, one year after PCPCs, one year before PCPCs and two years before PCPCs, respectively. We set post2 (two years after PCPCs) as the control group to avoid complete multiple collinearities. C controls for the personal features of the city leaders, including age, education, local work experience and tenure. X is the set of control variables at the city level, including economic development, industrial structure, population density, FDI and environmental protection. f is the city-fixed effect used to control for time-invariant cross-city differences, while v is the time-fixed effect used to flexibly control for trends or abrupt shocks common to all cities. u is a random error term.
The error term may be spatially correlated and serially correlated within a given city over time. To accommodate potential spatial and serial correlations and heteroscedasticity, we estimate standard errors that are clustered within cities and within years, following the two-way clustering approach proposed by Cameron et al. (Reference Cameron, Gelbach and Miller2011).
Moreover, we control for city leader personal attributes, including age, education, local work experience and tenure of office, which may affect leaders’ personal preferences and political incentives. Furthermore, we include variables such as economic development level, population density, industrial structure, FDI and environmental protection in the model to control for the impact of socio-economic factors on pollution emission intensity at the city level.
We match city leaders’ data with the macroeconomic data on leader tenure; specifically, each city-year observation is matched with a party secretary and a mayor. Notably, officials are inaugurated into or leave an office in the middle of a year, rather than in December or January. Therefore, two different officials may occupy a position within a city-year observation. We use the method proposed by Li and Zhou (Reference Li and Zhou2005) to calculate officials’ tenure. Specifically, if an official takes office between January and June, his/her tenure is deemed to begin in the inaugural year; if the official takes office between July and December, his/her tenure is deemed to begin in the next year after inauguration. This treatment is adopted because there is a certain time lag for newly inaugurated officials to have an actual impact on the urban economy. Moreover, we distinguish between the city-level positions of party secretary and mayor. A city official who first takes up the position of mayor and then is promoted to party secretary in the same city belongs to two different samples. The promotion reflects past performance, and a new round of evaluation is launched after the new position is filled (Li and Zhou, Reference Li and Zhou2005).
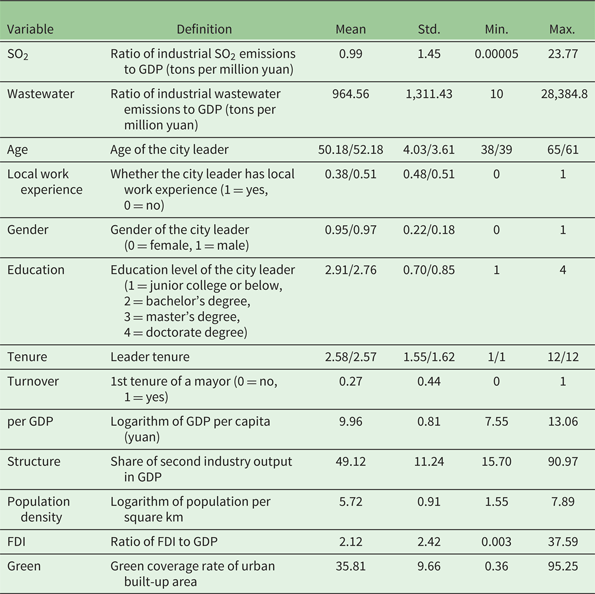
Data on PCPC events and city leaders were collected from official websites. Pollution emissions data and other annual macroeconomic data are sourced from the China City Statistical Yearbook. Definitions and descriptive statistics of these variables are shown in table 2.
Definitions and descriptive statistics of variables

Note: Values on the left side of the ‘/’ are the statistics of mayors, while data to the right side represent the statistics of party secretaries.
4. Empirical results and discussion
4.1. Baseline regression
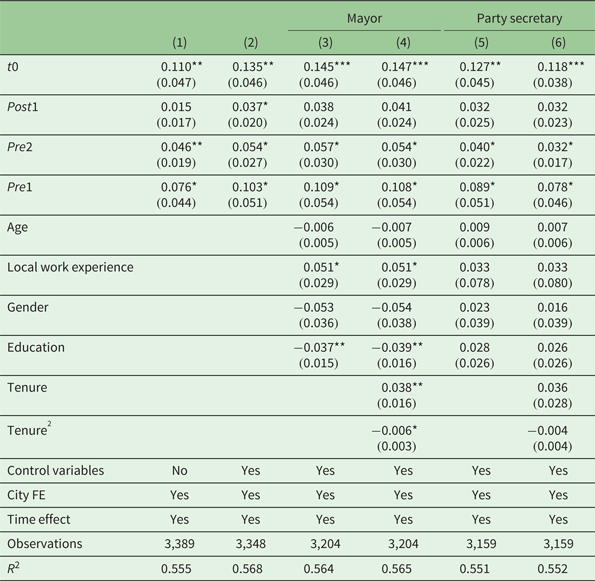
Table 3 presents the estimation results of equation (1). In column (1), we investigate only the relationship between the PCPC cycle and the emission intensity of industrial SO2, while we control for city macroeconomic variables in column (2). In columns (3) to (6), we add the personal attributes data of mayors and party secretaries. The coefficients of the dummy variables two years before PCPCs, one year before PCPCs and the convening year are all significantly positive after adding the control variables, while the estimated coefficient of the convening year is the largest when compared to the estimation coefficients of other dummies of PCPCs. The results indicate that the emission intensity of industrial SO2 begins to rise in the two years before PCPCs, reaches its peak in the convening year and declines thereafter. The emission intensity of industrial SO2 indicates the periodic feature of an increase before a PCPC and a decrease after a PCPC.
Benchmark regression results

Notes: The dependent variable is the ratio of industrial SO2 emissions to GDP.
*, ** and *** Represent significances at 10%, 5% and 1% levels, respectively. Robust standard errors are in parentheses, clustered within cities and years. Columns (1) and (2) are city-year observations, columns (3) and (4) are mayor-city-year observations, and columns (5) and (6) are party secretary-city-year observations.
City officials rationally arrange the resource input under the political incentives for pursuing economic performance during the PCPC cycle. Before PCPCs, city officials have political incentives to develop the local economy, and these incentives continue into the convening year of the PCPCs while officials complete the evaluation requirements and improve their likelihood of promotion (Tsai, Reference Tsai2016; Huang and Du, Reference Huang and Du2017). Short-term economic growth requires huge investments and energy consumption while also causing massive pollution (Wu et al., Reference Wu, Deng, Huang, Morck and Yeung2014; Persson and Zhuravskaya, Reference Persson and Zhuravskaya2016). Additionally, city officials have inadequate incentives to enforce stringent environmental regulations that may also constrain economic growth (Cole et al., Reference Cole, Elliott and Zhang2011; Zheng et al., Reference Zheng, Kahn, Sun and Luo2014). Therefore, pollution emission intensity increases before PCPCs and peaks in the convening year.
In contrast to the existing literature, the present study highlights a downward trend of pollution emission intensity after PCPCs, which reveals that the political incentives for city officials to pursue short-term economic performance also decline after PCPCs. Notably, officials face less evaluation pressure and a lower turnover expectation after PCPCs (Shi and Xi, Reference Shi and Xi2018). Rational officials then adjust their previous aggressive growth strategies, resulting in mitigation of environmental pollution. Overall, environmental pollution is closely related to the political incentives of city officials for the pursuit of short-term economic performance and the neglect of environmental protection. The political pollution cycle associated with the PCPC cycle provides evidence for the existence of such political incentives.
4.2. Tenure of office
Local officials have different political incentives to pursue economic performance at different stages of their tenure. The official tenure of party and government leaders is five years, and each leader serves no more than two terms in the same position (Li and Zhou, Reference Li and Zhou2005). Confronted with these tenure constraints, career-focused officials choose different resource allocation strategies at different stages of their tenure to maximize their utility (Huang and Du, Reference Huang and Du2017). Thus, tenure constraints create new incentives for local officials, which consequently affect pollution emission intensity.
Political incentives for the short-term economic performance of new city officials might not increase immediately after inauguration because there is a weaker expectation of further promotion in a short period. With the extension of tenure, officials’ turnover expectations increase, while the political incentives for short-term economic performance also grow (Chen et al., Reference Chen, Tang, Wan and Chen2017). Thus, the extension of city leader tenure leads to an increase in pollution emission intensity. However, the political incentives of local officials for short-term economic performance decline if officials’ tenures are overly long or leaders end their tenure due to age restrictions (Guo, Reference Guo2009). Therefore, the tenures of city leaders may have a non-linear effect on pollution emission intensity.
In columns (4) and (6) of table 3, we further control for tenure and its square term of mayors and party secretaries, respectively. An inverted U-shaped curve characterizes the relationship between mayor tenure and the emission intensity of industrial SO2. This curve implies that as mayor tenure increases, emission intensity also increases at the initial stage of tenure and declines after a certain turning point. This turning point occurs in the third year of mayor tenure, or two years before the end of a five-year tenure. This finding is consistent with Guo (Reference Guo2009), who found that growth in local government spending is fastest during a leader's third and fourth years in office. However, the coefficients of party secretary tenure and its square term are not statistically significant.
The impact of the officials’ age and gender on the intensity of industrial SO2 emissions is not statistically significant. However, mayors’ career backgrounds, including education and work experience, have a significant impact on the intensity of industrial SO2 emissions. Mayors with higher levels of education and those without local work experience may be more concerned about environmental issues. This finding is consistent with some existing studies, such as Zheng et al. (Reference Zheng, Kahn, Sun and Luo2014).
In practice, the Communist Party Committee is the leading structure at all levels in China. The party secretary of a city is the leader of the city Communist Party Committee and is responsible for the party and government affairs. The mayor is the chief executive of a city and is mainly responsible for economic development and social management (Yao and Zhang, Reference Yao and Zhang2015). Therefore, the official evaluation system based on economic performance focuses more on mayors than Party Committee officials because mayors have stronger political incentives to pursue economic performance (Zheng et al., Reference Zheng, Kahn, Sun and Luo2014).
The inverted U-shaped relationship between the intensity of industrial SO2 emissions and mayor tenure reveals that city officials have different political incentives to pursue short-term economic performance at different stages of their tenure. Notably, intensity of industrial SO2 emissions still exhibits a periodic feature associated with the PCPC cycle after controlling for city leader tenure.
4.3. Turnover effect
An important role of PCPCs is to assess the work of governments and officials, and the convening year and year after PCPCs are the main periods for official turnover (Shi and Xi, Reference Shi and Xi2018). The turnover of city leaders changes the leadership structure of a city and influences local economic growth. As the ancient Chinese proverb says, ‘a new broom sweeps clean.’ In other words, new leaders face a new round of evaluation requirements and usually demonstrate political achievements through the implementation of new policies; however, these activities take time to be effective. Notably, the turnover of city leaders may cause a short-term fluctuation in economic growth (Chen and Kung, Reference Chen and Kung2016). Therefore, the reduction in pollution emission intensity after a PCPC may be related to the turnover of city leaders.
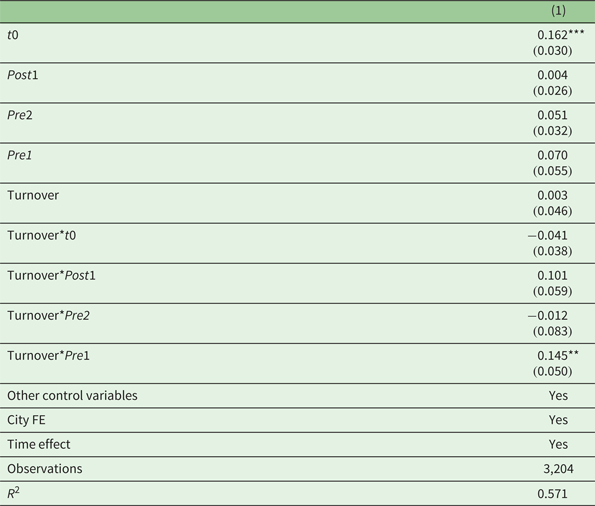
Considering the significant impact of mayor tenure on pollution emission intensity, we add a dummy variable for mayor turnover to the baseline regression model and construct the interaction terms between mayor turnover and the dummy variables of the PCPC cycle to control the impact of mayor turnover on pollution emission intensity. The results presented in table 4 demonstrate that the impact of turnover on industrial SO2 emission intensity is not significant and that only the turnover of mayors in the year before the PCPCs has a significantly positive impact on the pollution emission intensity for that year. Turnover in the year before the PCPCs can significantly enhance the political incentives of new mayors to pursue short-term economic performance and to attain a good assessment in the coming year, which leads to a sharp increase in pollution emission intensity.
Estimation of the impact of mayor turnover on pollution emission intensity

Note: The dependent variable is the ratio of industrial SO2 emissions to GDP.
** and *** represent significances at 5% and 1% levels, respectively. Robust standard errors are in parentheses, clustered within cities and years.
4.4. Regional heterogeneity test
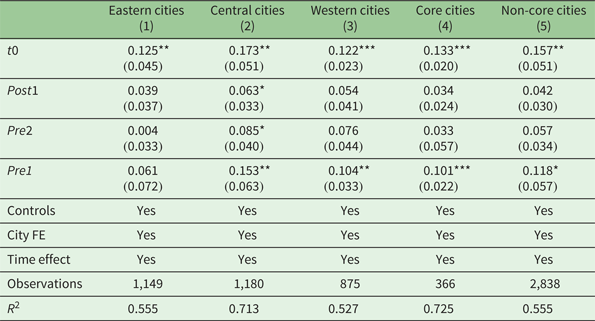
Due to differences in economic development level and administrative level, the evaluation criteria faced by city leaders in different regions may differ, as may the political incentives to pursue economic growth. China's eastern region has the highest level of economic development, followed by the central region and the western region (Huang and Du, Reference Huang and Du2017). Accordingly, we divide the sample cities into eastern, central and western cities to investigate the relationship between the PCPC cycle and pollution emission intensity.
The regression results are presented in columns (1), (2) and (3) of table 5. The emission intensity of industrial SO2 in the central and western regions shows the periodic feature of rising before PCPCs and decreasing thereafter. However, in the most economically developed eastern region, only the dummy variable of the convening year is significantly positive, which indicates a weak periodic feature.
Regression results of subsamples

Notes: The dependent variable is the ratio of industrial SO2 emissions to GDP.
*, ** and *** Represent significances at 10%, 5% and 1% levels, respectively. Robust standard errors are in parentheses, clustered within cities and years. Samples are mayor-city-year observations.
Chinese cities have different administrative levels. For example, municipalities directly under the central government are provincial-level cities, while provincial capitals and municipalities with independent planning status are (quasi) sub-provincial-level cities. Notably, the administrative level of these core cities is higher than that of the other prefecture-level cities (Li et al., Reference Li, Wei, Liao and Huang2015). As a result, the leaders of these core cities have a higher administrative level than other prefecture-level city leaders. We further divide the sample cities into two categories – core cities (including provincial capitals and municipalities with independent planning status) and non-core cities – to investigate the relationship between the PCPC cycle and industrial SO2 emission intensity.
Column (4) in table 5 presents the estimated result using the sub-sample of core cities, and column (5) presents the estimated result using the sub-sample of other prefecture-level cities. The findings indicate that the emission intensity of industrial SO2 in non-core cities and core cities has a periodic feature associated with the PCPC cycle; that is, the emission intensity increases before a PCPC and then declines thereafter.
4.5. Robustness test
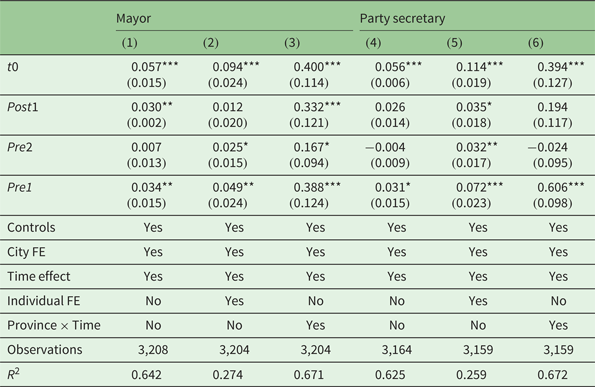
In addition to air pollution, water pollution is another severe problem facing China. Industrial wastewater dumping by manufacturing firms has rendered the water in many lakes and rivers unfit for human consumption (Ebenstein, Reference Ebenstein2012). Worse still, when compared to public concern for air pollution, water pollution has not aroused enough public attention. Therefore, as a robustness test, we use the intensity of industrial wastewater emissions to measure environmental pollution. The results are presented in columns (1) and (4) of table 6. The emission intensity of industrial wastewater also shows a periodic feature that rises before a PCPC, peaks in the convening year and declines thereafter.
Robustness test results

Notes: The dependent variables in columns (1) and (4) are the ratio of industrial wastewater emissions to GDP. The dependent variables in columns (2), (3), (5) and (6) are the ratio of industrial SO2 emissions to GDP.
*, ** and *** Represent significances at 10%, 5% and 1% levels, respectively. Robust standard errors are in parentheses. Columns (1), (3), (4) and (6) are clustered within cities and years, while columns (2) and (5) are clustered within city-officials and years. Columns (1), (2) and (3) are mayor-city-year observations and columns (4), (5) and (6) are party secretary-city-year observations.
Although we control for the personal attributes of city leaders, such as age, education, local work experience and tenure, in the baseline regression model, we may still miss some personal attributes closely related to leaders’ political incentives. We further add an individual fixed effect in the model to eliminate the impact of missing personal attributes on the estimation results in columns (2) and (5) of table 6, which are consistent with those in table 3. Notably, the emission intensity of industrial SO2 continues to present a periodic feature that rises before PCPCs, peaks in the convening year and declines thereafter.
We set the city-fixed effect to control for time-invariant cross-city differences and set the year-fixed effect to control flexibly for trends or abrupt shocks common to all cities in the baseline regression. However, common time effects and time-invariant effects would not account for local time-varying factors that could be correlated with both industrial SO2 emissions intensity and the political incentives of local officials. For example, the surrounding regions of Beijing enforced stringent environmental regulations to create the ‘Olympic Blue’ during the Olympic Games (He et al., Reference He, Fan and Zhou2016). Regions with severe environmental pollution are facing higher pressure to reduce SO2 emissions and meet the SO2 reduction target. We set an interaction term between time dummies and region dummies to control for the additional time-varying geographical effects.Footnote 1 Results are shown in columns (3) and (6) of table 6. Our previous results are unaffected after controlling for the province-year fixed effect.
5. Conclusion
Although China's rapidly growing economy has brought many benefits, the adverse effects of pollution threaten to mitigate the benefits of the country's newfound wealth. Despite an increase in clean-up efforts in recent years, the overall degradation of China's environment continues. Environmental issues in China are closely related to political incentives for local government officials to pursue economic growth at the expense of environmental protection. The PCPCs represent a key period for the assessment and turnover of city leaders. The PCPC cycle can be used to capture the changes in political incentives for city leaders to pursue short-term economic performance.
In this study, we use the exogenous event of PCPCs to explore the impact of city leaders’ political incentives on pollution emission intensity. The results indicate that pollution emission intensity has a periodic feature of rising before a PCPC and decreasing thereafter. This political pollution cycle reveals that local officials have incentives to pursue short-term economic performance at the expense of environmental protection. Additionally, turnover in the year before a PCPC can significantly enhance a new mayor's political incentives to pursue short-term economic performance, as new mayors aim to achieve a good assessment when the PCPC is held in the following year. Therefore, mayor turnover in the year before a PCPC leads to a surge in pollution emission intensity.
Our results have important policy implications for designing optimal environmental policies in China. The central government must formulate a more incentive-compatible environmental management policy to effectively reduce pollution emissions, improveenvironmental quality and achieve sustainable development goals. The integration of environmental management objectives and economic development objectives into the evaluation systems of local governments and officials would help to implement central government policies aimed at environmental protection.
Acknowledgements
We acknowledge financial support from the National Social Science Fund of China (No. 18BZZ057), the Shanghai Philosophy and Social Science Fund Project (No. 2017BZZ002), and the Humanities and Social Sciences Pre-Research Fund of Zhejiang University of Technology. We thank Rifang Shen for her contribution in data collection. We are also very grateful to the anonymous reviewers and editors for their valuable comments that helped us sufficiently improve the quality of this paper.