) regime and as such serve as model systems for investigating the correlation between thermodynamic and kinetic properties as well as exhibiting high performance figures of merit in the above applications. In this paper, we extend recently published results for Pr
I. INTRODUCTION
Nonstoichiometric oxides with either the fluorite or perovskite structure are of great interest in energy conversion, automotive emissions control, and gas sensing applications given their ability to support high levels of oxygen ion and/or electronic transport with consequent ready exchange of oxygen with the gas phase. As such, they find use as oxygen permeation membranes, electrodes in solid oxide fuel cells (SOFCs), oxygen storage materials in three-way catalysts, and chemoresistive gas sensors. Fluorite-structured ceria (CeO2) readily forms highly oxygen-deficient solid solutions with lower valent cations such as Gd, Sm, and Y and exhibits some of the highest recorded oxygen ion conductivities at elevated temperatures. This renders it of great interest as a solid electrolyte in intermediate temperature SOFCs.Reference Inaba and Tagawa1, Reference Steele2 Under reducing conditions, at elevated temperatures, Ce begins to reduce to the 3+ valence state, resulting in the introduction of both vacancies and quasi-free electrons, leading to mixed ionic and electronic conductivity (MIEC) and the degradation of its electrolytic properties.Reference Tuller and Nowick3, Reference Tuller and Nowick4 On the other hand, MIEC materials can be advantageous, e.g., as electrodes in SOFCs since they render the entire electrode surface active for the reduction or oxidation of oxygen, as opposed to being limited to the triple-phase boundaries.Reference Adler5 Furthermore, oxygen separation membranes utilizing MIECs allow for single-phase materials to simultaneously provide both oxygen diffusion and the necessary counterflow of electrons. The introduction of more easily reduced cations such as Pr or Tb into ceria allows the material to begin to reduce even under oxidizing conditions.Reference Chatzichristodoulou, Hendriksen and Hagen6, Reference Bishop, Stefanik and Tuller7
In recent publications, the authors of this work reported in detail on the defect,Reference Bishop, Stefanik and Tuller7–Reference Stefanik and Tuller9 transport,Reference Bishop, Stefanik and Tuller7, Reference Stefanik and Tuller9, Reference Chen, Bishop and Tuller10 optical,Reference Bishop, Kim, Thompson, Chen, Kuru, Stefanik and Tuller11 and mechanicalReference Marrocchelli, Bishop, Tuller and Yildiz12–Reference Kuru, Bishop, Kim, Yildiz and Tuller14 properties of PrxCe1−xO2−δ (PCO) with x = 0.1. Some of the important features of Pr0.1Ce0.9O2−δ include the introduction of MIEC behavior under oxidizing conditions; sample coloration, connected with the formation of a Pr-based impurity band; as well as chemical expansion accompanied by a decrease in the energy needed to form oxygen vacancies with reduction. In this paper, we examine a range of compositions in the PCO system from x = 0.002 to 0.20 to understand how both defect and transport parameters depend on x. Important observed trends with increasing x include increases in oxygen ion migration energy and MIEC and reductions in vacancy formation and Pr ionization energies. The implications these changes have for potential applications of PrxCe1−xO2−δ are discussed.
II. THEORY
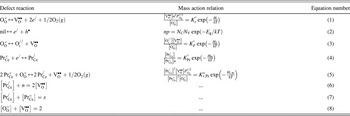
The key defect reactions describing the reduction of ceria, electron–hole generation, oxygen anti-Frenkel disorder, and Pr reduction are summarized, using Kröger–Vink notation, in Table I (see also Ref. Reference Tuller and Bishop8). In each case, the defect reaction and the corresponding mass action equation is provided in terms of the corresponding equilibrium constants  , where T, k, and Hi are the absolute temperature, Boltzmann constant, and enthalpy of the reaction i, respectively. It should be noted that Eq. (5) is simply the product of Eq. (1) and the square of Eq. (4) and thus,
 . The effective reduction enthalpy,
 , is thus reduced (
 is negative) from that of undoped ceria,
 , by twice the ionization energy of Pr,
 .
Key defect reactions and associated mass action relations are listed in Eqs. (1)–(5), the approximated charge neutrality relationship is Eq. (6), the Pr mass conservation relationship is Eq. (7), and the oxygen site conservation relationship is Eq. (8).

In the charge neutrality relation [Eq. (6); Table I], it is assumed that p and oxygen interstitial concentration,  , are negligible given that PCO is assumed to be oxygen deficient at all accessible experimental conditions. The mass and site conservation relationships, on a molar basis, are given by Eqs. (7) and (8) in Table I, respectively. Equations (1)–(8) were rearranged and numerically solved for the concentrations of all listed species.
Given the large changes in stoichiometry that can be induced in the ceria system upon reduction, it would come as no surprise to find that the enthalpy of reduction of both undoped and Pr-doped ceria would vary with nonstoichiometry. This was indeed found previously for Pr0.1Ce0.9O2−δ with the enthalpy following a linear dependence of the form.Reference Stefanik and Tuller9

where  is the enthalpy of reduction when the oxygen vacancy concentration is zero (i.e., in PrxCe1−xO2−δ) and f is the linear coefficient.
The total electrical conductivity of a solid is given as the sum of all species that contribute to conduction through the following equation.

where zi, e, and  are the ith specie’s charge, charge of an electron, and mobility, respectively. The mobility of an ion or a small polaron in the dilute concentration is defined as,Reference Tuller and Nowick4
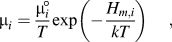
where  is the mobility preexponential and
 is the enthalpy of migration for the charge carrier. Equation (11) is used for both oxygen vacancies and electrons in the ceria conduction band. The small polaron model requires hopping of an electron from a Pr3+ to a Pr4+, meaning that when the concentration of Pr3+ is high and Pr4+ is low, there is a low probability of an available site to jump into and so mobility decreases. This type of conduction is described by the following equation for PCO with x = 0.1 and 0.2.Reference Tuller and Nowick4

For small polaron conduction within the ceria conduction band,  is assumed to remain dilute so that all neighboring Ce sites can be assumed to be available for a jump. Thus, for electron hopping in the ceria conduction band, Eq. (11) can be used instead.
III. EXPERIMENTAL METHODS
PrxCe1−xO2−δ sample preparation and measurement is discussed in detail previouslyReference Bishop, Stefanik and Tuller7, Reference Stefanik15 with a brief description given here. Powders were prepared for values of x = 0, 0.002, 0.008, 0.1, and 0.20 by oxalate coprecipitation (OP).Reference Van Herle, Horita, Kawada, Sakai, Yokokawa and Dokiya16 In OP, a 1 M solution of metal nitrates was dripped into 0.5 M oxalic acid with complete precipitation of the metals, followed by filtering, drying, and calcination at 700 °C for at least an hour to form PCO. The powders were pressed to yield either cylindrical or bar pellets and sintered at >1400 °C.
Samples were cut into bars approximately 3 × 3 × 10 mm for four-point DC conductivity measurements. Pt wires were wrapped around the bar at four different positions and Pt paste (Englehard #6082, Iselin, NJ) was applied to make good connections between each wire and the bar. A Nernst-type zirconia oxygen sensor monitored the  , controlled either by mixtures of inert gas and oxygen, a homemade oxygen pump, or controlled mixtures of CO and CO2. The error in conductivity measurements was estimated to be 7% of each measured value.
Wave length dispersive spectroscopy was performed to determine the Pr concentration using a JEOL electron microprobe (JXA-733 Superprobe) with metal phosphate standards before measurement. Phase purity was confirmed using x-ray diffraction on a Rigaku powder diffractometer (Rigaku Corporation, Tokyo, Japan).
Defect and conductivity modeling was performed using Matlab (Mathworks, Natick, MA). Unless otherwise stated, parameters in the models were determined using the Gauss–Newton method of nonlinear regression with partial derivatives approximated numerically (see, e.g., Ref. Reference Bishop, Stefanik and Tuller7). Initial estimations were refined visually and then, regression was performed in a stepwise iterative manner, with a maximum of two parameters being determined at a time to avoid instabilities in the program. Error estimates for modeled parameters are reported for an approximate 95% confidence interval of the regressed model.
IV. RESULTS
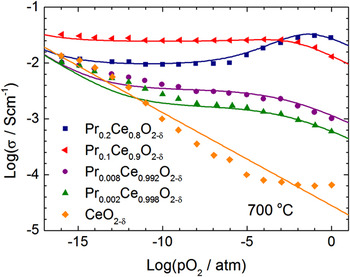
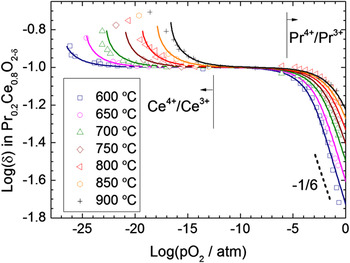
The oxygen partial pressure dependence of the electrical conductivity, measured at 700 °C, is plotted in Fig. 1 as a function of Pr content, x in PrxCe1−xO2−δ. Starting from highly reducing conditions, as  is increased, all compositions show a decrease in conductivity, reaching a plateau, followed by either an increase (x = 0.2), a further decrease in conductivity (0 < x < 0.2), or nominally no change (x = 0). The plateau in conductivity correlates with a plateau in oxygen stoichiometry as seen, e.g., in Fig. 2 (for x = 0.2), with δ increasing as
 is reduced and decreasing as
 is increased at the two extremes of the plateau, respectively.
Log s versus log  for a series of compositions in the system PrxCe1−xO2−δ (of x = 0, 0.002, 0.008, 0.1, 0.20) measured at 700 °C. Data for x = 0.1 previously reported in Ref. Reference Bishop, Stefanik and Tuller7.

Log δ plotted against log  for Pr0.2Ce0.8O2−δ for a series of isotherms. The present defect model (solid lines) is fit to experimental data (points) from Ref. Reference Chatzichristodoulou and Hendriksen17.

The low  conductivity dependence arises from the reduction of cerium with the consequent generation of additional oxygen vacancies (as observed in Fig. 2) along with electrons (small polarons) consistent with the defect reaction given in Eq. (1) and with charge neutrality, Eq. (6), simplified as
 .Reference Tuller and Nowick3, Reference Tuller and Nowick4 This, in turn, leads to mixed ionic electronic conductivity. In the intermediate
 region, where the conductivity exhibits a plateau, cerium remains largely as Ce4+, while Pr is fully reduced to Pr3+, thereby acting as an acceptor dopant with Eq. (6) simplified as
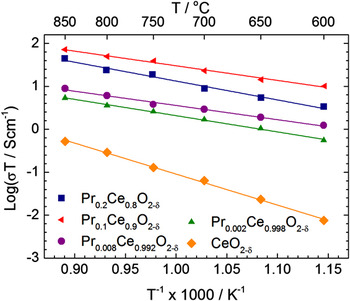
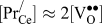 . Similarly, background impurities, with 3+ or 2+ valence, fix the oxygen vacancy concentration for nominally undoped ceria.Reference Tuller and Nowick3 In this ionic plateau region, therefore, the activation energy for electrical conduction is characterized solely by the oxygen ion migration energy [see Eqs. (10) and (11)].
At high  , Pr3+ oxidizes to Pr4+, resulting in (i) a decrease in the oxygen vacancy concentration, and hence ionic conductivity, and, (ii) only at large enough Pr concentrations, an electronic contribution from electron hopping between Pr ions having formed an impurity band.
The concentration of oxygen vacancies was modeled using thermogravimetrically derived data (for x = 0.2Reference Chatzichristodoulou and Hendriksen17 and 0.1Reference Bishop, Stefanik and Tuller7) by numerically solving Eqs. (1), (2), (4), and (6)–(9) as discussed previously in Ref. Reference Bishop, Stefanik and Tuller7, with fitting to the data performed first visually and then refined with a least squares-based analysis.  and
 were obtained from the low
 region (i.e., Ce4+/Ce3+ redox), and
 and
 were obtained from the high
 region (i.e., Pr4+/Pr3+ redox) with the dependence of
 on defect concentration, f, also derived and reported in Table II. The results of the fitting procedure are shown in Fig. 2 for x = 0.2, while those for x = 0.1 were presented previously in Ref. Reference Bishop, Stefanik and Tuller7. At the lowest
 , the model deviates positively from the data, as previously observed for the ceria system, and is believed to be associated with defect ordering.Reference Bishop, Duncan and Wachsman18
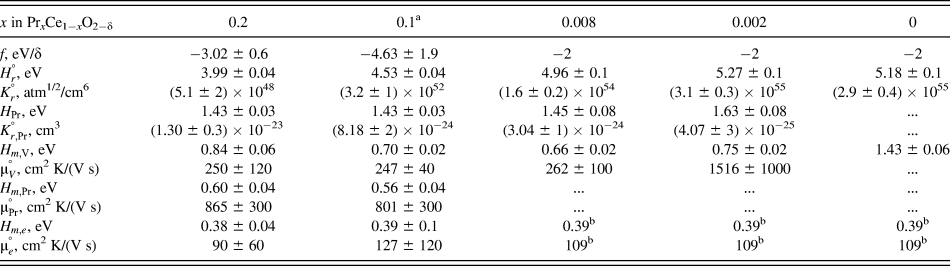
Tabulation of the key thermodynamic and kinetic parameters defining defect generation and transport in PrxCe1−xO2−x/2 for studied values of x.
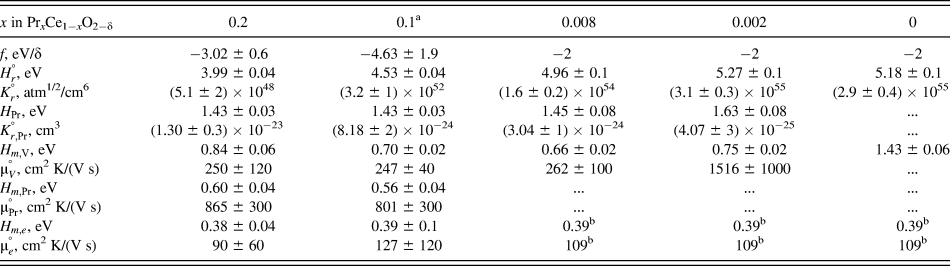
a From Ref. Reference Bishop, Stefanik and Tuller7.
b Average of values for x = 0.2 and 0.1.
As discussed above, the plateau region at intermediate  is predominantly ionic and characterized by the activation energy for oxygen vacancy mobility,
 . These data are plotted as log σT versus T−1 in Fig. 3 as a function of x in PrxCe1−xO2−δ, with values of
 extracted from these Arrhenius plots reported in Table II. Next,
 and
 in the low
 region,
 in the intermediate
 region, and
 and
 in the high
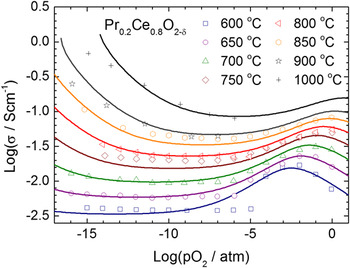
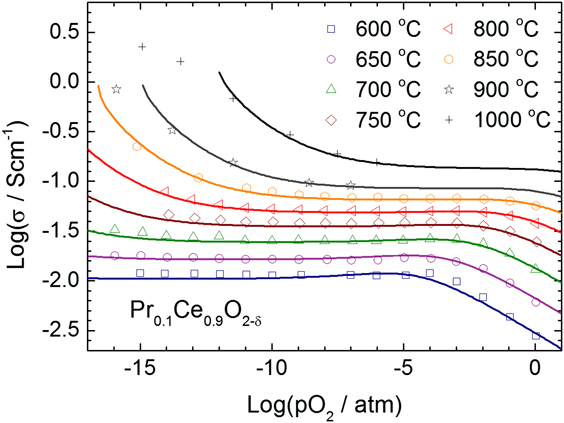
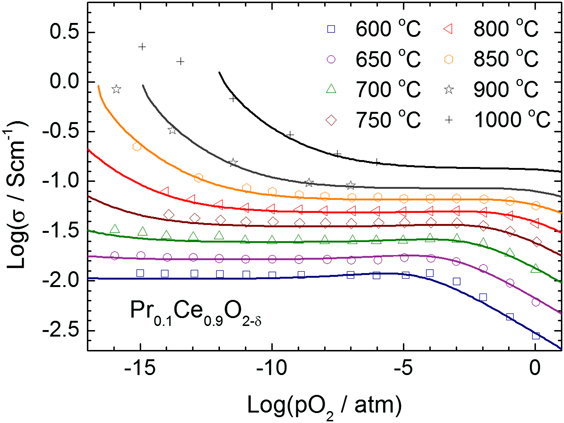
 region were derived by fitting the conductivity model to the data [Eqs. (10)–(12)], using defect concentrations obtained from the previously derived defect equilibrium model. The resulting fits to conductivity data are shown in Figs. 4 and 5 for x = 0.2 and 0.1, respectively, with values for the parameters reported in Table II.
The Ionic conductivity of PrxCe1−xO2−δ versus reciprocal temperature for different values of x obtained from the plateau region at intermediate  .

Experimental electrical conductivity data (points) for Pr0.2Ce0.8O2−δ are reported for a series of isotherms from 600 to 1000 °C. Solid lines represent predictions of the model derived in this study.

Experimental electrical conductivity data (points) for Pr0.1Ce0.9O2−δ are reported for a series of isotherms from 600 to 1000 °C. Solid lines represent predictions of the model derived in this study. Data and modeled values for 600–900 °C previously reported in Ref. Reference Bishop, Stefanik and Tuller7.
For the cases of x = 0, 0.008, and 0.002, there are no oxygen nonstoichiometry data available, requiring estimation of the thermodynamic parameters from conductivity measurements alone. Small polaron mobility via the Ce 4f band is reported not to be highly sensitive to either x or δ,Reference Tuller and Nowick4, Reference Stefanik and Tuller9 so  and
 were taken as the average of their respective values for x = 0.2 and 0.1. It was found that σ was mostly insensitive to f, except at low
 and high T (i.e., high δ) with an estimate of f = 2 found to yield good fits in these regions. Additionally, the conductivity model was simplified by removing transport parameters associated with small polaron hopping on Pr ions since it was found that the conductivity for these compositions could be explained in the high
 regime assuming only contributions from oxygen ion conductivity. Therefore,
 and
 were obtained by fitting to the data in the low
 region,
 was obtained in the intermediate
 region (using
 from Fig. 3), and
 and
 were obtained from the high
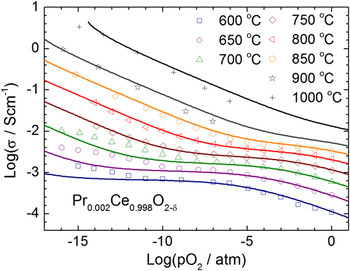
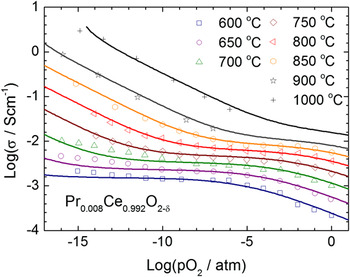
 region, with values reported in Table II. The results of the model fits are shown in Figs. 6 and 7.
Experimental electrical conductivity data (points) for Pr0.008Ce0.992O2−δ are reported for a series of isotherms from 600 to 1000 °C. Solid lines represent predictions of the model derived in this study.

Experimental electrical conductivity data (points) for Pr0.002Ce0.998O2−δ are reported for a series of isotherms from 600 to 1000 °C. Solid lines represent predictions of the model derived in this study.

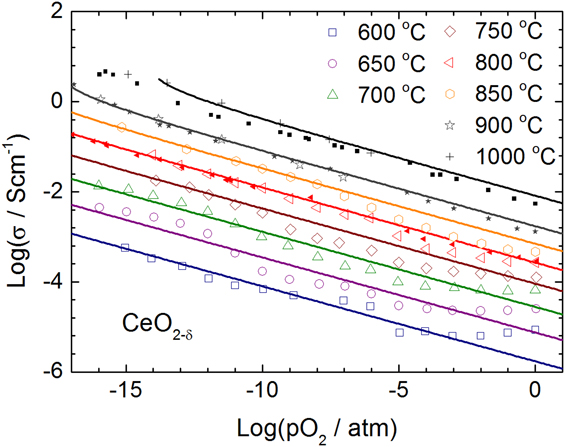
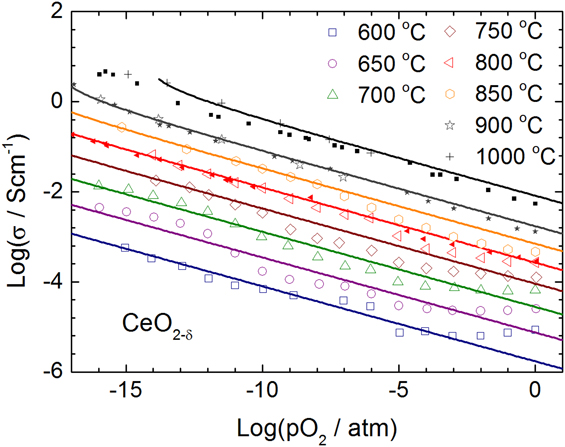
For the case of nominally undoped ceria (Fig. 8), only the Ce4+/Ce3+ redox is considered, and since there is no intentionally added dopant, the conductivity is dominated by small polaron hopping on Ce ions (except at high  and low temperature as discussed later). Like in the previous case,
 and
 were taken as the average of their respective values for x = 0.2 and 0.1, with f = 2 found to yield good fits in high δ regions, thus leaving only
 and
 to be extracted from fitting the conductivity data at low to intermediate
 . At high
 and temperatures below 800 °C, the conductivity exhibits the aforementioned plateau, the origin of which is discussed later.
V. DISCUSSION
A. Ionic and mixed ionic electronic conductivity
The PrxCe1−xO2−δ solid solution system is similar to other acceptor-doped ceria systems such as gadolinium- or samarium-doped ceria in that there is a wide  -independent conductivity regime in which the oxygen vacancy concentration is fixed and equal to half the acceptor ion concentration (i.e.,
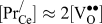 ). Since the conductivity in this regime is predominantly ionic, and the carrier density is known, it is possible to readily calculate the oxygen vacancy mobility and migration energy as discussed above in relation to Fig. 3 and Table II.
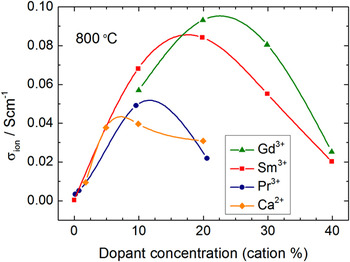
An important figure of merit for such solid electrolytes is the maximum ionic conductivity achievable at a given temperature. The ionic conductivity at 800 °C of PrxCe1−xO2−x/2 (where all Pr is trivalent) is compared against that of GdxCe1−xO2−x/2, SmxCe1−xO2−x/2, and CaxCe1−xO2−x as a function of dopant concentration in Fig. 9. GdxCe1−xO2−x/2 and SmxCe1−xO2−x/2 are typically used as ceria-based solid electrolytes in SOFCs since they have high ionic conductivities (nearly 0.1 S/cm at 800 °C). PrxCe1−xO2−x/2 exhibits similar values of ionic conductivity to those of the other trivalent-doped ceria up to x = 0.1 (i.e., 5 × 10⁻² versus 5.5 × 10⁻² and 7 × 10⁻² S/cm for GdxCe1−xO2−x/2 and SmxCe1−xO2−x/2, respectively), with similar minimum  values of ∼0.7 eV.Reference Faber, Geoffroy, Roux, Sylvestre and Abelard19, Reference Lai and Haile20 However, while the latter two materials reach their peak conductivities at ∼x = 0.2, the Pr-doped system peaks earlier at ∼x = 0.1. Nevertheless, PrxCe1−xO2−x/2 with x = 0.1 and 0.2 still has ionic conductivities of approximately ½ or ¼ of that of the most highly conducting ceria-based electrolytes.
One may ask why the maximum for the Pr (as well as Ca)-doped ceria falls at a lower dopant concentration than that of Gd- or Sm-doped ceria. Both experimental and simulation studies have found for ceria that optimum ionic conductivities are achieved with dopant ions with radii and valence close to that of the host Ce ion. Defect–vacancy interactions become more evident for dopants with radii larger or smaller than the host cation radius, leading to reduced conductivity.Reference Gerhardt-Anderson and Nowick21–Reference Kilner and Waters24 Note that while the ionic radius of Pr4+,  , is very close in size to
 (0.97 Å),
 (1.126 Å) is about 16% larger than
 , which could explain the shift in peak conductivity to lower dopant levels for the Pr-doped system.Reference Shannon25 This is also consistent with the increase in
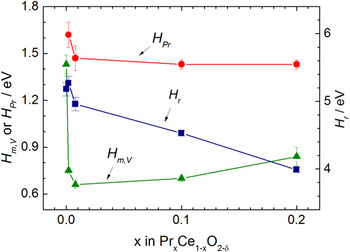
 from 0.70 to 0.84 eV (see Fig. 10 and Table II) as one increases x in PrxCe1−xO2−x/2 from 0.1 to 0.2.
Experimental electrical conductivity data (points) for nominally undoped CeO2−δ are reported for a series of isotherms from 600 to 1000 °C. Solid lines represent predictions of the model derived in this study. Solid points (800, 900, and 1000 °C) represent single crystal conductivity data from the literature.Reference Tuller and Nowick3 Note acceptor-doped behavior at high  and temperatures below 800 °C due to background impurities.
The ionic conductivity measured at 800 °C as a function of acceptor dopant concentration for different ceria solid solutions from Refs. Reference Yahiro, Eguchi, Eguchi and Arai28–Reference Yahiro, Ohuchi, Eguchi and Arai30. For PrxCe1−xO2−x/2, all the Pr are in the trivalent state.

Energies for defect formation or oxygen vacancy migration as a function of Pr content. (Note for x = 0, H Pr is not calculated and Hm, V is evaluated based on background acceptor impurities at high  , and Hr is reported for δ = 1/2[Pr]total.).

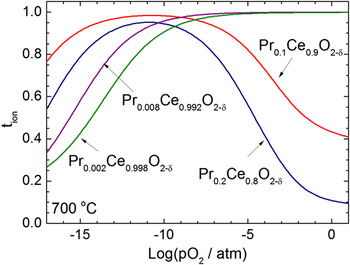
The very high oxygen ionic conductivity of PrxCe1−xO2−x/2 with x = 0.1 and 0.2 is a feature, which becomes particularly important given that both compositions also simultaneously exhibit comparably high electronic conduction at high  as a consequence of electron hopping within the Pr-defect band. This then leads to mixed ionic electronic conduction in a ceria-based material under SOFC cathode conditions (e.g., air). This is illustrated in Fig. 11 in which the ionic transference number (
 ) of the four PrxCe1−xO2−δ solid solutions examined in this study are plotted as a function of log
 for the temperature of 700 °C. As expected, the solid solutions containing low Pr fraction (x = 0.002 and 0.008) are fully ionic above log
 ∼ 10−5 atm, while those with x = 0.10 and 0.20 show levels of electronic conductivity comparable to the ionic conductivity over this
 range. Such mixed ionic electronic conductivity in a ceria material under oxidizing conditions would be expected to render it a good SOFC cathode material candidate. Indeed, the authors demonstrate in a recent publication that thin films of PrxCe1−xO2−δ with x = 0.1 and 0.2 exhibit cathode performance, with respect to oxygen exchange kinetics, comparable to perovskites such as (La,Sr)(Co,Fe)O3, well known in the SOFC literature for superior performance at reduced temperatures.Reference Chen, Bishop and Tuller10
Ionic transference number of PrxCe1−xO2−δ at 700 °C as a function of log  for designated values of x.

Turning briefly to the low temperature and high pO2 region of conductivity in undoped ceria, and assuming that in this region, background acceptor impurities lead to ionic conduction,  was extracted and is much larger than that for Pr or other acceptor-doped ceria. However, an alternative explanation for the high activation energy obtained in the high pO2 σ plateau region of undoped ceria has been proposed.Reference Panhans and Blumenthal26, Reference Xiong, Kishimoto, Yamaji, Yoshinaga, Horita, Brito and Yokokawa27 These authors suggest that intrinsic electron–hole generation may be the source of this pO2-independent conductivity. In this scenario, the activation energy corresponding to the slope in Fig. 3 for undoped ceria (E a = 1.43 eV) would be given by the following equation.
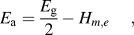
where  is the energy gap between the Ce 4f and O 2p levels, and assuming electron mobility is much greater than hole mobility as found in Ref. Reference Panhans and Blumenthal26. By this method,
 is significantly less than that derived in previous studies (2.6–3.2 eV).Reference Panhans and Blumenthal26, Reference Xiong, Kishimoto, Yamaji, Yoshinaga, Horita, Brito and Yokokawa27 However, using this value to calculate intrinsic electron conductivity (using transport parameters in Table II and a density of states equal to the concentration of Ce),Reference Tuller and Nowick3 one obtains an intrinsic conductivity of electrons at 700 °C equal to 2 × 10⁻⁵ S/cm, similar to that found in the high pO2 region of Fig. 8 (7 × 10⁻⁵ S/cm).
B. Defect generation and nonstoichiometry
While acceptor-doped ceria exhibits the highest oxide ion conductivities for fluorite-structured oxides, it exhibits limited application in SOFCs due to its tendency to reduce under anodic fuel cell conditions, resulting in the generation of electronic carriers accompanied by partial short circuiting of the cell. According to Eq. (1), the reduction enthalpy,  , is the key parameter, which determines how readily ceria will reduce for a given temperature and
 . It is therefore of interest to understand how
 will depend on the type and concentration of acceptor dopants.
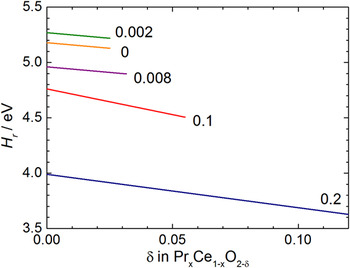
Examination of Fig. 10 and Table II shows that  tends to decrease from values above 5 eV at small x to 4.53 at x = 0.1 and finally down to 3.99 eV at x = 0.2. This demonstrates that increasing substitution of Pr3+ for Ce4+ combined with increasing levels of oxygen vacancies reduces the energy necessary to generate additional oxygen vacancies and Ce3+ ions. Accompanying the formation of oxygen vacancies is a chemical expansion arising primarily from the size difference of 3+ and 4+ valent cations, which, as the name implies, expands the lattice stretching bonds and likely plays a key role in reducing the binding energy of oxygen in the lattice.Reference Marrocchelli, Bishop, Tuller and Yildiz12, Reference Bishop, Tuller, Kuru and Yildiz13 Indeed, it has previously been observed that the elastic modulus, related to bond strength, decreases as the ceria lattice undergoes chemical expansion.Reference Duncan, Wang, Bishop, Ebrahimi and Wachsman31 This is also consistent with the dependence of
 on δ for a given value of x in PrxCe1−xO2−δ as reflected by Eq. (9) and shown in Fig. 12.
Plot of ceria reduction enthalpy Hr as a function of oxygen nonstoichiometry for different levels of x, in accordance with Eq. (9). The range of plotted δ corresponds to the approximate range of δ in the conductivity measurements.

Next, we consider  , a measure of how far below the conduction band edge the Pr energy levels lie.
 decreases from ∼1.63 eV for very small x down to 1.43 eV for large x. Increasing levels of electronic conductivity at high
 with increasing x is attributed, in this study, to the broadening of the Pr-derived impurity band. This would be consistent with a decrease in energy between the top of the Pr-derived impurity band and the bottom of the Ce 4f conduction band. A second contributor to this decrease in
 could come from the fact that the band gap energy is correlated with bond strength, and according to the above discussion, increasing Pr could contribute to a reduced bond strength from chemical expansion. These suggested hypotheses need to be confirmed by further experimental and/or simulation studies.
VI. SUMMARY AND CONCLUSIONS
The thermodynamic transport and defect equilibria parameters of PrxCe1−xO2−δ as a function of x, from 0 to 0.2, were explored in this work. Trends with increasing x were observed, particularly in reduction enthalpies,  and
 , consistent with a decrease in bond energy, potentially arising from chemical expansion, upon substitution of Ce4+ with Pr3+ and a widening of the Pr impurity band, respectively. PrxCe1−xO2−δ was found to exhibit high ionic conductivities, only somewhat lower than those of Gd- and Sm-doped ceria. The peak in ionic conductivity occurred at somewhat lower substitution levels (e.g., x = 0.1 for Pr versus x = 0.2 for Gd and Sm) consistent with lattice distortions induced by the larger Pr3+ ion. The widening of the Pr levels into bands for x ≥ 0.1 also results in mixed ionic electronic conductivity under typical SOFC cathode conditions. This creates options for utilizing acceptor-doped ceria not only as a solid electrolyte but also as a complementary cathode when appropriately doped.
ACKNOWLEDGMENTS
This research was funded by the Division of Materials Research, National Science Foundation under the Material World Network (DMR-0908627) in collaboration with Prof. Ralf Moos, Universität Bayreuth. S.R.B. recognizes partial support from I2CNER, supported by the World Premier International Research Center Initiative, MEXT, Japan. H.L.T. thanks I2CNER for hosting his visit during the time this manuscript was prepared. The authors wish to thank the reviewer for identifying potential intrinsic electronic conduction for undoped ceria in high pO2.