Introduction
Silicates of hexavalent uranium are readily formed in the oxidation areas of primary uranium deposits and during the processing and storage of spent nuclear fuel and radioactive waste. Experiments modelling the latter processes have demonstrated (Wronkiewicz et al., Reference Wronkiewicz, Bates, Wolf and Buck1996) that uranyl silicates, e.g. uranophane Ca[(UO2)2(SiO3OH)2](H2O)5, boltwoodite, (K,Na)[(UO2)(SiO3OH)](H2O)1.5, and weeksite, K2[(UO2)2(Si5O13)](H2O)4 dominate upon crystallization of modified underground waters (Finch et al., Reference Finch, Buck, Finn and Bates1999) or upon oxidation of actinide-bearing borosilicate waste glass (Burns et al., Reference Burns, Olson, Finch and Hanchar2000), as well as among products of interaction between simulated nuclear wastes and crystalline silicate rocks (Oji et al., Reference Oji, Martin, Stallings and Duff2006). Uranyl silicates are known to incorporate radionuclides into their crystal structures (Burns et al., Reference Burns, Ewing and Miller1997) and retard their migration from the storage site (Chen et al., Reference Chen, Burns and Ewing2000). Therefore, studies of uranyl silicates, elucidating the structural origins of nuclide incorporation and their physical properties, are of essential importance. Understanding their structural peculiarities and trends is believed to provide clues to the long-term effectiveness of the geological storage of radioactive wastes (Jackson and Burns, Reference Jackson and Burns2000). While not numerous, uranyl silicates exhibit wide structural diversity due to the ability of the uranyl and silicate tetrahedra to condense by sharing edges and vertices, respectively (Nazarchuk et al., Reference Nazarchuk, Siidra, Charkin and Tagirova2023a). This commonly leads to the formation of microporous frameworks, as well as nanotubular architectures (Nazarchuk et al., Reference Nazarchuk, Siidra, Charkin and Tagirova2023b).
Weeksite was first discovered by W.F. Outerbridge at the Thomas Range deposit, Juab County, Utah, in 1960 (Outerbridge et al., Reference Outerbridge, Staatz, Meyrowitz and Pommer1960). The crystal structure of weeksite had been refined in various space groups and unit cells. It was reported initially as orthorhombic and several space groups were suggested: Cmmb (Jackson and Burns, Reference Jackson and Burns2000), C2mm or C222 (Babo and Albrecht-Schmitt, Reference Babo and Albrecht-Schmitt2013), and Cmmm (Plesko et al., Reference Plesko, Scheetz and White1992; Baturin and Sidorenko, Reference Baturin and Sidorenko1985). Finally, Fejfarová et al. (Reference Fejfarová, Plášil, Yang, Čejka, Dušek, Downs, Barkley and Škoda2012) reported a solution in monoclinic symmetry, C2/m, a = 14.1957(4), b = 14.2291(5), c = 9.6305(3) Å, and β = 111.578(3)°, which involves twinning of the monoclinic structure by reticular merohedry and simulates orthorhombic lattice. We have observed that the twinning model reported in the text of the paper by Fejfarová et al. (Reference Fejfarová, Plášil, Yang, Čejka, Dušek, Downs, Barkley and Škoda2012) is incorrect. The correct model (reticular twin, diffraction type II; Petříček et al., Reference Petříček, Dušek and Plášil2016) involves a two-fold axis operation (or mirror, as an alternative co-set) in (101), which leads to an orthorhombic lattice of four-times larger volume of the unit-cell (a ≈ 14.22 Å, b ≈ 14.26 Å, c ≈ 35.95 Å, β = 90.02° and V = 4×1822 Å3). Examples of how the different twin ratios affect the single-crystal X-ray diffraction pattern are given in Supplementary material (Fig. S1). Diffraction patterns of the twin crystal were calculated using the Jana2020 program (Petříček et al., Reference Petříček, Dušek, Plášil and Palatinus2023).
Crystals and SEM images, respectively, for (a, b) weeksite and the (c, d) K-Wks, (e, f) Rb-Wks and (g, h) Cs-Wks.

Figure 1 Long description
The image A shows crystals of weeksite with a scale of 300 micrometres. The image B shows a scanning electron microscope image of weeksite with a scale of 200 micrometres. The image C shows K-Wks crystals with a scale of 200 micrometres. The image D shows a scanning electron microscope image of K-Wks with a scale of 10 micrometres. The image E shows Rb-Wks crystals with a scale of 300 micrometres. The image F shows a scanning electron microscope image of Rb-Wks with a scale of 10 micrometres. The image G shows Cs-Wks crystals with a scale of 300 micrometres. The image H shows a scanning electron microscope image of Cs-Wkswith a scale of 10 micrometres.
The crystal structure of weeksite can be described as a microporous zeolite-like framework containing channels with an effective size of up to 5.00×0.80 and 6.21×6.21 Å in the ab plane and 6.98×0.98 Å in the bc plane. The framework is relatively stable against variations of the alkali cation. Based on the chemical analysis of weeksite, Outerbridge et al. (Reference Outerbridge, Staatz, Meyrowitz and Pommer1960) suggested that the alkali sites in the channels are partially occupied by Na, Ca and Ba. Yeremenko et al. (Reference Yeremenko, Il’menov and Azimi1977) reported the presence of Na, Mg, Ba and Sr in the samples from Afghanistan, Jackson and Burns (Reference Jackson and Burns2000) found Ba and Ca, while Fejfarová et al. (Reference Fejfarová, Plášil, Yang, Čejka, Dušek, Downs, Barkley and Škoda2012) found Ba, Na and Ca. This indicates that the interiors of the uranyl-silicate framework not only accommodate essential amounts of water and alkali cations but are wide enough to provide their easy migration. One can suggest, therefore, that this structure would also permit an easy exchange of one alkali cation by another, which is of particular importance considering the essential presence of high-yield radioactive caesium isotopes, particularly 134Cs, 137Cs and long-lived 135Cs (Cook et al. Reference Cook, Rettger and Sewalk1964; Zhu et al. Reference Zhu, Hou and Qiao2021) of which the two former pose immediate, and the latter, delayed threat. A radioactive isotope of rubidium, 88Rb, is also abundantly formed upon fission (Yanzhong and Jianzhu, Reference Yanzhong and Jianzhu2002) but poses no actual threat as it is very short-lived with T1/2 = 17 min; of more essential concern is the very long-living, though less active, 87Rb. As noted above, the uranyl silicates formed in situ are likely to affect the release of radioactive caesium isotopes; therefore, studies on the ability of weeksite to incorporate alkali cations, particularly Cs+, are important.
Depending on the conditions, uranyl silicates can reversibly hydrate and dehydrate (Chernikov et al., Reference Chernikov, Sidorenko and Valueva1977, Reference Chernikov, Sidorenko and Valuyeva1978). For minerals, humidity and temperature can affect their optical properties (Baturin and Sidorenko, Reference Baturin and Sidorenko1985). According to DTA results, weeksite exhibits several endothermal effects accompanied by mass loss of up to 5.5 wt.% (Frost et al., Reference Frost, Čejka, Weier, Martens and Kloprogge2006). The first and most pronounced effect takes place at 100°C (Baturin and Sidorenko, Reference Baturin and Sidorenko1985; Fejfarová et al., Reference Fejfarová, Plášil, Yang, Čejka, Dušek, Downs, Barkley and Škoda2012), or at 130°C (Chernorukov et al., Reference Chernorukov, Knyazev and Sazonov2007), while two weaker ones are at 350 and 700°C (Fejfarová et al., Reference Fejfarová, Plášil, Yang, Čejka, Dušek, Downs, Barkley and Škoda2012).
In the current paper, we report the synthesis, polythermal single-crystal and powder X-ray studies of weeksite and its K-, Rb-, and Cs-analogues. Hereafter, the latter three are designated as K-Wks, Rb-Wks and Cs-Wks. Ion-exchange properties are reported for Rb-Wks to show the zeolitic nature of the weeksite uranyl silicate framework.
Experimental
Samples and occurrence
The crystals of weeksite (Fig. 1a,b) were collected at the Anderson mine, Yavapai County, Arizona, USA. In the samples selected, weeksite associates mainly with carnotite, quartz, gypsum and celestine.
Synthesis
The crystals of K-Wks, Rb-Wks, and Cs-Wks (Fig. 1c–h) were produced in a high-temperature experiment, using methods similar to those described in our previous works (Nazarchuk et al., Reference Nazarchuk, Siidra, Charkin and Tagirova2023a, Reference Nazarchuk, Siidra, Charkin and Tagirova2023b). Mixtures of U3O8 (obtained by thermal decomposition of uranyl acetate at 750°C), SiO2, Bi2O3, BiF3, and MCl (preheated at 150°C for 2–3 hrs; M = K, Rb, Cs) in a 2:1:1:20 molar ratio were ground, loaded in thick-walled (1.5 mm) 150-mm silica tube, evacuated, sealed and heated to 875°C in 24 hrs, annealed for 60 hrs, and cooled to 650°C in 60 hrs. To prevent pressure buildup due to the expected formation of volatile products, the tubes were positioned in a vertical furnace so that their upper (cold) ends protruded slightly out. The tube walls were essentially attacked by the reaction mixtures, yet the tubes did not lose integrity, and no sublimates and/or water drops were found in the cold ends. Upon opening, solidified melts were found containing dark particles and solid metal drops; numerous druses of yellow needle-like crystals were found on the tube walls just above the surface of the charge. Subsequent studies have established the formation of synthetic weeksite analogues with all three alkali cations.
Initially, we used Bi2O3 and BiF3 instead of PbO and HF to check which reactive fluorides, besides PbF2, could be employed to activate uranium and silicon oxides towards reaction. At the synthesis temperatures, Bi2O3 is also reactive towards both silicon and uranium oxides. Hence the formation of some new multinary silicates could be expected. Yet, just like in the previous cases, only alkali uranyl silicates were produced, which are probably easiest to form due to the large excess of alkali compounds in the reaction mixtures.
Single-crystal X-ray studies
Single-crystal X-ray data of weeksite and K-Wks, Rb-Wks, and Cs-Wks (Table 1) were collected using a Rigaku XtaLAB Synergy-S diffractometer equipped with a PhotonJet-S detector operating with MoKα radiation at 50 kV and 1 mA. Corresponding crystals were chosen for which more than a hemisphere of data was collected with a frame width of 0.5° in ω, and 5 s spent counting for each frame. The data were integrated and corrected for absorption, applying a multi-scan type (ABSCOR3) model using the Rigaku Oxford Diffraction program CrysAlis Pro.
Crystallographic data and refinement parameters for weeksite and its synthetic analogues

Table 1 Long description
The table presents crystallographic data and refinement parameters for weeksite and its synthetic analogues, focussing on potassium, rubidium, and caesium variants. All samples share a monoclinic crystal system and were analysed at a temperature of 293 Kelvin using MoKα radiation. The caesium analogue exhibits the highest calculated density and volume. The number of reflections collected and observed, as well as the least-square parameters, differ slightly among the samples, with the caesium analogue generally showing higher values. The goodness-of-fit values are close across all samples
A polythermal single-crystal experiment was conducted only for Rb-Wks, as the crystals of K-Wks and Cs-Wks were essentially smaller and would require too much time for the corresponding full-scale studies. The Rb-Wks crystal was used in the temperature range of 25–625°C using a «Hot Air Gas Blowers» heating system. The starting atomic coordinates of uranium and silicon atoms were taken from Fejfarová et al. (Reference Fejfarová, Plášil, Yang, Čejka, Dušek, Downs, Barkley and Škoda2012). The structures were successfully refined using the SHELX software package (Sheldrick, Reference Sheldrick2015). Atom coordinates, thermal displacement parameters, bond lengths and calculated bond valence sums are provided in Tables S1–S11 in the supplementary materials; crystallographic data and refinement parameters are summarized in Table 1.
The effect of thermal motion on the bond-length values from single-crystal X-ray diffraction experiments is well-known (Downs, Reference Downs, Hazen and Downs2000). Corrections for all bonds in the compounds studied were calculated by using a formula for the rigid-body motion.
Interestingly, none of the studied crystals were twinned by above-mentioned reticular merohedry; the refined twin-fraction volumes were insignificantly low, respectively.
Chemical composition
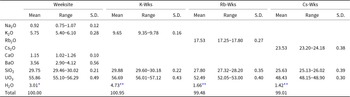
Selected weeksite, K-Wks, Rb-Wks and Cs-Wks crystals were embedded into epoxy resin, polished and coated with carbon film. The chemical analyses of weeksite and its synthetic analogues were carried out with a Hitachi FlexSEM 1000 scanning electron microscope equipped with EDS Xplore Contact 30 detector and Oxford AZtecLive STD system of analysis. Analytical conditions were an accelerating voltage of 15 kV, a beam current of 5 nA and a beam size of 2 μm. The following analytical standards and X-ray lines were used: albite (NaKα), KBr (KKα), Rb2Nb4O11 (RbLα), CsDyP4O12 (CsLα), wollastonite (CaKα), BaSO4 (BaLα), SiO2 (SiKα), UO2 (UMα). The contents of other elements with atomic numbers higher than that of beryllium were below detection limits. Water content was calculated based on (1) the deficiency of the total for weeksite and (2) structural data for its synthetic analogues. The analytical data are listed in Table 2.
Chemical composition (in wt.%) of weeksite and its synthetic analogues (mean of 5 analyses for each)

Table 2 Long description
The table compares the chemical composition of weeksite and its synthetic analogues. Water content varies, with the potassium analogue having the highest at 4.73%. The total composition percentages are close to 100% for all samples
* By deficiency of the total
** Based upon the crystal structure
The empirical formulas calculated on the basis of 17 O atoms per formula unit and respective quantity of H2O groups based on the deficiency of the total or upon the crystal structure, are as follows: K1.22Na0.30Ba0.23Ca0.21U1.96Si4.96O17(H2O)2.61 for weeksite; K2.06U1.99Si5.00O17(H2O)2.64 for K-Wks; Rb2.03U1.99Si5.01O17(H2O)1.00 for Rb-Wks and Cs1.97U1.99Si5.02O17(H2O)0.93 for Cs-Wks.
Powder X-ray analysis
The powder X-ray diffraction data of samples under study (Fig. S2) were collected in air on a Rigaku Ultima X-ray diffractometer (CuKα radiation). The samples were prepared from heptane suspensions. The speed of the experiment is 2°/min. Unit-cell parameters were refined by least-square methods.
High-temperature powder X-ray diffraction study
The thermal behaviour of compounds was studied in air on the same powder X-ray diffractometer (CuKα radiation) with a high-temperature camera Rigaku HTA 1600. The samples were prepared from heptane suspension on a Pt-Rh plate. The temperature step was 20°C in the range of 25–1000°C. At each temperature, the sample was equilibrated for 15 minutes. Unit-cell parameters at different temperatures were refined by least-squares fits. The main coefficients of the thermal expansion tensor were determined using a linear approximation of temperature dependences by the ThetaToTensor program (Bubnova et al., Reference Bubnova, Firsova and Filatov2013).
Infrared spectroscopy
The infrared (IR) spectra of weeksite and its synthetic analogues were obtained using a standard KBr technique on an ALPHA FTIR spectrometer (Bruker Optics) with a resolution of 4 cm–1 and 10 scans.
The infrared spectra of the mineral, and K-Wks and Cs-Wks (Fig. S3) were studied in the range 4000–400 cm–1 and analysed in comparison with the infrared spectra of synthetic weeksite already described by Plesko et al. (Reference Plesko, Scheetz and White1992) and Frost et al. (Reference Frost, Čejka, Weier, Martens and Kloprogge2006). The absorption spectra that we have obtained are highly analogous to those presented earlier (Fig. S3).
In the IR spectra bands in the range 870–930 cm–1 can be assigned to the antisymmetric stretching mode ν3 (UO2)2+ (Čejka, Reference Čejka, Burns and Finch1999). According to Frost et al. (Reference Frost, Čejka, Weier, Martens and Kloprogge2006), ν1 (SiO4)4–, ν2 (SiO4)4–, ν4 (SiO4)4- vibrations which describe symmetrical vibrations of stretching and bending of SiO4 groups are observed in the range 400–900 cm–1. Bands of asymmetric stretching vibrations of SiO4 groups are observed in the range of 1000–1200 cm–1 (ν3 (SiO4)4-) (Plesko et al., Reference Plesko, Scheetz and White1992).
Bending vibrations δH2O are observed in the range 1400–1600 cm–1, HOH bending vibrations lie in the range 1600–1750 cm–1, in the IR spectra described by Čejka (Reference Čejka, Burns and Finch1999) (Fig. S3) additional bands of water molecules are also observed in the range 1350–1400 cm–1. The region of O–H-stretching modes oscillations covers the range 3000–3500 cm–1. A wide band in this range may be due to the disordered position of water molecules.
Ion exchange properties of the Rb-analogue of weeksite
Ion exchange experiments were performed using a common hydrothermal technique. The crystals of the rubidium compound were placed in a Teflon-lined autoclave containing 5 ml of 2 М solution of corresponding alkali chloride; the syntheses were conducted at 180°C over 7 days. No exchange was observed at 130°C, while above 220°C, the crystals dissolve. The successful exchange was observed for solutions of KCl and CsCl but not of NaCl; the reaction products were studied by both EDX and single-crystal X-ray diffraction.
Results
Crystal structure of A2[(UO2)2(Si5O13)](H2O)n (A = K, Rb, Cs)
In the crystal structure of A 2[(UO2)2(Si5O13)](H2O)n (A = K, Rb, Cs), the uranium atom forms a typical uranyl cation (<U–OUr> = 1.810, 1.800, 1.793 and 1.814 Å for weeksite, K-Wks, Rb-Wks, Cs-Wks, respectively) coordinated, in the equatorial plane, by five oxygen atoms (<U–Oeq> = 2.372, 2.366, 2.391 and 2.378 Å). Three symmetrically independent silicon atoms are tetrahedrally coordinated with <Si–O> = 1.610, 1.612, 1.612 and 1.614 Å, for weeksite, K-Wks, Rb-Wks and Cs-Wks, respectively. In the structure of A 2[(UO2)2(Si5O13)](H2O)n (A = K, Rb, Cs) (Fig. 2a) UO7 polyhedra share edges to form chains rather common for uranium minerals, e.g. sklodowskite, Mg[(UO2)2(SiO3OH)2](H2O)6 (Plášil, Reference Plášil2018), kasolite, Pb[(UO2)(SiO4)](H2O)2 (Fejfarová et al., Reference Fejfarová, Dušek, Plášil, Čejka, Sejkora and Škoda2013), and haiweeite, Ca[(UO2)2Si5O12(OH)2](H2O)6 (Plášil et al, Reference Plášil, Fejfarová, Čejka, Dušek, Škoda and Sejkora2013).
‘Intra-channel’ sites in the structure of the Rb, Cs and K synthetic weeksite analogues.

Figure 2 Long description
The image presents three diagrams illustrating the structures of Rb-Wks, Cs-Wks and K-Wks. Each diagram is divided into two sections. The top section of each diagram shows a side view of the crystal structure with labelled axes a, b and c. The bottom section provides a top view of the crystal lattice. In each structure, various atoms are represented by coloured spheres: A1A, A1B, A1C, A2A, A2B, A2C, A3 and OW. The Rb-Wks, Cs-Wks and K-Wks diagrams display similar arrangements with differences in atomic positioning and spacing, reflecting the distinct properties of each analogue. The diagrams are labelled accordingly to indicate the specific weeksite type and the orientation of the crystal axes.
The structure of the uranyl silicate framework in all discussed structures is nearly insensitive to the nature of the alkali cation; the differences concern mainly the distribution of the cations and water molecules within the channels. Overall, there are three internal sites, A1, A2 and A3 (Table 3). The respective site occupancies in all studies natural and synthetic compounds were initially refined unrestricted, and fixed at the final stages to provide overall electroneutrality. Note that some of these sites could be refined only isotropically. Unfortunately, the amount of produced crystals was too small for the TGA studies to confirm independently the water content calculated from structural refinements. The positions within the channels are strongly disordered and the amount of water can vary within certain limits.
A-sites atomic coordinates and occupancies (Occ.) in the weeksite and synthetic analogues studied

Table 3 Long description
The table presents atomic coordinates and occupancies for cesium, rubidium, potassium, and oxygen at various sites in weeksite and synthetic analogues. See text.
In the structure of Rb-Wks the A1 site (Fig. 2) is split into two ‘subsites’, Rb1A (site occupancy factor = 86%) and Rb1B (s.o.f. = 14%) at separation of 2.46(2) Å. The A2 site is ‘tripled’ into Rb2A (s.o.f. = 56%), Rb2B (s.o.f. = 40%), and Rb2C (s.o.f. = 2%). The A3 is fully and exclusively occupied by water molecules. The highest residual electron density peak is 1.80 e/Å3 (1.16 Å from U1). Hence, the structural study of Rb-Wks results in the Rb2[(UO2)2(Si5O13)](H2O)1.00 composition. The coordinates of the A sites were used as starting values for the other refinements described below.
In the structure of Cs-Wks, contrary to the previous structure, the A1 site is ‘tripled’ into Cs1A (s.o.f. = 90%), Cs1B (s.o.f. = 8%), and Cs1C (s.o.f. = 2%). The separations between these vary between 0.78(4) and 2.78(2) Å. The A2 is also ‘tripled’ into Cs2A (s.o.f. = 43.5%), Cs2B (s.o.f. = 43.5%), and Cs2C (s.o.f. = 3%). The A3 is occupied by OW (s.o.f. = 93 %) and Cs3 (s.o.f. = 7 %). The highest residual electron density peak of is 2.18 e/Å3, also very close (1.13 Å) to U1. The calculated formula is therefore Cs2[(UO2)2(Si5O13)](H2O)0.93. A smaller amount of water can be explained by larger volume of Cs+ compared to Rb+, and consequently less free space is left for the water molecules.
Due to the essentially smaller size of K+ with respect to Rb+ and Cs+, there are greater differences in the fillings of channels. The А1 site, akin to Rb-Wks, is split into A1A and A1B both of which are occupied by a mix of potassium cations and water molecules: A1A = (K1)0.82(OW)0.18 and A1B = (K1)0.18(OW)0.82. This agrees with the separations of A1A – A1B = 2.645(7) Å and A1A – A1B = 2.98(1) Å when considering these as K–OW bonds. The A2 is tripled into A2A (s.o.f. = 44% K+), A2B (K2)0.15(OW2)0.85, and A2C (s.o.f. = 10% K+). Note the mixed potassium – water occupancy of the A2B whereas A2A and A2C are partially occupied by potassium cations only. The A3 is also occupied by a mix of OW3 (s.o.f. = 79 %) and K3 (s.o.f. = 21 %). A residual peak of 2.62 e/Å3 at 2.46 Å from A3 indicates an even more complex disorder in the potassium compound. Yet, attempts to consider the maximum of electron density led to instability of the refinement. Hence, the calculated formula for K-Wks indicated a larger amount of water: K2[(UO2)2(Si5O13)](H2O)2.64. We underline that, these data should be considered as tentative and need further verification. Nevertheless, water-content calculations show that the number of molecules pfu drops with increasing alkali radius (for K-Wks, Rb-Wks and Cs-Wks, respectively). This is not surprising, considering that the larger the cation, the less free space is left for the water molecules.
The distribution of K+ cations and H2O molecules in the natural mineral is rather similar to that described just above. Again, due to the imprecise determination of water content and, in addition, the mixed-cation (Table 1) filling of the respective sites, the estimation of water content based on single-crystal refinement is tentative at best. The zeolitic nature of the weeksite structure does not permit unambiguously attributing a given site within the channel to a set of cations and water molecules. All sites were refined as occupied by potassium cations and/or H2O groups. Given this approximation, the formula can be written as K2[(UO2)2(Si5O13)](H2O)2.61, very close to the value for the synthetic analogue.
The bond valence sums, calculated using the parameters from Gagné and Hawthorne (Reference Gagné and Hawthorne2015), correlate well to the formal valences of the atoms (Table S5, S8, S11). Bond valence analysis was not performed for the weeksite mineral due to the several complex isomorphic substitutions (Table 2). A slight overbonding for the silicon atoms is commonly observed among the structures of uranyl silicates (Nazarchuk et al., Reference Nazarchuk, Siidra, Charkin and Tagirova2022, Reference Nazarchuk, Siidra, Charkin and Tagirova2023a, Reference Nazarchuk, Siidra, Charkin and Tagirova2023b). Site occupancies were taken into consideration in the calculations.
The SiO4 tetrahedra share vertices to form [Si5O13]6– layers (Fig. 3a) comprised of six-membered [Si6O18]12– rings linked by Si2O4 tetrahedra (Fig. 3d). The chains of uranium polyhedra and [Si5O13]6– layers form a microporous framework (Fig. 3b,c). In the ab and bc planes, there are relatively wide channels, which host the alkali cations and water molecules. In ab, the size of the channels is 6.98×0.98 Å2; in bc, their size is 5.00×0.80 and 6.20×6.20 Å2. The increase of the ionic radius of the alkali cation results in expected changes in the unit-cell parameters (Fig. 4a). Both a and b increase while c and β decrease; the change in unit-cell volume is nearly linear.
Crystal structure of A 2[(UO2)2(Si5O13)](H2O)n (A = K, Rb, Cs). (a) The connection of uranium and silicon polyhedra. (b) Projection of A 2[(UO2)2(Si5O13)](H2O)n on the ab plane and (c) the bc plane. (d) The  ${}_{\infty}^{2}{[\text{Si}_5}{{\text{O}}_{{\text{13}}}}]^{6 - }$ layers. Uranium polyhedra are shown in brown and silicon in blue. The 6-membered rings [Si6O18]12– are highlighted in red.

Figure 3 Long description
The image consists of four diagrams labelled a, b, c and d. Diagram a shows the connection of uranium and silicon polyhedra. Diagram b presents a projection of the structure on the a-b plane. Diagram c shows a projection on the b-c plane. Diagram d illustrates the layers with six-membered rings.
Dependence graph of (a) unit-cell parameters and (b) Si–O–Si angles on the A cation radius. (c) The 6-membered rings [Si6O18]12– and 10-members rings [(UO2)2(Si8O32)]28– in the structure of A 2[(UO2)2(Si5O13)](H2O)n. The 6-membered rings [Si6O18]12– are highlighted in red.

Figure 4 Long description
The image consists of three parts. The first part (a) shows graphs of unit-cell parameters (a, b, c, beta, V) plotted against cation radius (r, in angstroms). Data points are marked for different cations: K, Rb and Cs, with distinctions for Fejfarova et al., 2013, weeksite mineral and synthetic weeksite. The second part (b) displays graphs of Si–O–Si angles (Si3–O6–Si3, Si2–O5–Si3, Si1–O1–Si3, Si3–O7–Si2) also plotted against cation radius (r, in angstroms), with similar distinctions for data points. The third part (c) is a structural diagram showing six-membered and ten-membered rings composed of SiO4 and UO7 units. The diagram highlights two channel sizes: 5.0 by 0.8 angstroms and 6.2 by 6.2 angstroms, with the six-membered rings highlighted in red. The structure is composed of interconnected tetrahedra and polyhedra, forming a microporous framework.
The smaller channels in these structures are formed by Si1O4 and Si3O4 tetrahedra, which share vertices to form six-membered [Si6O18]12– rings. As a result, flexible Si3–O6–Si3 and Si1–O1–Si3 ‘hinges’ are formed. The Si3–O6–Si3 angle increases linearly while Si1–O1–Si3 decreases when passing from M = K to M = Cs. (Fig. 4b). The larger channels are formed from Si1O4, Si2O4, and Si3O4 tetrahedra (Fig. 4c). As a result, four hinges are formed: Si3–O6–Si3, Si3–O7–Si2, Si2–O5–Si3 and Si1–O1–Si3. With increasing alkali radius, the Si3–O7–Si2 and Si2–O5–Si3 angles increase while Si1–O1–Si3 decreases.
Thermal expansion of weeksite and A 2[(UO2)2(Si5O13)](H2O)n
Powder X-ray thermal expansion
On the PXRD pattern of weeksite (Fig. 5a), the diffraction maxima shift towards higher angles at the initial heating stages (40–200°C). This can be explained by gradual dehydration. Overall, the anhydrous compound is stable until 860±10°C, but some additional reflections start to appear above 720±10°C (Fig. 5a) which can be attributed to K2U4O13 and SiO2. A similar pattern is observed also for the synthetic potassium compound, but the U-containing decomposition product is K2U7O22. The difference can be tentatively explained by the presence of other cations in the natural sample. In contrast, the Rb- and Cs-analogues are stable at least until 1000±10°C (Fig. 5b). As the crystal structures of the compounds are topologically identical with the only difference in the nature (size) of the alkali cations, type of their disorder and water content, the difference in thermal behaviour can be attributed to the same factors.
Powder X-ray diffraction pattern of (a) weeksite and the synthetic analogues of (b) Rb-Wks, (c) K-Wks and (d) Cs-Wks. Reflections of K2U4O13, K2U7O22, SiO2, and the initial compound are highlighted in cyan, blue, green and red, respectively.

Figure 5 Long description
The image shows four powder X-ray diffraction patterns labelled a, b, c and d. Each pattern displays diffraction peaks with temperature variations from 40 to 1000 degrees . In image a, the pattern is for weeksite, with diffraction maxima shifting towards higher angles at initial heating stages. Additional reflections appear above 720 degrees Celsius. Image b shows the pattern for the synthetic rubidium analogue, stable until 1000 degrees Celsius. Image c represents the synthetic potassium analogue, with a similar pattern to weeksite but with different decomposition products. Image d displays the synthetic cesium analogue, also stable until 1000 degrees Celsius. Peaks are marked with different symbols for various compounds, including K2U4O13, K2U7O22, SiO2 and the initial compound, highlighted in different colours.
The graphs of thermal dependences of unit-cell parameters can be divided into two regions: 20–500 and 500–800°C for weeksite and 20–150 and 150–800°C (Fig. 6) for the synthetic compounds; overall, the behaviour of the mineral and its analogues is different. The slope of the dependence of b and V for the mineral is flatter, and the dehydration temperature can be estimated as 150–400°C. Above that, the b of the mineral increases sharply in contrast to the synthetic compounds. Similar differences are also observed for a, which decreases slightly for the mineral and Rb-Wks but drops for Cs-Wks.
Temperature dependences of the unit-cell parameters and volume for (a) weeksite and (b) K-Wks, (c) Rb-Wks and (d) Cs-Wks.

Figure 6 Long description
The image consists of four graphs, each representing the temperature dependences of unit-cell parameters for weeksite and its synthetic analogues: K-Wks, Rb-Wks and Cs-Wks. Each graph displays the parameters a, b, c in angstroms, beta in degrees and V in angstroms cubed, plotted against temperature in degrees Celsius. The x-axis for all graphs is labelled 'Temperature, degrees C', ranging from 0 to 800. The y-axis for each parameter is labelled accordingly. .See text.
The thermal expansion of the mineral and its analogues is strongly anisotropic (Fig. 7). The structure of the mineral gradually changes the character of its expansion from negative to positive. Between 20 and 500°C thermal expansion of weeksite is negative or almost zero in all directions, after 500°C, only in the monoclinic plane. The negative thermal expansion decreases from 20 to 500°C and after 500°C becomes positive in ab and bc planes.
Pole figures of thermal expansion coefficients for weeksite in the temperature ranges 20–500 and 500–800°C and for K-Wks, Rb-Wks, Cs-Wks in the temperature range 20–150 and 150–800°C. The red line highlights negative thermal expansion.

Figure 7 Long description
The image shows pole figures of thermal expansion coefficients for weeksite and its analogues (K-Wks, Rb-Wks, Cs-Wks) across different temperature ranges. See text for description.
Between 20 and 150°C, the structure of K-Wks, Rb-Wks and Cs-Wks exhibit similar negative thermal expansion in the ac and ab planes (Fig. 7) as weeksite, due to dehydration processes. Between 120°C and decomposition points, the behaviour of the synthetic analogues is slightly different. The frameworks are sufficiently stable to retain their integrity after dehydration and their expansion can be estimated.
After the dehydration process, the coefficients of thermal expansion for all compounds become similar, but anisotropy is distinct in each case. The thermal expansion of K-Wks (α11 = –1.58, α22 = 6.39, α33 = 5.19 and αV = 10.0 × 10⁻⁶°C–1) becomes similar to the thermal expansion of weeksite (α11 = –7.1, α22 = 11.5, α33 = –0.33 and αV = 4.1 × 10⁻⁶°C–1). The main difference between the thermal behaviour of weeksite and K-Wks is the speed and smoothness of the dehydration process. After 150°C the thermal expansion of Rb-Wks (α11 = 4.21, α22 = 1.10, α33 = 1.63 and αV = 6.94 × 10⁻⁶°C–1) and Cs-Wks (α11 = 2.52, α22 = 0.94, α33 = 2.75 and αV = 6.21 × 10⁻⁶°C–1) is very close. In general, the volumetric thermal expansion of all synthesized analogues and weeksite has similar values, the difference can be explained by the nature of the alkali cations.
Single crystal X-ray thermal expansion
The single crystal of Rb2[(UO2)2(Si5O13)](H2O) was found to be stable until 625±25°C. Below 525°C, its structure can be refined to acceptable results (see the cif data in the Supplementary material). Between 525 and 625°C, the crystal gradually decays, so cell parameters can only be estimated. In the 25–525°C range, the reciprocal space contains a regular set of diffraction maxima. Additional reflections start to appear between 525 and 625°C, at 625°C, several nearly spherical arrays are observed, indicating decomposition. At higher temperatures, all maxima disappear.
The thermal evolution of cell parameters is strongly anisotropic (Fig. 8a). To confirm the reproducibility of the data, the experiment was conducted twice. Between 25 and 200°C, the a, b, β, and V decrease, while c increases. The largest changes are observed for b and can be approximated using a second-term polynomial. Above 200°C, all parameters increase linearly with temperature. A dramatic change in the thermal behaviour of Rb-Wks can be explained by framework transformations and water loss below 200°C.
Thermal expansion of the Rb2[(UO2)2(Si5O13)](H2O) structure. (a) The thermal dependences of the cell parameters and (b) variation of the Si3–O6–Si3 angle. (c) Pole figures of thermal expansion coefficients in the temperature ranges 125–525°C (negative expansion are highlighted in red).

Figure 8 Long description
The image consists of three parts. The first part (a) shows graphs of cell parameters a, b, c, beta and V plotted against temperature in degrees Celsius. The second part (b) displays structural diagrams of a material at 50, 125 and 200 degrees Celsius, highlighting changes in bond angles and distances. The third part (c) illustrates pole figures of thermal expansion coefficients for temperature ranges 25 to 150 degrees Celsius and 150 to 625 degrees Celsius, showing different expansion behaviours with red indicating negative expansion.
The calculated values for the main components of the thermal expansion tensor also demonstrate its strongly anisotropic character (Fig. 8c). Between 25 and 150°C, the a 11 and a 22 are negative, a 11, a 33 and a β are nearly constant, while a 22 increases, becoming positive (Fig. 8c). At 150°C, the pattern changes and a 22 and a 33 coefficients become positive until melting. Between 20 and 150°C, the thermal expansion of Rb-Wks exhibits similar trends (α11 = –2.8, α22 = 11.5, α33 = –0.33 and αV = 4.1·10–6°C–1) like K-Wks (α11 = –1.58, α22 = 6.39, α33 = 5.19 and αV = 10.0·10–6°C–1).
The anisotropy of the thermal expansion of Rb-Wks can be explained based on some peculiarities of its crystal structure. The framework can be regarded as a series of uranyl silicate layers linked by the Si3O4 tetrahedra (Fig. 8b). As a result, a Si3–O6–Si3 ‘hinge’ is formed. Upon temperature increase from 25 to 125°C, the Si3–O6–Si3 increases from 150.5(5)° to 153.3(8)°, while the Si3–O6 bond shortens from 1.613(3) to 1.602(3) Å. At 200°C, the pattern is inversed, the Si3–O6–Si3 angle decreases to 151.9(4), while the Si3–O6 separation increases to 1.621(2) Å. Note that the thermal evolution of some bonds remains monotonous at ∼200°C; the linear dependence is not broken for the <U–Oap>, <U–Oeq>, <Si1–O> and <Si2–O> bonds (Fig. 6). In contrast, essential changes are observed for the mean bond lengths in the <Si3–O> tetrahedra and for the Si3–O6 bond and Si3–O6–Si3 angle. In summary, negative thermal expansion persists until the total dehydration at 200°C, after which a ‘normal’ thermal expansion is observed in all directions.
Ion-exchange properties of Rb-Wks
Under hydrothermal processing in CsCl solutions, the crystals of Rb-Wks partially or completely exchange Rb+ with Cs+, depending on the processing protocol (Fig. 9). This is verified by the results of both EDX and single-crystal studies. Substitution of Rb+ for Cs+ enlarges the unit-cell parameters (Table 1). The crystals maintain their integrity and the diffraction data collected gives reasonable results for the structure refinement in the same C2/m space group.
SEM-EDX mapping of A 2[(UO2)2(Si5O13)](H2O)n (A = Rb, Cs). For each crystal (a) is a back-scattered electron image and (b) is the respective element-distribution map for caesium and rubidium.

Figure 9 Long description
The image A shows four back-scattered electron images of Rb-Wks crystals labelled as Rbw-2, Rbw-3, Rbw-1 and Rbw-4. Each crystal is displayed with distinct shapes and textures. The scale bar indicates 250 micrometres. The image B shows element-distribution maps for caesium and rubidium in the same crystals. Rbw-2 and Rbw-4 display a distribution of caesium, while Rbw-1 and Rbw-3 show a distribution of rubidium. The element symbols Cs and Rb are shown in a legend at the bottom right corner.
Substitution of Rb+ by Cs+ affects the uranyl silicate framework via geometry deformations, which can be estimated by the bonds and angles in the polyhedra at the channel walls. Both channels are symmetric, so for the six-membered rings, it is sufficient to consider Si3–O6, Si3–O1, and Si1–O1 bonds, as well as Si3–O6–Si3 and Si3–O1–Si1 angles (Fig. 3c). For the 10-membered rings, we consider Si3–O7, Si2–O7, Si2–O3, U1–O3 and Si3–O6 bonds together with Si3–O7–Si2, Si2–O3–U1 and Si3–O6–Si3 angles. The Si3–O6–Si3 and Si3–O1–Si1 change within ± 0.24°, while Si3–O6, Si3–O1, and Si1–O1, change within ±0.01 Å. The rigidity of U and Si polyhedra is also reflected in larger channels: Si3–O7, Si2–O7, Si2–O3, U1–O3 and Si3–O6 vary within ±0.01 Å. The largest changes are observed for the Si3–O7–Si2, Si2–O3–U1 and Si3–O6–Si3 angles. The Si3–O7–Si2 angle equals 143.3(4)° in the Rb-exchanged compound and 145.9° in the Cs-exchanged sample. Therefore, this angle varies within 2.6°. The Si2–O3–U1 and Si3–O6–Si angles vary within 0.73° and 1.51°. These changes lead to shear deformations caused by the changing size of the alkali cations. It is important to note that no substitution was observed under the same conditions by Na+, K+ or Ag+ regardless that both K- and Na-based synthetic weeksite analogues have been reported. Therefore, it is likely that under mild hydrothermal conditions, which are more or less close to those in SNF storage sites, in situ formed weeksite can behave as a matrix for selective immobilization of radioactive Cs+ cations in the presence of ubiquitous Na+ and K+, despite the closeness of ionic radii ratios: r(K+)/r(Rb+) or r(Rb+)/r(Cs+). Therefore, it is highly interesting to study the ion exchange properties of Na- and K-based synthetic analogues of weeksite; some of these investigations are currently underway.
Concluding remarks
The mineral weeksite is stable in a wide range of conditions. In Nature, it is formed as a product of the relatively mild hydrothermal transformation of the parental rocks. In laboratory conditions, its analogues can be produced via both hydrothermal and solid-state routes. Our results demonstrate that the synthetic analogues of weeksite can be also produced from melts using activated silica tubes and U3O8 as the uranium source.
The crystal structure of the mineral is based on a microporous uranyl silicate framework wherein the channels contain (disordered) alkali cation and water sites. Though the degree of hydration may vary depending on the external conditions, e.g. relative humidity even at room temperature, the silicate framework remains stable upon thermal treatment and ion exchange processes. The exchange capacity is to a certain extent similar to that of zeolites, yet the processes are selective. For instance, Rb+ can be easily substituted by K+ and Cs+, yet no substitution was observed under the same conditions by Na+ or Ag+ even though both K- and Na-based synthetic weeksite analogues have been reported. The mineral’s ability to exchange cations indicates that it can participate in radionuclide migration.
We were able to refine the structures of both the weeksite itself and K-Wks, Rb-Wks, and Cs-Wks. Unfortunately, the distribution of the alkali cations and water molecules in the channels, particularly in the case of potassium, remains obscure. The quality of the crystals, as well as their dehydration under an X-ray beam, affect the data quality. As yet, the synthetic protocols do not permit production of essential amounts of pure compounds for thermal analyses. The shape of crystals is also dependent on the alkali cations. Those of Cs-Wks are mostly platelets. New and helpful data can also be obtained using polythermal single-crystal diffraction of Cs-Wks and K-Wks; attempts to prepare crystals of the required size and quality have yet not been successful.
Supplementary material
The supplementary material for this article can be found at https://doi.org/10.1180/mgm.2025.10149.
Acknowledgements
Technical support by the X-Ray Diffraction (project # 118201839) and Geomodel Resource Centers of Saint-Petersburg State University is gratefully acknowledged.
Financial statement
This work was financially supported by the Russian Science Foundation through the grant 23-27-00153.
Competing interests
The authors declare none.