Introduction
Year-to-year variation in abundance, often termed population variability, is a key feature of the dynamics of populations (Taylor and Woiwod Reference Taylor and Woiwod1980; Connell and Sousa Reference Connell and Sousa1983; Pimm and Redfearn Reference Pimm and Redfearn1988; McArdle et al. Reference McArdle, Gaston and Lawton1990; Grimm and Wissel Reference Grimm and Wissel1997). Population variability is thought to be a species characteristic (Taylor and Woiwod Reference Taylor and Woiwod1980), linked to density-dependent processes (Dochtermann and Peacock Reference Dochtermann and Peacock2013), the likelihood of local extinction (Inchausti and Halley Reference Inchausti and Halley2003; Lamb et al. Reference Lamb, MacKay and Wool2012), and habitat stability or uniformity (Corbineau et al. Reference Corbineau, Rouyer, Cazelles, Fromentin, Fonteneau and Ménard2008; Dalin et al. Reference Dalin, Kindvall and Björkman2009; Lamb and MacKay Reference Lamb and MacKay2010).
Population variability is estimated from a time series of annual abundances. For multivoltine insects, annual abundance has been quantified in two different ways: as the mean of regular samples taken through the season (Wellings et al. Reference Wellings, Chambers, Dixon and Aikman1985; Cappuccino Reference Cappuccino1987; Alyokhin et al. Reference Alyokhin, Drummond and Sewell2005, Reference Alyokhin, Drummond, Sewell and Storch2011; Lamb et al. Reference Lamb, MacKay and Alyokhin2011), or as the abundance at a particular event or time in the life cycle (Lamb and MacKay Reference Lamb and MacKay2010; Lamb et al. Reference Lamb, MacKay and Wool2012). Do these two approaches give similar estimates of population variability? A more general question applies to any species: is population variability affected by when annual abundance is measured in a life cycle? If population variability is a species trait, estimates made at different times in the season or life cycle should be consistent. If not consistent through time, tests of ecological hypotheses using interspecific comparisons of population variability may be compromised.
Various metrics with different statistical properties have been proposed to quantify population variability. The most recent is PV, the average of the differences for all pairs of abundance in a time series, with each difference divided by the larger abundance of the pair (Heath Reference Heath2006). The metric PV is a proportion between 0 and 1. A population that never varies in abundance has a PV of 0, one that fluctuates between two extremes has a PV of 1, and one with an intermediate level of variation in abundance has a PV between 0 and 1, regardless of whether average abundance is high or low. The metric PV is robust for a variety of distributions of annual abundance (Heath Reference Heath2006). Furthermore, PV does not depend on log transformation, with the attendant problem of 0-values, nor is it affected by a relationship between mean and variance of abundance. These properties make PV particularly suitable for interspecific comparisons.
The metric PV has been used to test ecological hypotheses and quantify population variability for a variety of organisms, including: density dependence in populations of salmonid fish (Dochtermann and Peacock Reference Dochtermann and Peacock2013), climatic variability and pelagic fish catches (Corbineau et al. Reference Corbineau, Rouyer, Cazelles, Fromentin, Fonteneau and Ménard2008), and colony size in seabirds (Jovani et al. Reference Jovani, Schielzeth, Mavor and Oro2012). For insects, PV has been used to test the following hypotheses: plant monocultures cause population instability or outbreaks of herbivores (Dalin et al. Reference Dalin, Kindvall and Björkman2009; Lamb and MacKay Reference Lamb and MacKay2010), population variability affects local persistence (Lamb and MacKay Reference Lamb and MacKay2010; Lamb et al. Reference Lamb, MacKay and Wool2012), spatial scale affects population variability (Lamb and MacKay Reference Lamb and MacKay2010; Lamb et al. Reference Lamb, MacKay and Wool2012), and population variability is species specific (Lamb et al. Reference Lamb, MacKay and Alyokhin2011).
Many insect species exhibit strong seasonal patterns and high levels of year-to-year variation in abundance. Aphid pests (Hemiptera: Aphididae) of crops often show a single annual peak in abundance that ranges over an order of magnitude or more (Way Reference Way1967; Maiteki et al. Reference Maiteki, Lamb and Ali-Khan1986; Lamb et al. Reference Lamb, Wise and MacKay1997; Honek and Martinkova Reference Honek and Martinkova2004). This seasonal pattern may result from seasonal changes in host suitability (Costamagna et al. Reference Costamagna, van der Werf, Bianchi and Landis2007), density-dependent feedback (Matis et al. Reference Matis, Kiffe, van der Werf, Costamagna, Matis and Grant2009), or seasonal host shifts (Lamb et al. Reference Lamb, Wise and MacKay1997). Aphid populations that have been studied for many years often show high levels of population variability, with interspecific differences in the level of population variability (Cappuccino Reference Cappuccino1987; Lamb et al. Reference Lamb, MacKay and Alyokhin2011). These population characteristics make aphid pests of crops particularly well suited for assessing the effects of seasonal dynamics on estimates of population variability. A previous study of the seasonal mean abundances of three potato-colonising aphids, Macrosiphum euphorbiae (Thomas), Myzus persicae (Sulzer), and Aphis nasturtii (Kaltenbach), identified consistent differences in population variability among species over six decades (1949–2009) (Lamb et al. Reference Lamb, MacKay and Alyokhin2011). For 1971–2009, weekly estimates of abundance are available. These data are used here to examine the seasonal dynamics of the aphids in the crop and any effects of seasonal change in abundance on estimates of population variability.
We test the assumption that estimates of PV are consistent over the season. First we show that three aphid species living in the same potato plots have different patterns of seasonal abundance. These different patterns justify using the species as replicates to examine whether or not PV depends on when abundance is measured during the season or in an aphid's life cycle. For all three species, we find some differences in PV estimated at different times in the season, and examine factors that affect PV. Finally, we consider what effect, if any, seasonal patterns of abundance have on interspecific comparisons of PV for these three aphids.
Materials and methods
The abundances of M. euphorbiae, M. persicae, and A. nasturtii were estimated by identifying and counting nonwinged aphids on three potato leaves from each of 20–25 individual potato plants, from each of five or six replicate plots. The plants were in untreated control plots (15.2 m long and four rows wide) that were part of insecticide trials at the University of Maine Aroostook Research Farm, Presque Isle, Maine, United States of America. Potatoes were usually planted in the last two weeks of May (86% of years), 24 May on average (range, 11 May–4 June). The plots and sampling methods are described in more detail by Alyokhin et al. (Reference Alyokhin, Drummond and Sewell2005, Reference Alyokhin, Drummond, Sewell and Storch2011) and Lamb et al. (Reference Lamb, MacKay and Alyokhin2011). Sampling began when plants reached about 20 cm in height (Shands et al. Reference Shands, Simpson and Reed1954) and continued weekly until harvest, from late June to September. Counts for each species were averaged over leaves and plants to estimate abundance as the average density per leaf. Weekly data were available for 35 years, but three years were excluded because fewer than seven samples were collected and four were excluded because a species was absent from all samples. The remaining 28 years had 7–11 weekly samples (18 had nine samples).
Sample weeks were numbered sequentially from one, to quantify the passage of time. The first sample occurred around 1 July (22 June–10 July) when plants were about 20 cm tall, which coordinated this time scale with plant phenology. Recognising that seasonal abundance might be more dependent on an aphid's life cycle than on plant phenology, a second time scale centred the weekly scale on annual peak abundance for each species. The abundance of each species was also determined for the week aphids first appeared in plots. Mean annual abundance was estimated as the average of all weekly estimates of abundance. The timing of the first appearance of aphids, the timing of peak abundance, and the number of weeks from first appearance to the peak were determined for each species and year. The increase in abundance each year was estimated as the natural logarithm of the ratio of the peak to the initial abundance.
Analysis of variance was used to compare abundance among aphid species (SYSTAT Software Inc. 2009), transforming abundance by either the natural logarithm or the square root depending on which most effectively normalised data. Relationships among estimates of abundance, between species or between weeks, were assessed using Pearson product moment correlations (SYSTAT Software Inc. 2009). Comparisons of the timing of events in the seasonal cycle, such as time to invasion or time to peak abundance, were made using nonparametric statistics, because data could not be normalised (Dwass–Steel–Critchlow–Fligner pairwise test and Kruskal–Wallis test, SYSTAT Software Inc. 2009). The metric PV (Heath Reference Heath2006) over 28 years was calculated for each of the weeks in the time scale related to plant phenology, for the mean annual abundance, and also for the time scale related to aphid phenology, i.e., the week of first occurrence, week of peak abundance, and weeks following peak abundance. Comparisons of PV among aphids were made by analysis of variance and paired t-tests; PV is expected to be normally distributed because each estimate is an average of many values (Heath Reference Heath2006).
Results
Seasonal dynamics
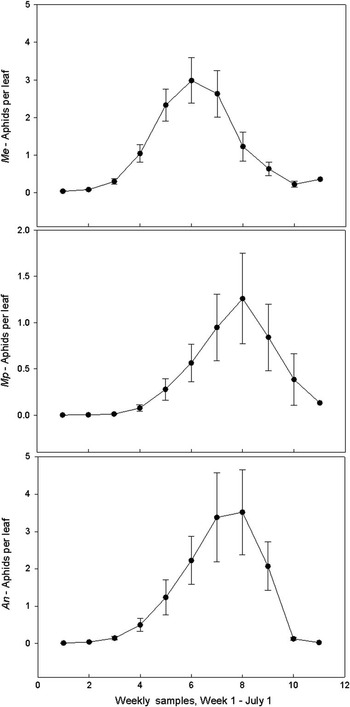
The abundance of the three aphid species tended to increase to a peak and then decline as the season progressed (Fig. 1). For M. euphorbiae and A. nasturtii, a single annual peak was the typical pattern with abundance increasing continuously to a peak in 18 and 15 of 28 years, respectively, and declining continuously after the peak in 12 and 11 years, respectively. Some years both species showed a slight decline in abundance in the week after aphids arrived, before rising to the annual peak. In some years, one or the other species showed a slight increase in abundance at the end of the season. Early- and late-season fluctuations were small, however, and may have been the result of sampling error. Myzus persicae also had a single peak in abundance, on average, but increased continuously at the beginning of summer in only six of 28 years. The shape of the annual abundance curve was symmetrical around the peak for M. euphorbiae but the abundances of M. persicae and A. nasturtii rose more gradually than they declined (Fig. 1).
Seasonal abundance (±1 standard error) of Macrosiphum euphorbiae (Me), Myzus persicae (Mp), and Aphis nasturtii (An) in potato plots for 28 years between 1971 and 2009.

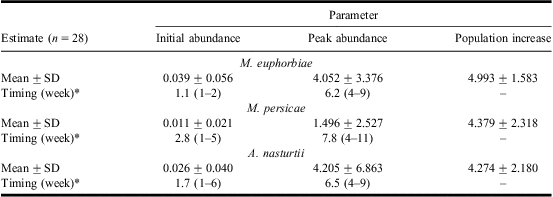
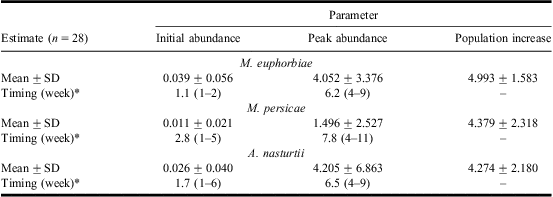
When aphids were first detected, abundance was lowest for M. persicae (Table 1), although not significantly so (F = 0.563, df = 2, 82, P = 0.572, ln-transformed abundance). Both M. euphorbiae and A. nasturtii had higher peak abundances than M. persicae (F = 9.1, df = 2, 82, P < 0.001, ln-transformed abundance) (Table 1). All three species increased similarly by over 400-fold from initial detection to peak abundance (F = 0.166, df = 2, 82, P = 0.847, ln(peak/initial)) (Table 1). Initial abundance was not related to peak abundance for any of the species (Pearson product moment correlations <0.3, n = 28, P > 0.15). The abundance of the three aphid species did not fluctuate together from year to year, either for initial abundance (Pearson product moment correlations <0.3, n = 28, P > 0.19) or for peak abundance (Pearson product moment correlations <0.4, n = 28, P > 0.07).
Parameters of seasonal abundance (aphids per leaf) and the timing of that parameter during the season for Macrosiphum euphorbiae, Myzus persicae, and Aphis nasturtii in potato plots over 28 years: initial abundance on the first date aphids were detected, peak abundance, and population increase estimated as the natural logarithm of peak/initial abundance.
Note: *Mean (range) for the week each parameter was estimated. Sample weeks were numbered 1–11 and began about 1 July.
Macrosiphum euphorbiae usually was detected in the first sample (26 of 28 years), slightly ahead of A. nasturtii, and almost two weeks ahead of M. persicae (Table 1). These differences were significant (Dwass–Steel–Critchlow–Fligner pairwise test, P < 0.042). The peak abundance of M. euphorbiae also occurred slightly earlier than for A. nasturtii, and 1.6 weeks ahead of that for M. persicae (Table 1). Differences in timing of peak abundance were detected between both M. euphorbiae and A. nasturtii in comparison with M. persicae (Dwass–Steel–Critchlow–Fligner pairwise test, P < 0.013), but not between M. euphorbiae and A. nasturtii (P = 0.633). All three species took five weeks (4.9–5.1), on average, to reach peak abundance after arriving in the plots (Kruskal–Wallis test, P = 0.92).
Seasonal abundance and PV
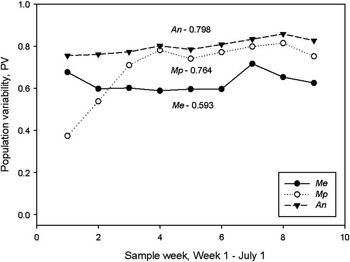
PV was always highest for A. nasturtii and higher for M. persicae than for M. euphorbiae after week 2 (Fig. 2). PV was relatively uniform in the middle of the season (weeks 4–6) and deviated little from the mid-season mean, except for some negative deviations at the beginning of the season and positive ones after peak abundance (Table 2). For M. persicae, the early-season negative deviations were due to the number of 0-values for abundance, with the number decreasing in successive weeks: no M. persicae were detected in weeks 1–4 for 22, 18, 13, and 6 of 28 years, respectively. Large numbers of equal values (0-values in this case) reduced PV, as expected from the way PV is calculated. Also for A. nasturtii, no aphids were detected in weeks 1–3 for nine, six, and four years, respectively, too few 0-values to appreciably influence PV, although the deviations in PV were negative in the first three weeks as expected with those 0-values (Table 2). Macrosiphum euphorbiae was absent from only two of over 250 samples, too few to affect PV. Thus, negative deviations early in the season were largely due to the delayed arrival of two species, which led to 0-values when the time scale was based on plant phenology.
Population variability quantified as PV (Heath Reference Heath2006) estimated weekly through the season for three species of aphid, Macrosiphum euphorbiae (Me), Myzus persicae (Mp), and Aphis nasturtii (An) in potato plots for 28 years. The average PV for weeks 4–6, when PV was most uniform, is provided for each species (see also Table 2).

Deviation (%) of PV (Heath Reference Heath2006) for nine successive sample weeks, from mean PV for sample weeks 4–6, for Me, Mp, and An in potato plots.

Note: PV, population variability; Me, Macrosiphum euphorbiae; Mp, Myzus persicae; An, Aphis nasturtii.
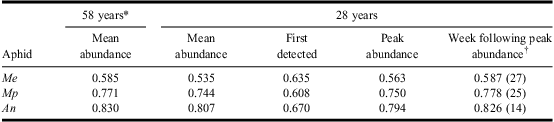
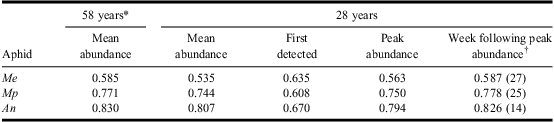
In the week after average peak abundance based on plant phenology, week 7, PV of M. euphorbiae deviated by 21% compared with weeks 4–6, the largest deviation for this aphid (Table 2; Fig. 2). Using a time scale based on aphid phenology (centred on the week of peak abundance each year), PV for the week after the actual peak abundance was 0.587 (Table 3), and the deviation dropped to 1%. Deviations in PV for M. persicae and A. nasturtii were also >5% in week 8, (Table 2; Fig. 2), but dropped to <4% when PV for the actual week after peak abundance was estimated (Table 3). Positive deviations >5% at the end of the season were reduced to <5% when the time scale was based on the phenology of the aphids rather than on plant phenology.
PV (Heath Reference Heath2006), estimated for mean annual abundance using a time scale based on plant phenology, and three points in the annual cycle of abundance for each of Me, Mp, and An in potato plots.
Notes: *Adapted from Lamb et al. (Reference Lamb, MacKay and Alyokhin2011).
†PV based on n < 28 (years) because peak abundance sometimes occurred in the last sample.
PV, population variability; Me, Macrosiphum euphorbiae; Mp, Myzus persicae; An, Aphis nasturtii.
Estimates of PV when aphids were first detected in the plots did differ by >5% from other values, however, higher than expected for M. euphorbiae and lower than expected for the other two species (Table 3). These high deviations were evident when compared with PV at mid-season (Table 2) or at annual peak abundance (Table 3), and so were not explained by the time scale.
Estimates of PV calculated from the average of weekly samples over the season for 28 years were slightly lower than for 58 years (Table 3). Estimates of PV for mean annual abundance deviated by <5% from PV at peak abundance (Table 3). For M. euphorbiae, M. persicae, and A. nasturtii, high correlations were found between peak and mean annual abundance (Pearson product moment correlation: R = 0.95, 0.99, 0.98, respectively, n = 28, P < 0.001). Initial abundance, however, was not correlated with mean annual abundance (Pearson product moment correlation: R = 0.002, −0.04, 0.35, n = 28, P > 0.99, 0.82, 0.06, respectively). Early-season abundance, although uncorrelated with later abundance and showing a different PV than later samples, had little influence on PV based on mean annual abundance because the low abundance early in the season contributed little to mean annual abundance in comparison with mid-season abundance.
Excluding the first two weeks when PV of M. persicae and A. nasturtii were most affected by 0-values related to late arrival, the rank order of PV was the same among species from sample weeks 3–9 (Fig. 2). Although PV values for M. persicae and A. nasturtii over this time differed by only 0.046 units, this difference was statistically significant (paired t-test, t = 6.6, df = 6, P = 0.001). Even a difference of 0.03 units was statistically significant when weeks 4–6 were considered (paired t-test, t = 4.9, df = 2, P = 0.04). The ability to detect such differences between the PV values confirms the uniformity of PV over the season that is evident visually (Fig. 2).
Discussion
Three potato-colonising aphids have distinct patterns of seasonal abundance. They arrive and peak at different times in the season, reach different peak densities, and the symmetry of their seasonal abundances around the peak differs. Furthermore, their year-to-year fluctuations in abundance were not significantly correlated. Also, the year-to-year changes in abundance of these populations are regulated by different mechanisms (Alyokhin et al. Reference Alyokhin, Drummond, Sewell and Storch2011). Although having broadly similar life histories and coexisting on the same host plants, these three species have sufficiently different population dynamics within and between seasons that they can be considered replicates for assessing the effects of seasonal patterns of abundance on estimates of PV.
For all three aphids, PV calculated from mid-season abundance usually deviated by <5% from PV calculated for each week through the season, for specific points in the life cycle, or for annual mean abundance. Large positive deviations immediately after the week of average peak abundance disappeared if the actual week after peak abundance was considered. Therefore, these positive deviations were an artefact of a weekly time scale based on plant growth stage, which was not perfectly synchronised with the seasonal abundance of the aphids. Large negative deviations early in the season had a similar cause: many years M. persicae and A. nasturtii did not disperse into potatoes until a week or more after sampling was initiated, whereas M. euphorbia was nearly always present when sampling began. The late invasion of the two species resulted in 0-values and reduced PV, because the weekly samples based on plant growth did not correspond to the seasonal cycle of these aphids.
Thus, the assumption that PV is consistent over the season or through the life cycle is correct for these three species, with one exception. PV estimated at the time aphids first arrive in potatoes differs by more than 10% from PV estimated mid-season. PV at invasion probably reflects processes occurring on the winter hosts or during dispersal to the potato fields. Only once the aphids arrive do population processes specific to potatoes establish a PV characteristic of each species. Although the PV characteristic of invasion was short lived, the occurrence of these two levels of PV confirm that estimates of this parameter must be considered in the context of the life cycle of each species (Connell and Sousa Reference Connell and Sousa1983).
Often estimates of mean annual abundance based on regular samples through the season have been used to calculate population variability (Wellings et al. Reference Wellings, Chambers, Dixon and Aikman1985; Cappuccino Reference Cappuccino1987; Alyokhin et al. Reference Alyokhin, Drummond and Sewell2005, Reference Alyokhin, Drummond, Sewell and Storch2011; Lamb et al. Reference Lamb, MacKay and Alyokhin2011). The potato-colonising aphids illustrate that such seasonal means may include anomalous estimates of abundance, e.g., estimates based on the plant phenology rather than an aphid's seasonal pattern of abundance. These estimates might reduce accuracy when calculating PV. Combining estimates of abundance associated with different parts of a life cycle, e.g., the invasion versus increase phases of a life cycle, might be expected to further reduce the accuracy of PV. In fact, for three potato-colonising aphids, PV based on mean annual abundance was similar to PV that excluded these potential sources of error. A mid-season abundance, particularly at the peak, gave a PV that was 5% higher than PV based on mean annual abundance for M. euphorbiae, but <1% different for M. persicae and A. nasturtii.
The similarity among estimates of PV based on mean abundance and individual samples in the season encourages confidence in our ability to make interspecific comparisons, at least for aphids, even if some previously published data are based on seasonal means and others are based on abundance at a specific time in the life cycle. Nevertheless, mean annual abundance is probably best avoided as a basis for estimating PV. For these three species of aphid, the ideal time in the life cycle is when abundance peaks. The time of peak abundance can only be determined from multiple samples through the season, which is labour intensive, and so it is reassuring that a single mid-season sample gives a similar estimate of PV to one at peak abundance.
PV is so uniform over most of the season that the average PV of 0.77 for M. persicae can be reliably distinguished from an average PV of 0.81 for A. nasturtii using five or six consecutive weekly estimates, or even three consecutive estimates from mid-season. Detecting such small differences confirms that PV, Reference HeathHeath's (2006) metric for population variability, can be used effectively to make interspecific comparisons. The uniformity of the estimates of PV for these three aphids over their different population cycles in a single habitat also increases our confidence that population variability represents a species-specific property of population dynamics.
Acknowledgements
The authors thank Alejandro Costamagna for insight into the seasonal dynamics of aphids, and Joel Heath for introducing us to literature on PV.