Introduction
Both genetic and environmental influences increase risk for psychotic disorder. One of the best replicated, non-proxy environmental effects with a relatively large effect size is childhood adversity (CA) (Varese et al., Reference Varese, Smeets, Drukker, Lieverse, Lataster, Viechtbauer and Bentall2012). Molecular genetic analysis of schizophrenia case-control data allows for estimation of a model that predicts trait values from genetic variation, expressed as a polygenic risk score (PRS-SZ), providing a direct measure of schizophrenia genetic risk for analysis (Purcell et al., Reference Purcell, Wray, Stone, Visscher, O'Donovan and Sullivan2009).
The risk associated with CA and PRS is not specific for psychotic disorder. Around two-thirds of genetic associations are common to schizophrenia, bipolar disorder and major depressive disorder and overlap also exists with genetic variants contributing to autism, attention-deficit/hyperactivity disorder and intellectual disabilities (Cross-Disorder Group of the Psychiatric Genomics et al., Reference Lee, Ripke, Neale, Faraone and Purcell2013; Cross-Disorder Group of the Psychiatric Genomics Consortium, 2019). Therefore, PRS of mental disorders to a large degree represent transdiagnostic risk for mental suffering, particularly the affective spectrum. The level of non-specificity seen for genetic risk also applies to environmental risk factors. CA thus is similarly broadly associated with a range of mental (affective) disorders (Green et al., Reference Green, McLaughlin, Berglund, Gruber, Sampson, Zaslavsky and Kessler2010).
The non-specificity of the most important genetic and environmental risks for psychotic disorder may indicate a shared mechanism of generic mental suffering. This is compatible with epidemiological studies on psychopathology, which have established that the earliest expression of psychosis typically arises within a transdiagnostic mix of symptoms (McGorry & van Os, Reference McGorry and van Os2013), particularly depression (Hafner et al., Reference Hafner, Maurer, Trendler, an der Heiden, Schmidt and Konnecke2005), and that affective dysregulation, particularly depression, is strongly associated with the prevalence and incidence of subthreshold expression of psychotic phenomena in the general population (Guloksuz et al., Reference Guloksuz, Pries, ten Have, de Graaf, van Dorsselaer, Klingenberg and van Os2020; van Os & Reininghaus, Reference van Os and Reininghaus2016) as well as with clinical psychotic syndromes (Herniman et al., Reference Herniman, Allott, Phillips, Wood, Uren, Mallawaarachchi and Cotton2019; Wilson, Yung, & Morrison, Reference Wilson, Yung and Morrison2020). It has been suggested that affective processes are crucial in the causation of psychosis (Bebbington, Reference Bebbington2015; Garety et al., Reference Garety, Freeman, Jolley, Dunn, Bebbington, Fowler and Dudley2005; Krabbendam & van Os, Reference Krabbendam and van Os2005; Upthegrove, Marwaha, & Birchwood, Reference Upthegrove, Marwaha and Birchwood2017), as predicted by network models of psychosis (Isvoranu, Borsboom, van Os, & Guloksuz, Reference Isvoranu, Borsboom, van Os and Guloksuz2016), in which genetic and environmental influences impact each other in a dynamic fashion (Guloksuz et al., Reference Guloksuz, van Nierop, Lieb, van Winkel, Wittchen and van Os2015; Isvoranu et al., Reference Isvoranu, van Borkulo, Boyette, Wigman, Vinkers and Borsboom2017; Isvoranu et al., Reference Isvoranu, Guloksuz, Epskamp, van Os, Borsboom and Investigators2020).
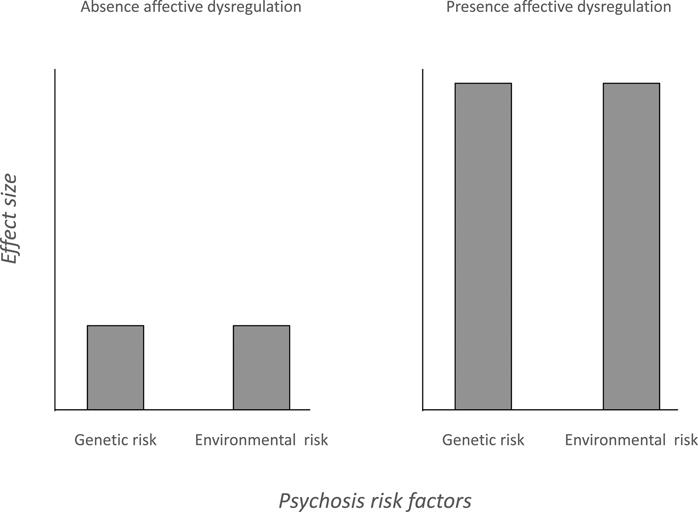
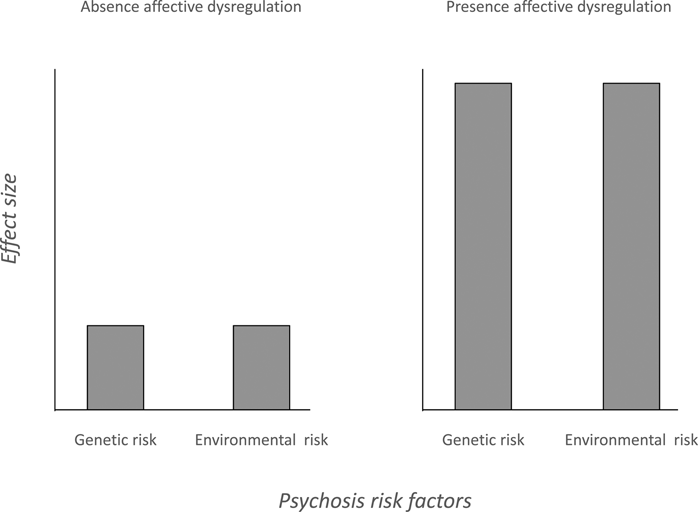
These data in combination suggest that although CA and PRS-SZ are strongly associated with schizophrenia spectrum disorder, the mechanism by which they increase risk may be transdiagnostic and mediated in part by a generic pathway of affective dysregulation. If this were true, the impact of CA and PRS on psychosis outcomes would show a degree of dependence on co-occurring affective dysregulation: i.e. is higher if there is additional evidence of affective dysregulation and is lower in the absence of affective dysregulation (Fig. 1). Recent work using indirect measures of genetic risk indeed suggest that this type of relationship exists between (proxy) genetic and environmental risks on the one hand and affective dysregulation on the other in their effects on psychosis outcomes (Pries et al., Reference Pries, Guloksuz, Ten Have, de Graaf, van Dorsselaer, Gunther and van Os2018; Radhakrishnan et al., Reference Radhakrishnan, Guloksuz, Ten Have, de Graaf, van Dorsselaer, Gunther and van Os2019). However, the hypothesis remains to be tested with direct measures of genetic risk such as PRS-SZ.
Evidence that genetic and environmental risks for psychosis are mediated by an affective pathway: effect sizes will be low if the psychosis outcome is not accompanied by affective dysregulation (left) and effect sizes will be high if affective dysregulation is co-present with the psychosis outcome.
In this study, we examined, and attempted to replicate, the hypothesis that the association between PRS-SZ and CA on the one hand, and psychosis outcomes on the other, is contingent, to a degree, on co-presence of significant affective dysregulation. To this end, we examined the interacting contributions of PRS-SZ and CA on the one hand, and affective dysregulation on the other, in models of psychosis in (i) a large population-based cohort (n = 6646) that was examined four times over period of 9 years; and (ii) a large schizophrenia-spectrum case-sibling-control study of 4068 participants.
Given strong evidence that the terms making up the interactions, PRS-SZ and CA on the one hand, and affective dysregulation on the other, are associated with each other (Brainstorm et al., Reference Brainstorm, Anttila, Bulik-Sullivan, Finucane, Walters, Bras and Murray2018; Kessler & Magee, Reference Kessler and Magee1993; Nivard et al., Reference Nivard, Gage, Hottenga, van Beijsterveldt, Abdellaoui, Bartels and Middeldorp2017), the theoretical model of how they work together to affect the outcome of psychosis was considered to be one of mediation, under the framework proposed by Kraemer and colleagues (Kraemer, Stice, Kazdin, Offord, & Kupfer, Reference Kraemer, Stice, Kazdin, Offord and Kupfer2001). According to this framework, statistical interaction is indicative of moderation if the terms of the interaction are not correlated with each other, and indicative of mediation if the terms of the interaction are correlated with each other. Conceptually, this means that mediation would explain values of Y (psychosis) as indirectly caused by values of X (genetic and non-genetic aetiology) over a pathway of affective dysregulation.
Method
Study populations
Nemesis-2
All four waves of the Netherlands Mental Health Survey and Incidence Study-2 (NEMESIS-2) were used. NEMESIS-2 was conducted to study the prevalence, incidence, course and consequences of mental disorders in the Dutch general population. The baseline data of NEMESIS-2 were collected from 2007 to 2009, follow-up was until 2018. The study was approved by the Medical Ethics Review Committee for Institutions on Mental Health Care and written informed consent was collected from participants at each wave. To ensure representativeness of the sample in terms of age (between the ages of 18 and 65 at baseline), region and population density, a multistage random sampling procedure was applied. Dutch illiteracy was an exclusion criterion. Non-clinician, trained interviewers applied the Composite International Diagnostic Interview (CIDI) version 3.0 (Alonso et al., Reference Alonso, Angermeyer, Bernert, Bruffaerts, Brugha and Bryson2004; de Graaf, ten Have, Burger, & Buist-Bouwman, Reference de Graaf, ten Have, Burger, Buist-Bouwman, Ustun and Kessler2008) and additional questionnaires during home visits. Details of NEMESIS-2 are provided elsewhere (de Graaf, Ten Have, & van Dorsselaer, Reference de Graaf, Ten Have and van Dorsselaer2010; de Graaf, ten Have, van Gool, & van Dorsselaer, Reference de Graaf, ten Have, van Gool and van Dorsselaer2012). The first wave (T0) enrolled 6646 participants (response rate 65.1%; average interview duration: 95 min), who were followed up in three visits within 9 years: successive response rates at year 3 (T1), year 6 (T2) and year 9 (T3) were 80.4% (n = 5303; excluding those who deceased; interview duration: 84 min), 87.8% (n = 4618; interview duration: 83 min) and 86.8% (n = 4007; interview duration: 102 min), respectively. Rates at baseline reflect lifetime occurrence; rates at T1–T3 reflect interval (baseline–T1, T1–T2 and T2–T3) occurrence of ~3 years. Attrition between T0 and T3 was not significantly associated with any of the mental disorders at T0, after controlling for sociodemographic characteristics (de Graaf, van Dorsselaer, Tuithof, & ten Have, Reference de Graaf, van Dorsselaer, Tuithof and ten Have2018; Nuyen et al., Reference Nuyen, Tuithof, de Graaf, van Dorsselaer, Kleinjan and ten Have2020).
EUGEI
The EUGEI project is a 25-centre, 15-country, EU-funded collaborative network studying the impact of genetic and environmental factors on the onset, course and neurobiology of psychosis spectrum disorder (European Network of National Networks studying Gene-Environment Interactions in Schizophrenia et al., Reference van Os, Rutten, Myin-Germeys, Delespaul, Viechtbauer and Mirjanic2014). Workpackage 6, entitled ‘Vulnerability and Severity’, focussed on the psychometric expression of genetic and environmental liability in the siblings of patients, who are at higher than average genetic and environmental risk compared to healthy comparison participants. The sample in Workpackage 6 was collected in Spain (5 centres), Turkey (3 centres) and Serbia (1 centre) and consisted of 1525 healthy comparison participants, 1261 patients with a diagnosis of psychosis spectrum disorder (average duration of illness since age of first contact with mental health services: 9.9 years) and 1282 siblings of these patients. Patients were diagnosed with schizophrenia spectrum disorder according to the DSM-IV-TR. This diagnosis was confirmed by the Operational Criteria Checklist for Psychotic and Affective Illness (McGuffin, Farmer, & Harvey, Reference McGuffin, Farmer and Harvey1991). Exclusion criteria for all participants were diagnosis of psychotic disorders due to another medical condition, history of head injury with loss of consciousness and intelligence quotient <70.
To achieve high quality and homogeneity in clinical, experimental and environmental assessments, standardised instruments were administered by psychiatrists, psychologists or trained research assistants who completed mandatory on-site training sessions and online training modules including interactive interview videos and self-assessment tools (European Network of National Networks studying Gene-Environment Interactions in Schizophrenia et al., Reference van Os, Rutten, Myin-Germeys, Delespaul, Viechtbauer and Mirjanic2014). Both on-site and online training sessions were repeated annually to maintain high inter-rater reliability throughout the study enrolment period (for details see: https://cordis.europa.eu/result/rcn/175696_en.html).
The EUGEI project was approved by the Medical Ethics Committees of all participating sites and conducted in accordance with the Declaration of Helsinki. All respondents provided written informed consent and, in the case of minors, such consent was also obtained from parents or legal guardian.
Assessment of psychotic experiences
In NEMESIS-2, a psychosis add-on instrument based on the G section of previous CIDI versions was included. This add-on instrument consists of 20 psychotic symptoms corresponding to the symptoms assessed in a previous population survey in the Netherlands, NEMESIS, the precursor of NEMESIS-2 (Bijl, Ravelli, & van Zessen, Reference Bijl, Ravelli and van Zessen1998; de Graaf et al., Reference de Graaf, Ten Have and van Dorsselaer2010). Detailed descriptions of the specific psychotic experience (PE) items can be found in previous work using NEMESIS (Smeets et al., Reference Smeets, Lataster, van Winkel, de Graaf, Ten Have and van Os2013) and NEMESIS-2 (van Nierop et al., Reference van Nierop, van Os, Gunther, Myin-Germeys, de Graaf, ten Have and van Winkel2012). At baseline, lifetime prevalence of PE was assessed. A clinician did a follow-up telephone interview when participants reported a psychotic symptom to assess whether this symptom was a true PE using questions from the Structured Clinical Interview for DSM-IV. At baseline, a total of 1081 participants (16.3%) endorsed at least one self-reported PE. Of these, 794 participated in clinical re-interview (73.5%), of whom 340 (42.8%) reported at least one clinically validated PE. At T1, 440 out of a total 5303 (8.3%) participants reported that at least one self-reported PE had occurred since the previous interview. Of these, 367 (83.4%) participants were available for clinical re-interview, of whom 172 (46.9%) reported at least one clinically validated PE. At T2, 284 out of the total 4618 (6.2%) participants reported at least one self-reported PE since the previous interview. Of these, 230 (81.0%) participants were available for clinical re-interview, of which 135 (58.7%) reported at least one clinically validated PE. At T3, 222 out of the total 4007 (5.5%) participants reported at least one self-reported PE since the previous interview. Of these, 207 (93.2%) participants were available for clinical re-interview, of which 77 (37.2%) reported at least one clinically validated PE. Given similarities between CIDI self-reported and clinically validated PE, in terms of associations, predictive value and outcome (Bak et al., Reference Bak, Delespaul, Hanssen, de Graaf, Vollebergh and van Os2003; van der Steen et al., Reference van der Steen, Myin-Germeys, van Nierop, Ten Have, de Graaf, van Dorsselaer and van Winkel2019; van Nierop et al., Reference van Nierop, van Os, Gunther, Myin-Germeys, de Graaf, ten Have and van Winkel2012), CIDI self-reported PE were used, thus increasing statistical power.
PE were dichotomised consistent with previous work in NEMESIS and NEMESIS-2 (Pries et al., Reference Pries, Guloksuz, Ten Have, de Graaf, van Dorsselaer, Gunther and van Os2018; Radhakrishnan et al., Reference Radhakrishnan, Guloksuz, Ten Have, de Graaf, van Dorsselaer, Gunther and van Os2019; van Rossum, Dominguez, Lieb, Wittchen, & van Os, Reference van Rossum, Dominguez, Lieb, Wittchen and van Os2011). Thus, the presence of delusions was defined as having at least one delusion endorsed and the presence of hallucinations was similarly defined.
In EUGEI, the Community Assessment of Psychic Experiences (Cape; http://www.cape42.homestead.com) was developed to rate self-reports of lifetime psychotic experiences (Konings, Bak, Hanssen, van Os, & Krabbendam, Reference Konings, Bak, Hanssen, van Os and Krabbendam2006). The Cape includes dimensions of positive psychotic experiences, negative experiences and depressive experiences. Effect sizes for internal stability are high, as are correlations between Cape dimensions and conceptually similar dimensions of the Structured Interview for Schizotypy, Revised (Konings et al., Reference Konings, Bak, Hanssen, van Os and Krabbendam2006; Vollema & Ormel, Reference Vollema and Ormel2000). Items are modelled on patient experiences as contained in the Present State Examination, 9th version (Wing, Cooper, & Sartorius, Reference Wing, Cooper and Sartorius1974), schedules assessing negative symptoms such as the Scale for the Assessment of Negative Symptoms (Andreasen, Reference Andreasen1982) and the Subjective Experience of Negative Symptoms (Selten, Sijben, van den Bosch, Omloo Visser, & Warmerdam, Reference Selten, Sijben, van den Bosch, Omloo Visser and Warmerdam1993), and scales assessing depressive symptoms such as the Calgary Depression Scale (Addington, Addington, & Maticka-Tyndale, Reference Addington, Addington and Maticka-Tyndale1993). Items are scored on a four-point scale. In the current analyses, Cape dimensions of frequency of positive experiences (20 items), and depressive experiences (8 items) were included. A total score representing the mean of all items was calculated for each dimension. For the analyses, conform previous work in this area (Heins et al., Reference Heins, Simons, Lataster, Pfeifer, Versmissen, Lardinois and Myin-Germeys2011; van Dam et al., Reference van Dam, van Nierop, Viechtbauer, Velthorst, van Winkel, Genetic and Wiersma2015; van Os, Marsman, van Dam, Simons, & Investigators, Reference van Os, Marsman, van Dam, Simons and Investigators2017), frequency of positive symptoms, dichotomised around the 80th percentile in the control group, were used as measures for delusions and hallucinations. Similarly, the frequency score of the 17 Cape delusion items, dichotomised around the 80th percentile in the control group, was used as the delusion outcome. Any presence of hallucinations, as measured by the three Cape hallucination items, was used as the binary hallucination outcome.
Childhood adversity
In NEMESIS-2, CA was assessed at T0 using a questionnaire based on the NEMESIS trauma questionnaire (de Graaf et al., Reference de Graaf, Ten Have and van Dorsselaer2010). Whenever a subject reported having experienced one of five types of CA before the age of 16 years [emotional neglect (not listened to, ignored or unsupported), physical abuse (kicked, hit, bitten or hurt with object or hot water), psychological abuse (yelled at, insulted, unjustly punished/treated, threatened, belittled or blackmailed), peer victimisation (bullying) and one time or more sexual abuse (any unwanted sexual experience)], they were asked to state how often it had occurred on a scale of 1 (once) to 5 (very often). Conforming with previous work in this area, the CA score was dichotomised at the 80th percentile (Heins et al., Reference Heins, Simons, Lataster, Pfeifer, Versmissen, Lardinois and Myin-Germeys2011; van Dam et al., Reference van Dam, van Nierop, Viechtbauer, Velthorst, van Winkel, Genetic and Wiersma2015; van Os et al., Reference van Os, Marsman, van Dam, Simons and Investigators2017).
In EUGEI, CA was assessed using the Childhood Trauma Questionnaire Short Form (CTQ) that consists of 28 items rated on a five-point Likert scale measuring five domains of maltreatment (emotional and physical neglect along with emotional, physical and sexual abuse) (Bernstein et al., Reference Bernstein, Stein, Newcomb, Walker, Pogge, Ahluvalia and Zule2003). The psychometric characteristics of the translated versions (Spanish, Turkish, Dutch and Serbian) of the CTQ have been comprehensively studied (Hernandez et al., Reference Hernandez, Gallardo-Pujol, Pereda, Arntz, Bernstein, Gaviria and Gutierrez-Zotes2013; Mitkovic-Voncina, Lecic-Tosevski, Pejovic-Milovancevic, & Popovic-Deusic, Reference Mitkovic-Voncina, Lecic-Tosevski, Pejovic-Milovancevic and Popovic-Deusic2014; Sar, Akyuz, Kundakci, Kiziltan, & Dogan, Reference Sar, Akyuz, Kundakci, Kiziltan and Dogan2004; Thombs, Bernstein, Lobbestael, & Arntz, Reference Thombs, Bernstein, Lobbestael and Arntz2009). Consistent with previous work in similar samples, CTQ score was modelled as a binary variable, calculated around the 80th percentile in the control group (Heins et al., Reference Heins, Simons, Lataster, Pfeifer, Versmissen, Lardinois and Myin-Germeys2011; van Dam et al., Reference van Dam, van Nierop, Viechtbauer, Velthorst, van Winkel, Genetic and Wiersma2015; van Os et al., Reference van Os, Marsman, van Dam, Simons and Investigators2017).
Polygenic risk score for schizophrenia
For details of genotyping and calculation of PRS in NEMESIS-2 and EUGEI, we refer to recent papers detailing these procedures (Guloksuz et al., Reference Guloksuz, Pries, Delespaul, Kenis, Luykx, Lin and van Os2019; Pries et al., Reference Pries, van Os, ten Have, de Graaf, van Dorsselaer, Bak and Guloksuz2020). We used recent GWASs of schizophrenia (Pardinas et al., Reference Pardinas, Holmans, Pocklington, Escott-Price, Ripke, Carrera and Walters2018) for PRS calculations (Choi, Mak, & O'Reilly, Reference Choi, Mak and O'Reilly2020). PRS-SZ was created, using the same genotyping platform for EUGEI and NEMESIS-2, from best-estimate genotypes at six different p-thresholds (0.5, 0.1, 0.05, 5 × 10⁻³, 5 × 10⁻⁵, 5 × 10⁻⁸). For our primary analyses, we used the p-threshold of <0.05, as this threshold explained most variation in the phenotype in the Psychiatric Genomics Consortium analysis (Schizophrenia Working Group of the Psychiatric Genomics Consortium, 2014). Conform previous analyses in these samples, statistical analyses were adjusted for three and 10 principal components in NEMESIS-2 and EIGEI, respectively (Guloksuz et al., Reference Guloksuz, Pries, Delespaul, Kenis, Luykx, Lin and van Os2019; Pries et al., Reference Pries, van Os, ten Have, de Graaf, van Dorsselaer, Bak and Guloksuz2020).
Affective dysregulation
A measure of affective dysregulation was constructed that was comparable across NEMESIS-2 and EUGEI. In NEMESIS-2, depressive symptoms were assessed with the CIDI version 3.0 (Alonso et al., Reference Alonso, Angermeyer, Bernert, Bruffaerts, Brugha and Bryson2004; de Graaf et al., Reference de Graaf, ten Have, Burger, Buist-Bouwman, Ustun and Kessler2008). Affective dysregulation was considered present if participants experienced at least one of the two CIDI 3.0 core symptoms of Depressive Episode, assessed at baseline (assessing lifetime occurrence) and each follow-up visit (assessing interval occurrence). The prevalence of affective dysregulation, thus defined, was 36%.
In EUGEI, Cape frequency of depressive symptoms (eight items), dichotomised around the 80th control percentile, was used as the measure for affective dysregulation, conform previous work in this area (Heins et al., Reference Heins, Simons, Lataster, Pfeifer, Versmissen, Lardinois and Myin-Germeys2011; van Dam et al., Reference van Dam, van Nierop, Viechtbauer, Velthorst, van Winkel, Genetic and Wiersma2015; van Os et al., Reference van Os, Marsman, van Dam, Simons and Investigators2017).
Statistical analyses
Risk set
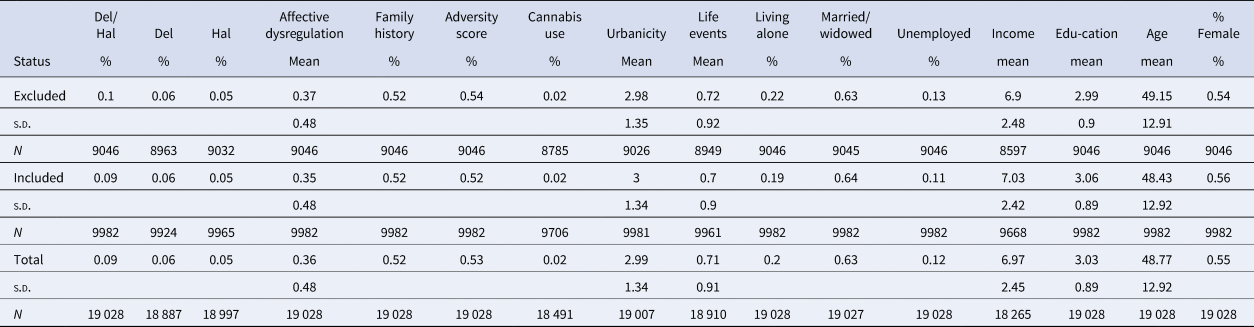
NEMESIS-2: For the CA analyses, data on CA, affective dysregulation and psychotic experiences were available for the entire sample with few missing values (n = 6643 at baseline). In the PRS analysis, material for DNA analysis of sufficient quality was available for 3104 individuals (47%) at T0 (Pries et al., Reference Pries, van Os, ten Have, de Graaf, van Dorsselaer, Bak and Guloksuz2020). Excluding individuals who at interview has been assessed as member of an ethnic minority, given lack of generalisability of PRS to this group, left 3052 for analysis. These 3052 individuals yielded 9982 observations with data on psychosis outcomes and affective dysregulation at least one of the four interviews. Values for important diagnostic, socio-demographic, familial and environmental risk variables were very similar in a comparison between the 9982 included and the 9046 non-included observations (Table 1).
NEMESIS-2 sample characteristics, stratified by polygenic risk score risk set included for analysis (n = 9982 observations) or excluded from analysis (n = 9046 observations)
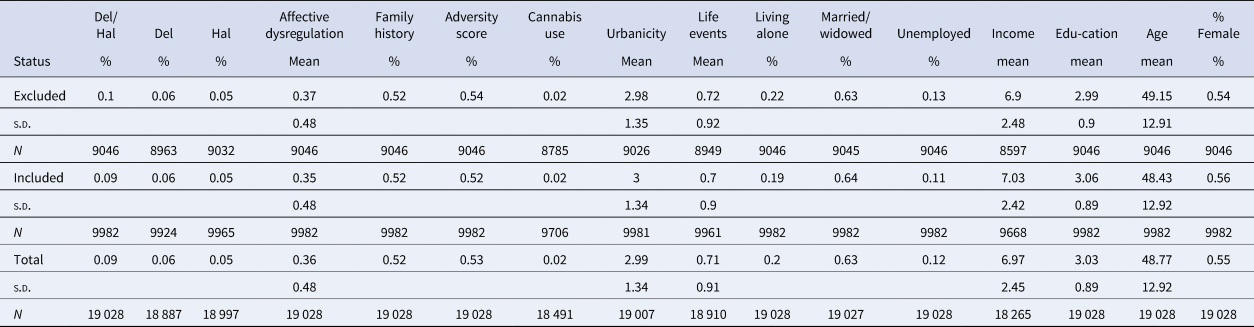
Del/Hal: CIDI rating delusions or hallucinations.
Del: CIDI rating delusions.
Hal: CIDI rating hallucinations.
Affective dysregulation: at least one of the CIDI 3.0 core symptoms of depressive episode.
Family history: for participants who screened positive for the following psychiatric diagnoses, presence of the disorder in direct relatives was assessed: alcohol/drugs misuse, depression, mania and anxiety disorders (panic disorder, social phobia, agoraphobia, generalised anxiety disorder).
Adversity score: total score NEMESIS-2 trauma questionnaire.
Cannabis use: use of once or more per week during the lifetime period of most frequent use.
Urbanicity: five levels based on the Dutch classification of increasing population density.
Life events: total score on whether participants had experienced one of nine life events within the last 12 months (T0) or since the last interview (T1 to T3).
Income: net annual household income, rated on a scale from 1 (lowest) to 14 (highest).
Education: four-level continuous variable (higher level = higher educational level).
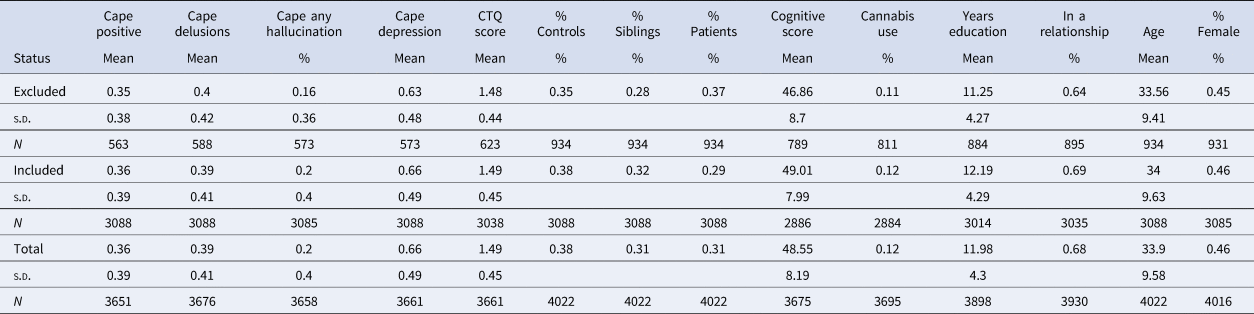
EUGEI: The EUGEI sample consisted of 4068 individuals. For the CA analysis, there were 3627 participants with complete data for psychosis outcomes, affective dysregulation and CA (1491 healthy comparison participants, 1137 relatives and 999 patients). For the PRS analysis, individuals of non-white ethnic group were excluded, as were individuals with missing GWAS information and missing data on psychosis outcomes and affective dysregulation, leaving 3088 participants (1186 healthy comparison participants, 1001 relatives and 901 patients) for the current analysis. Values for important diagnostic, socio-demographic, familial and environmental risk variables were very similar in a comparison between the 3088 included and the 934 non-included observations (Table 2).
EUGEI sample characteristics, stratified by polygenic risk score risk set included for analysis (n = 3088 participants) or excluded from analysis (n = 934 participants)
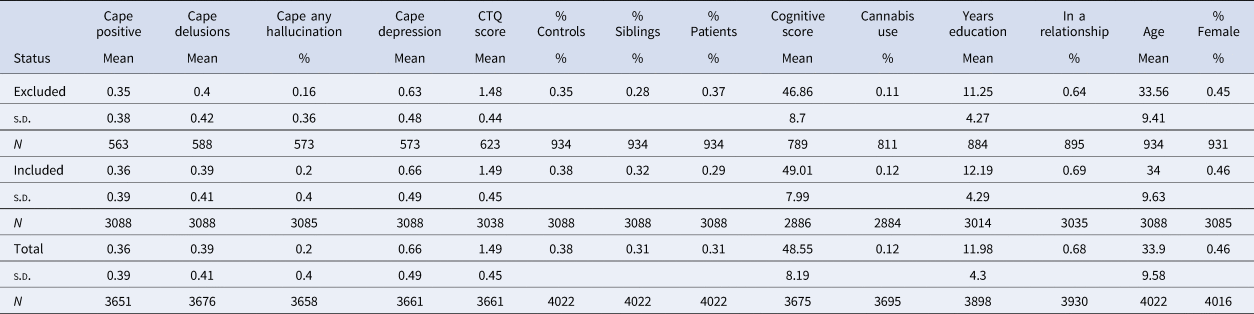
Cape positive: Cape frequency score positive symptoms.
Cape delusions: Cape frequency score delusion items.
Cape any hallucination: any positive rating Cape hallucinations items.
Cape depression: Cape depression frequency dimension.
CTQ score: CTQ total score.
Cognitive score: Z-score, expressed as T-score, of short version of the WAIS-III short form (digit symbol coding subtest, uneven items of the arithmetic subtest, uneven items of the block design subtest, every third item of the information subtest (Blyler, Gold, Iannone, & Buchanan, Reference Blyler, Gold, Iannone and Buchanan2000; Velthorst et al., Reference Velthorst, Levine, Henquet, de Haan, van Os, Myin-Germeys and Reichenberg2013; Wechsler, Reference Wechsler1997).
Cannabis use: use of once or more per week during the lifetime period of most frequent use.
Analyses
All analyses were performed using Stata, version 16 (StataCorp, 2019). p < 0.05 (2-tailed) was considered nominally statistically significant. Given that in each person contributed multiple observations so that observations were clustered within persons (NEMESIS-2), or that participants were clustered in families (EUGEI), the Stata cluster option was used to take into account intra-group correlations occasioned by clustering of observations within individuals (NEMESIS-2) or families (EUGEI). Models including PRS were adjusted for three principal components (NEMESIS-2) or 10 principal components (EUGEI). Analyses using the EUGEI sample were additionally adjusted for country and for group (control, sibling, patient) using two dummies for siblings status and patient status.
Given differences between delusions and hallucinations in their patterns of association with other variables (Bartels-Velthuis, van de Willige, Jenner, Wiersma, & van Os, Reference Bartels-Velthuis, van de Willige, Jenner, Wiersma and van Os2012; Escher, Romme, Buiks, Delespaul, & van Os, Reference Escher, Romme, Buiks, Delespaul and van Os2002; Smeets et al., Reference Smeets, Lataster, Dominguez, Hommes, Lieb, Wittchen and van Os2012), three psychosis phenotypes were examined as dependent variable in regression models: delusions and hallucinations (or: psychosis), hallucinations (with or without delusions) and delusions (with or without hallucinations).
Regression models were fitted to examine the hypothesis that the association between affective dysregulation and psychosis would be stronger if PRS-SZ was high. To test this hypothesis, interactions between affective dysregulation and PRS-SZ/CA were tested in models of psychosis phenotypes. Consistent with previous epidemiological analyses with PRS-SZ in this sample, PRS-SZ was examined as a dichotomous variable, using the 75th percentile as cut-off (hereafter: PRS75), with sensitivity analyses using a range of cut-offs (50, 60, 70 80 and 90% percentile cut-offs) (Guloksuz et al., Reference Guloksuz, Pries, Delespaul, Kenis, Luykx, Lin and van Os2019). In NEMESIS-2, 75% cut-offs of the entire population were used; in EUGEI, 75% percentile cut-offs of the control values were used.
Logistic regression models, taking into account clustering of observations within participants or families as described above, were applied to test the association between binary affective dysregulation and PRS75 with the three psychosis phenotypes. In testing interaction, additive models were chosen over multiplicative models prior to genetic data collection (EUGEI consortium meeting, 14 December 2013).
To test the joint effects of affective dysregulation and PRS, we entered the four states occasioned by the combination of binary affective dysregulation and binary PRS75 as independent variables (three dummy variables with no-risk state as the reference category), and psychosis phenotype as the dependent variable, in logistic regression models.
We tested for departure from additivity using the interaction contrast ratio, also called the relative excess risk due to interaction (RERI). The RERI is considered the standard measure for interaction on the additive scale in case-control studies (Knol & VanderWeele, Reference Knol and VanderWeele2012). The RERI was estimated as (ORaffective dysregulation&PRS75−ORaffective dysregulation−ORPRS75 + 1) (VanderWeele & Vansteelandt, Reference VanderWeele and Vansteelandt2014). A RERI greater than zero was defined as a positive deviation from additivity, and considered significant when the 95% confidence interval (CI) did not contain zero. Using the ORs derived from each model, the RERIs for each model were calculated using the delta method (Hosmer & Lemeshow, Reference Hosmer and Lemeshow1992).
Results
Distribution of demographic and risk variables are shown in Table 1 (NEMESIS-2) and Table 2 (EUGEI). In both NEMESIS and EUGEI, the terms making up the interactions in the models of psychosis outcomes were positively associated with each other (NEMESIS: PRS and affective dysregulation: p = 0.030; CA and affective dysregulation: p < 0.001; EUGEI: PRS and affective dysregulation: p = 0.025; CA and affective dysregulation: p < 0.001).
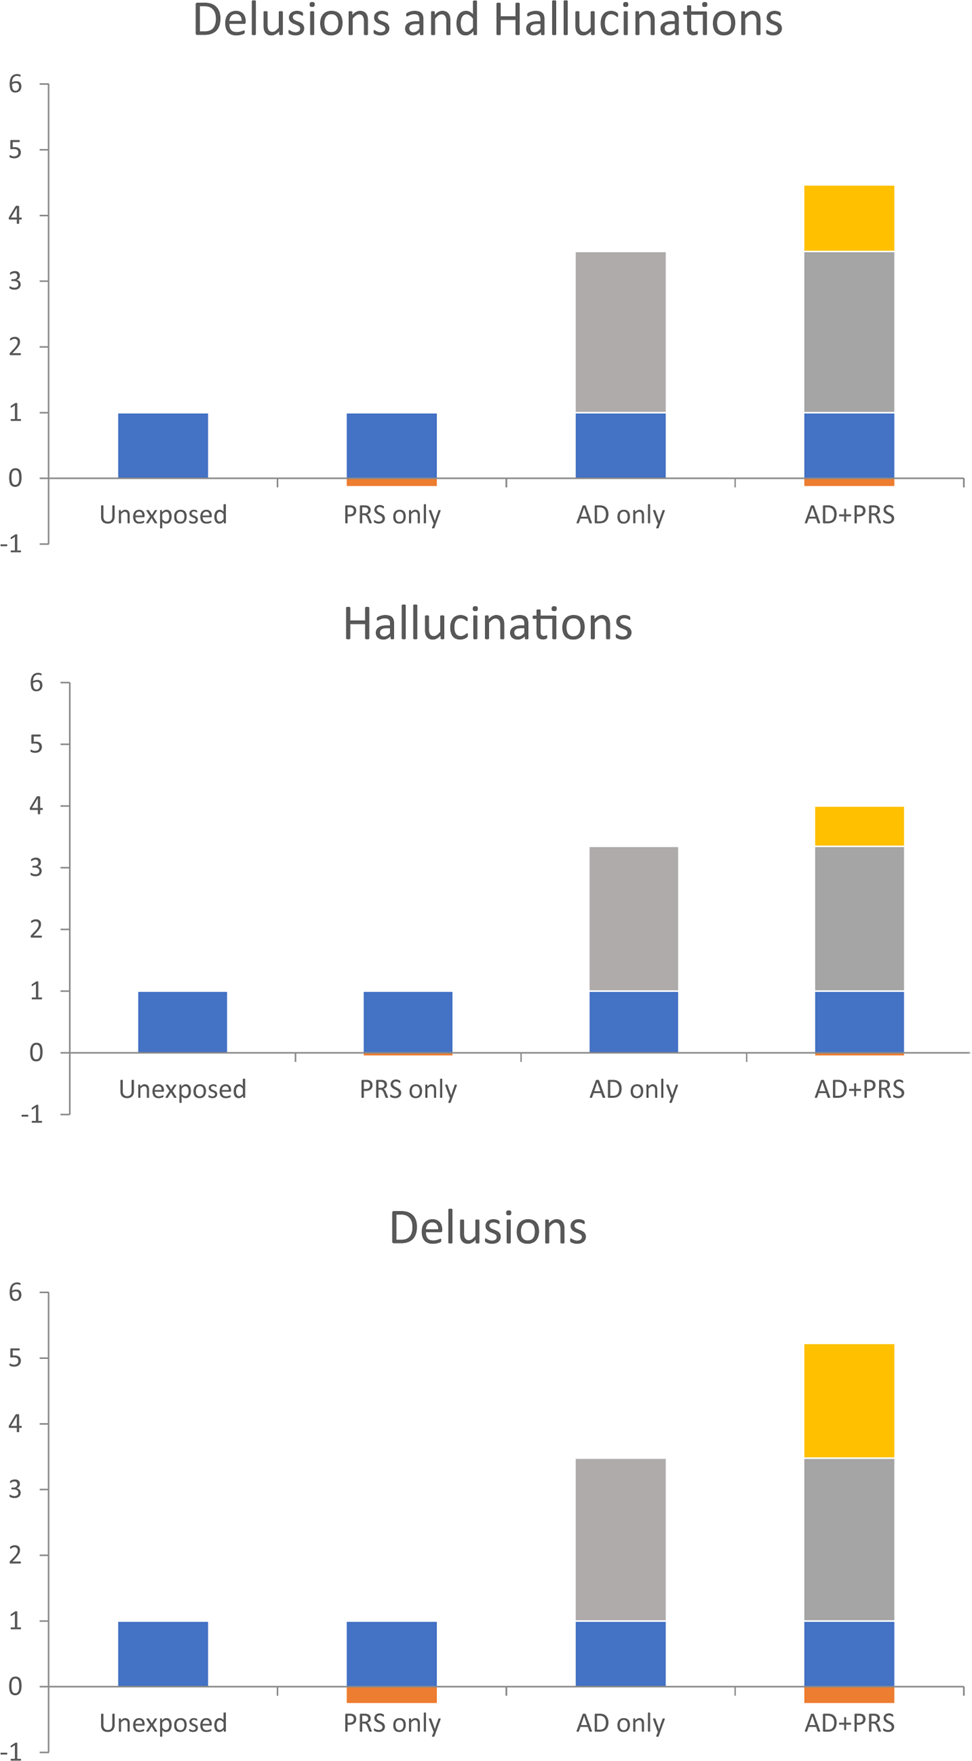
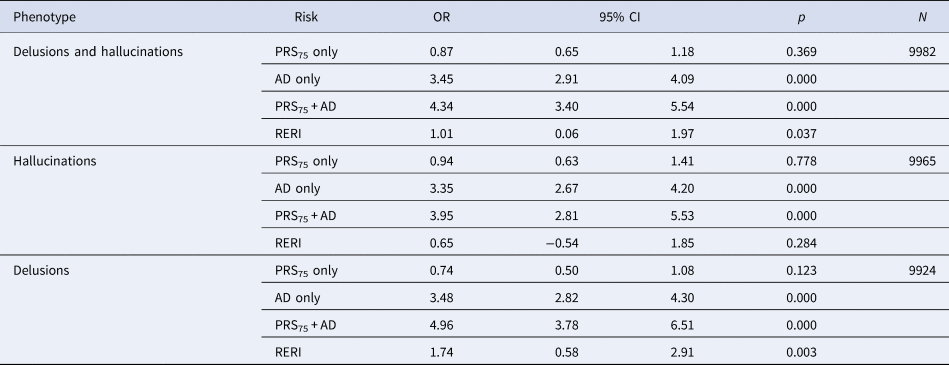
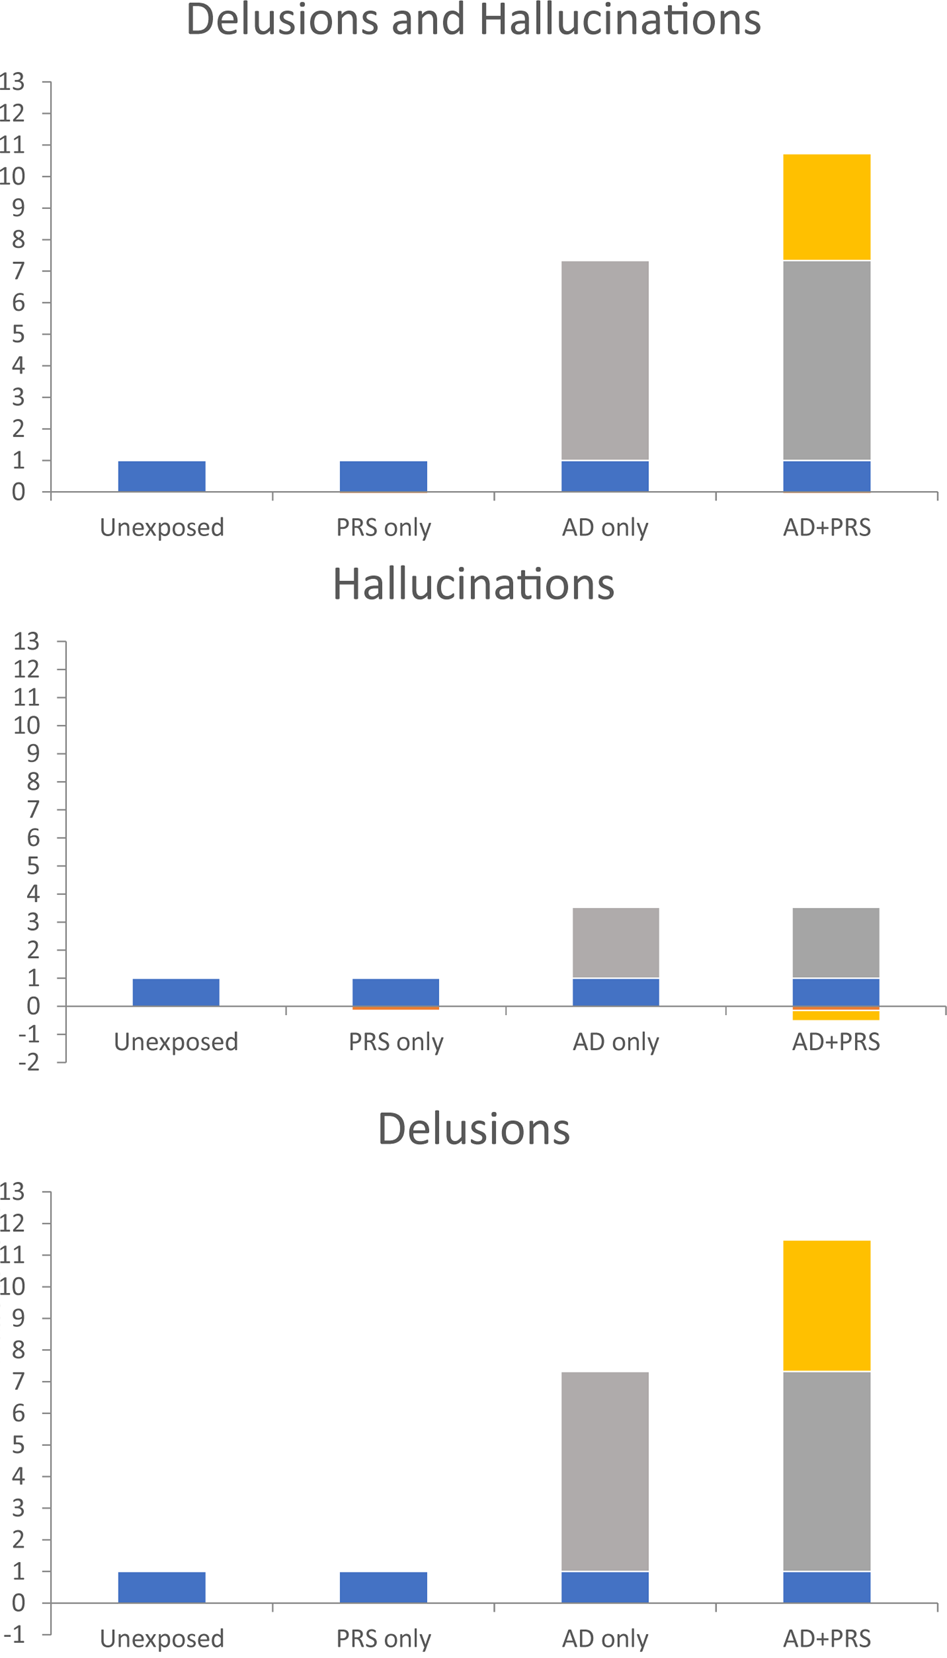
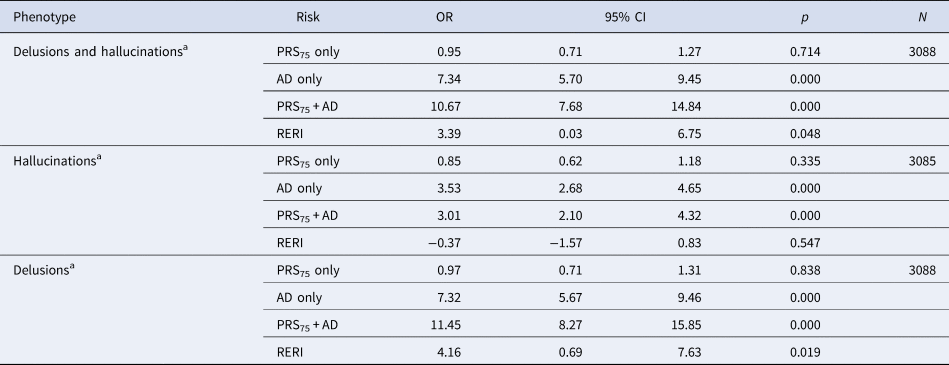
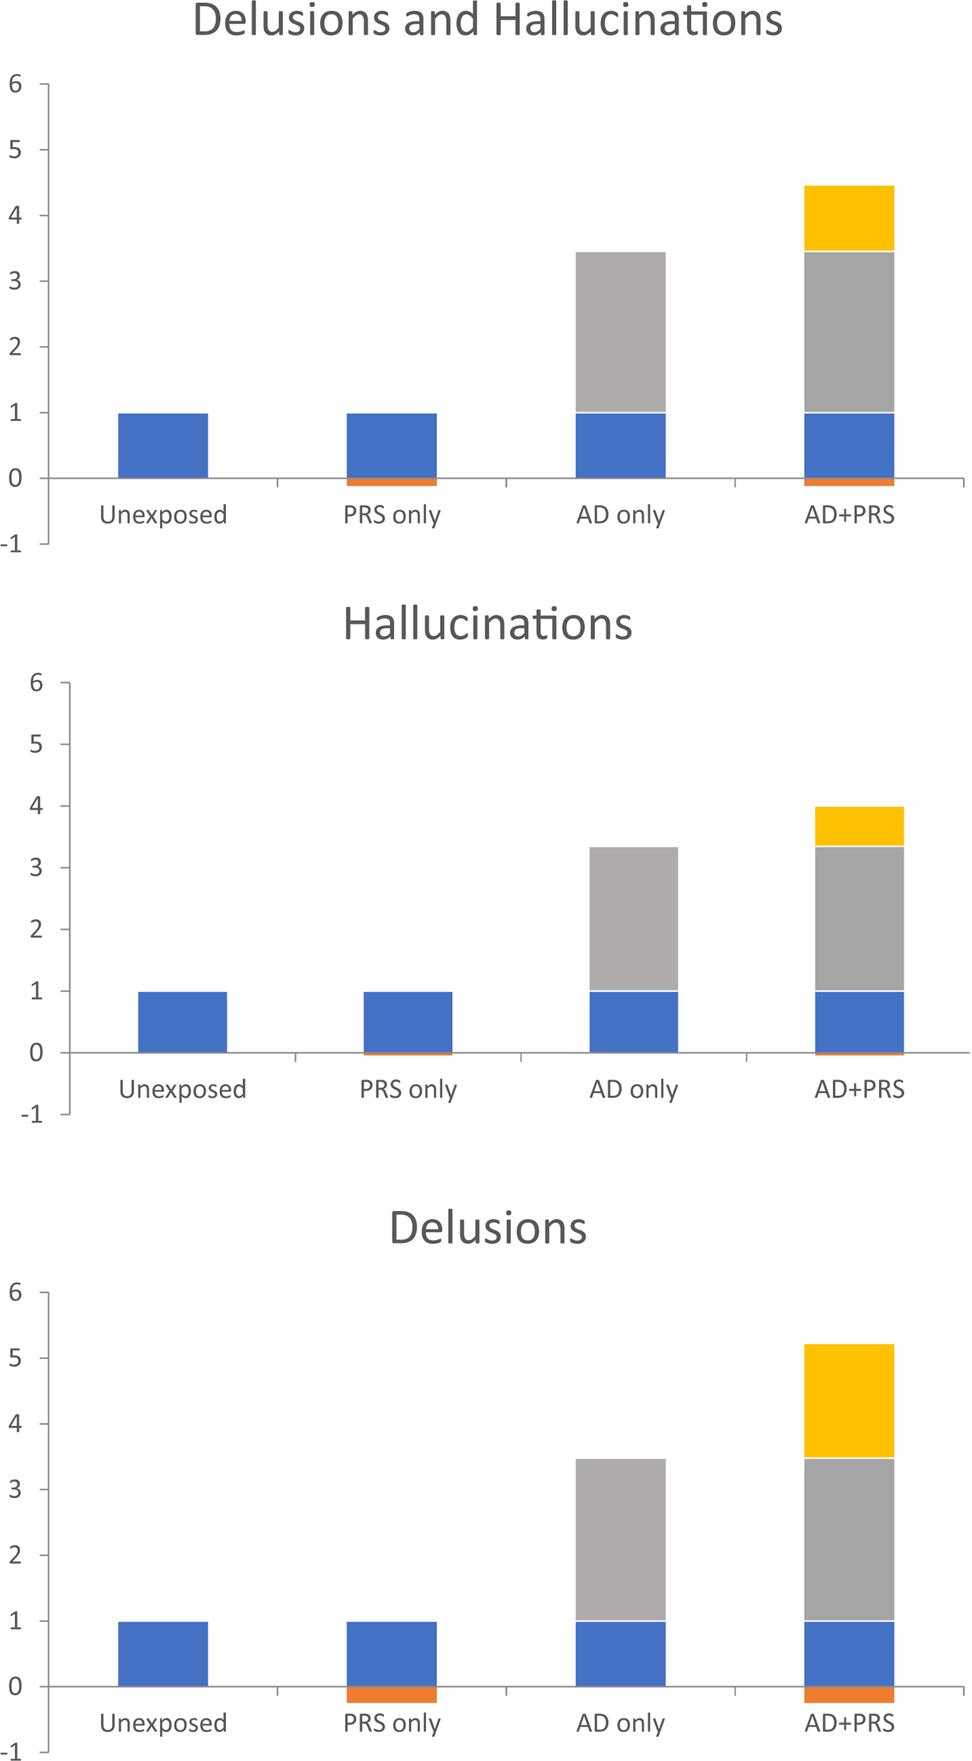
In NEMESIS-2, there was evidence that the association between affective dysregulation and psychosis phenotypes was moderated by PRS. This was apparent for the phenotype of delusions and hallucinations (RERI = 1.01; 95% CI 0.06–1.97), and for the phenotype of delusions (RERI = 1.74, 95% CI 0.58–2.91) but not for hallucinations (RERI = 0.65, 95% CI −0.54 to 1.85) (Table 3, Fig. 2). Similar results were apparent in the EUGEI sample (RERI delusions and hallucinations: 3.39, 95% CI 0.03–6.75; RERI delusions: 4.16, 95% CI 0.69–7.63; RERI hallucinations: −0.37, 95% CI −1.57 to 0.83) (Table 4, Fig. 3).
NEMESIS-2: additive interaction effects of affective dysregulation (AD) and polygenic risk score for schizophrenia (PRS; 75% cut-off) in models of psychosis phenotypes; RERI – relative excess risk due to interaction.
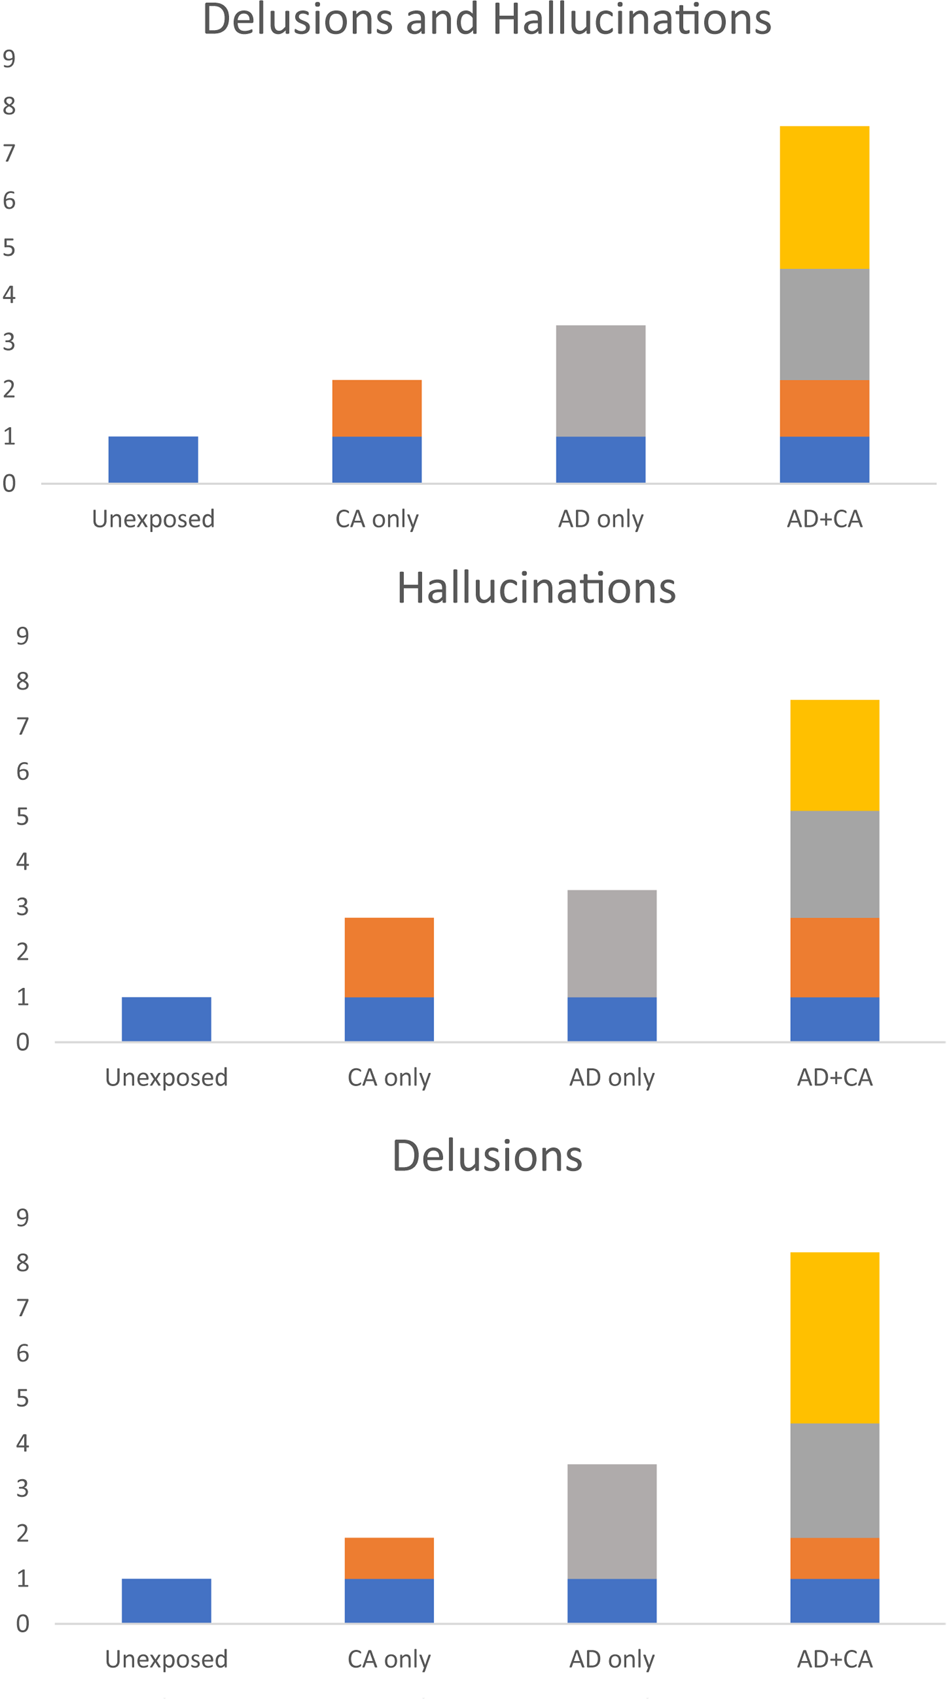
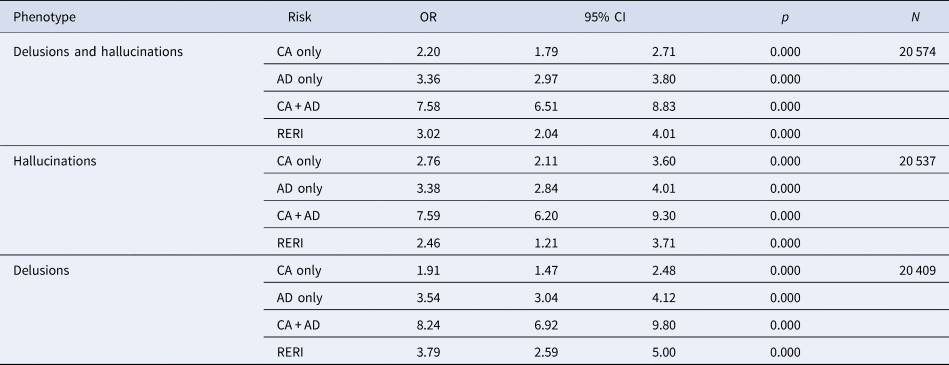
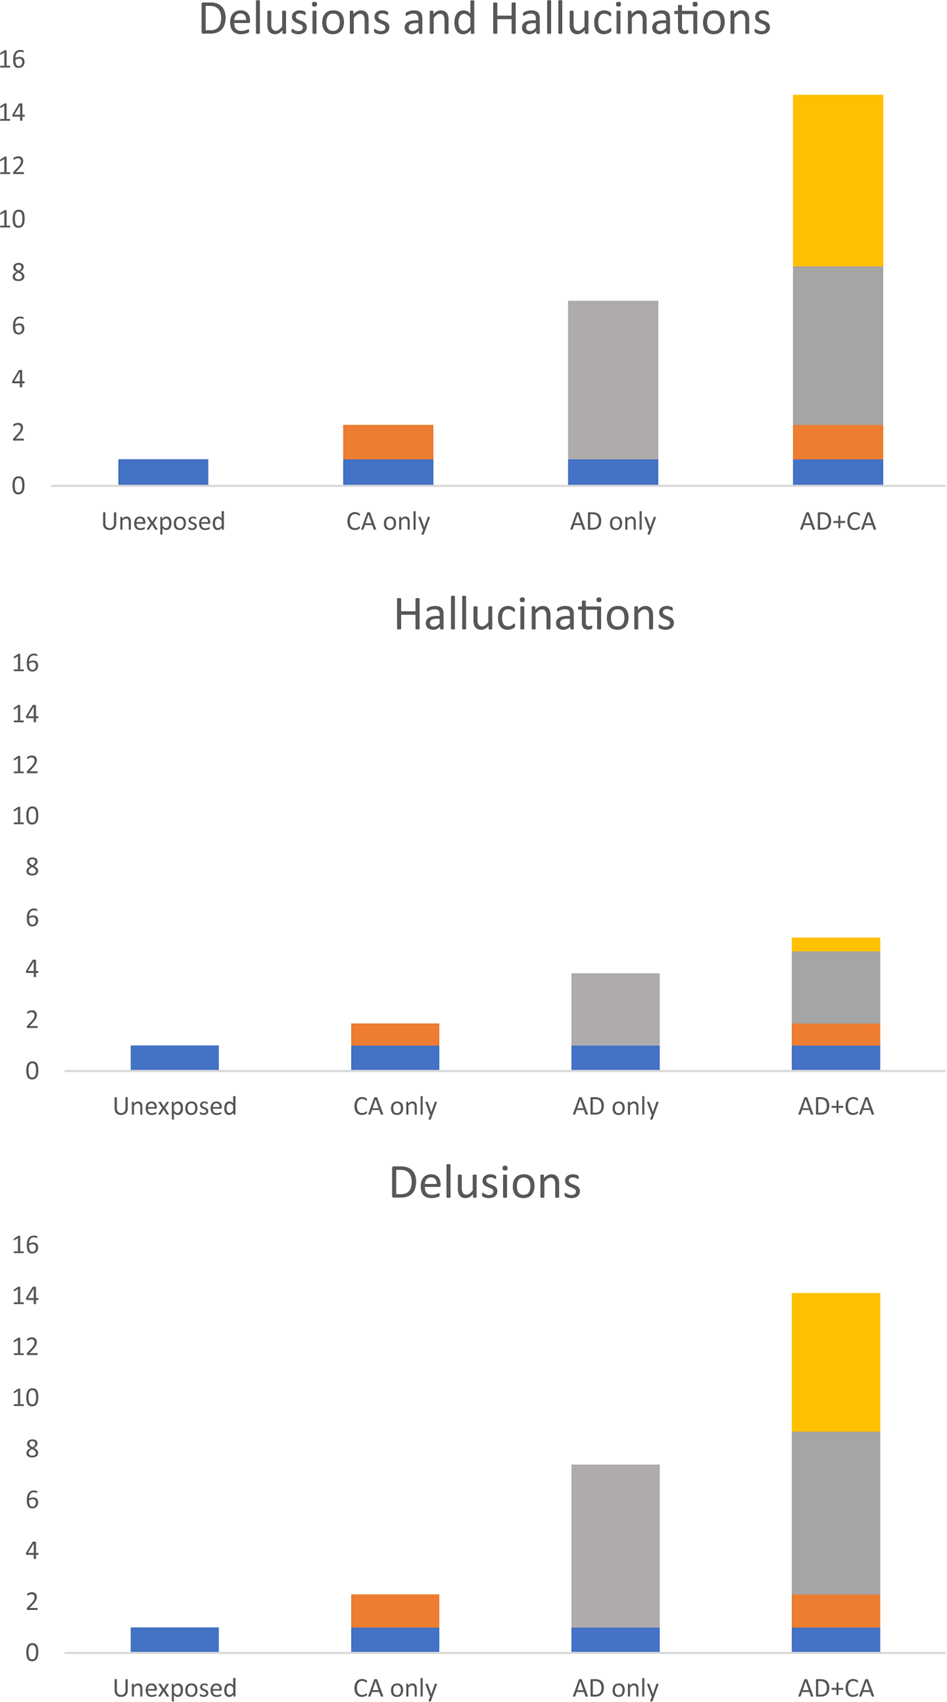
NEMESIS-2: additive interaction effects of affective dysregulation (AD) and childhood adversity (CA) in models of psychosis phenotypes; RERI – relative excess risk due to interaction.

NEMESIS-2: risk of psychosis admixture as a function of combinations of binary schizophrenia polygenic risk (75th percentile cut-off) and binary affective dysregulation
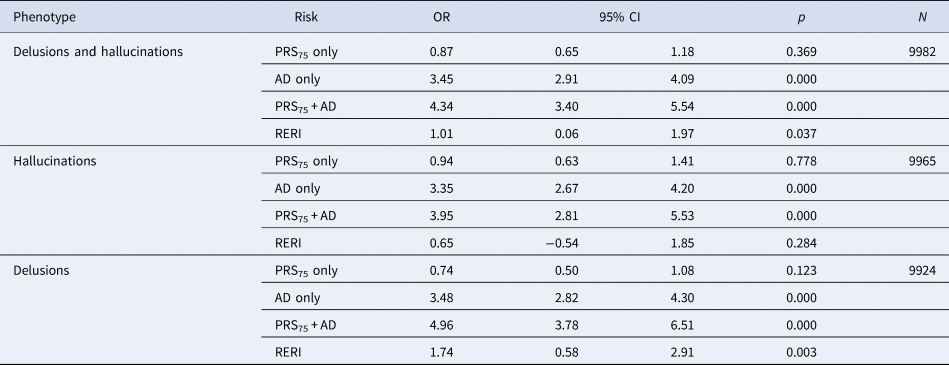
OR, odds ratio; 95% CI, 95% confidence interval; N, number of observations in analysis; PRS75, polygenic risk score 75th percentile cut-off; AD, affective dysregulation (at least one of the two CIDI 3.0 core symptoms of depressive episode); RERI, relative excess risk due to interaction.
NEMESIS-2: risk of psychosis admixture as a function of combinations of binary affective dysregulation and binary childhood adversity (80th percentile cut-of)
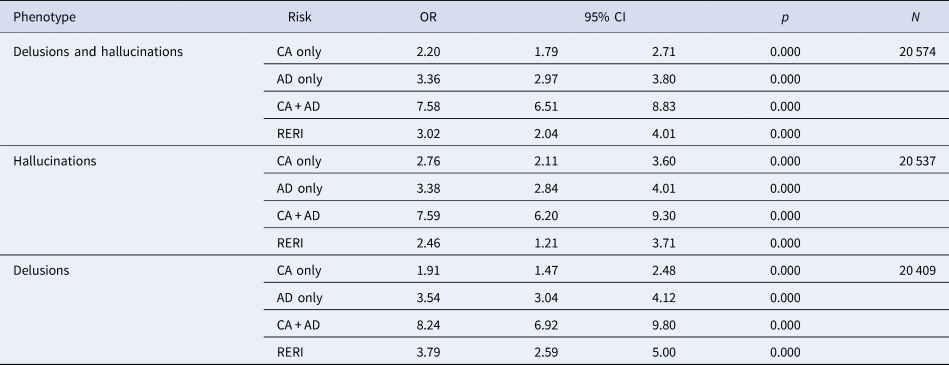
OR, odds ratio; 95% CI, 95% confidence interval; N, number of observations in analysis; CA, childhood adversity; AD, affective dysregulation (at least one of the two CIDI 3.0 core symptoms of depressive episode); RERI, relative excess risk due to interaction.
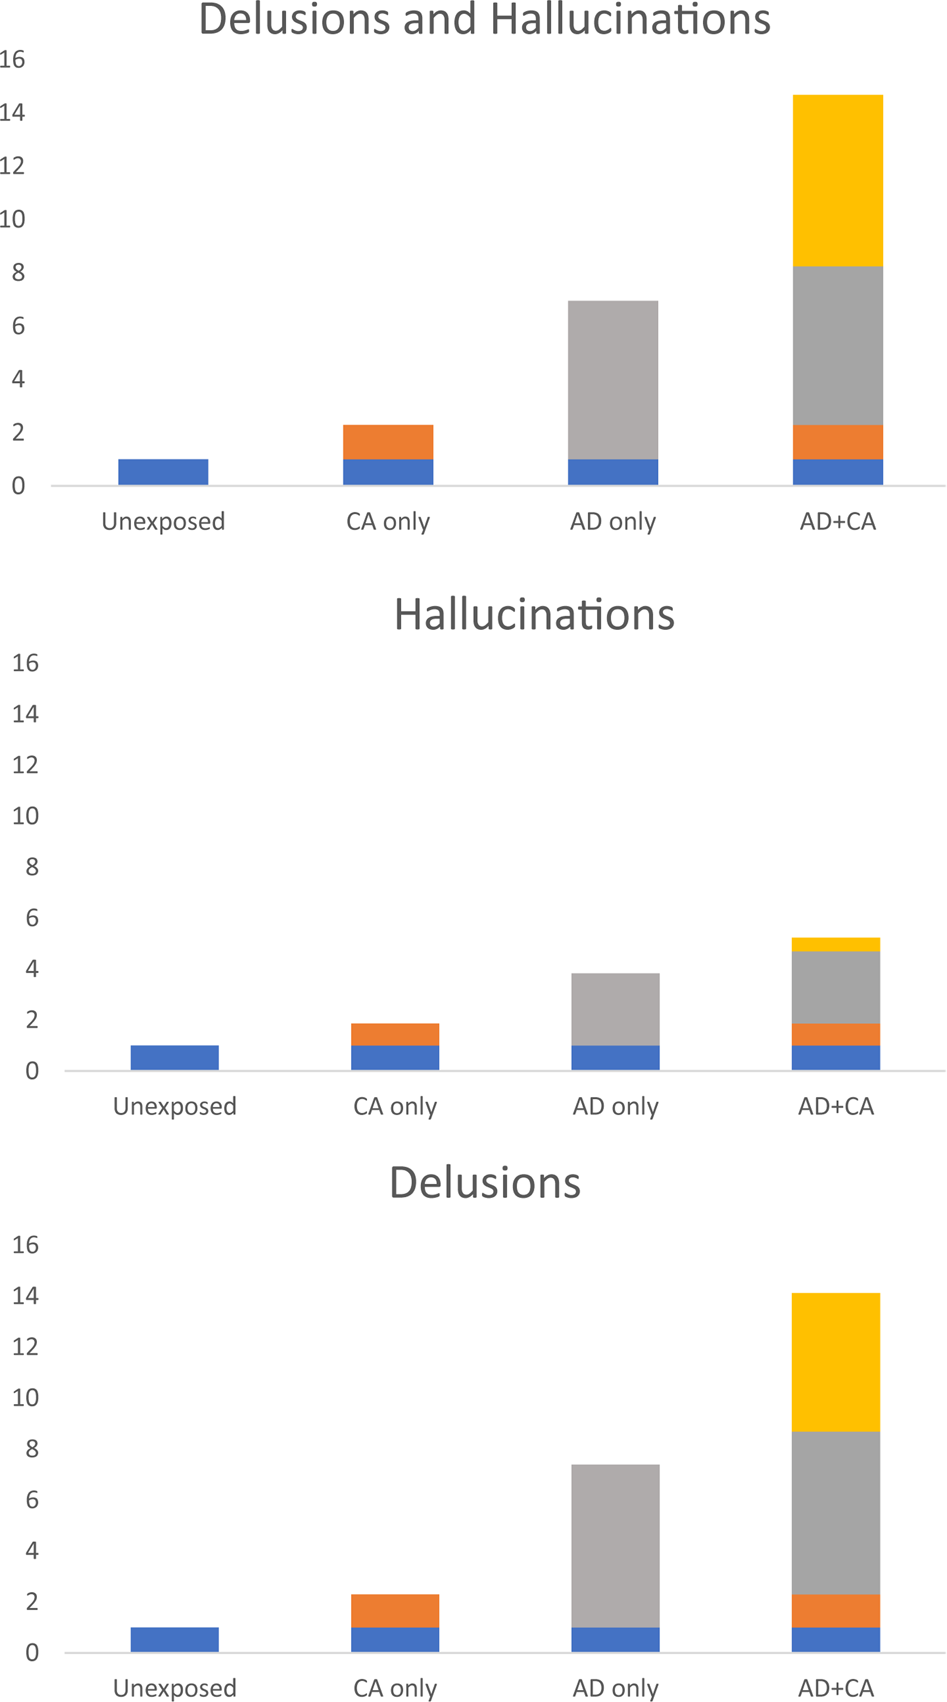
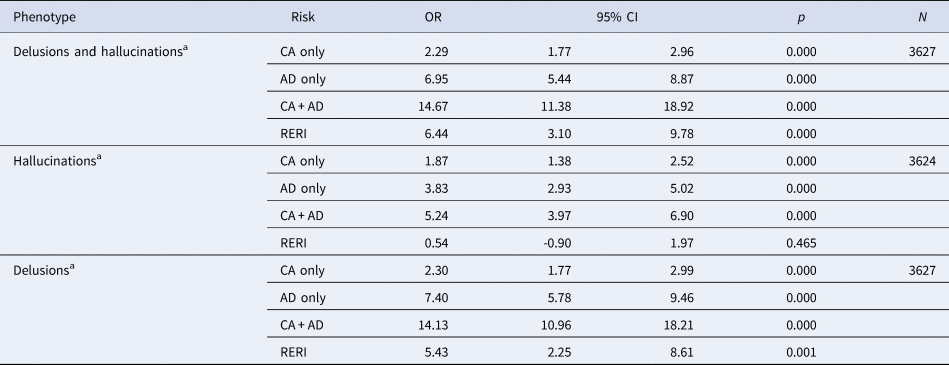
There was similar and stronger evidence that the association between affective dysregulation and psychosis phenotypes was moderated by CA. In NEMESIS-2, this was evident for all psychosis outcomes (RERI delusions and hallucinations: 3.02, 95% CI 2.04–4.01; RERI delusions: 3.79, 95% CI 2.59–5.00; RERI hallucinations: 2.46, 95% CI 1.21–3.71) (Table 5, Fig. 4). Similar results were apparent in EUGEI (RERI delusions and hallucinations: 6.44, 95% CI 3.10–9.78; RERI delusions: 5.43, 95% CI 2.25–8.61; RERI hallucinations: 0.54, 95% CI −0.90 to 1.97) (Table 6, Fig. 5).
EUGEI: additive interaction effects of affective dysregulation (AD; 80% cut-off) and polygenic risk score for schizophrenia (PRS; 75% cut-off) in models of psychosis phenotypes; RERI – relative excess risk due to interaction.
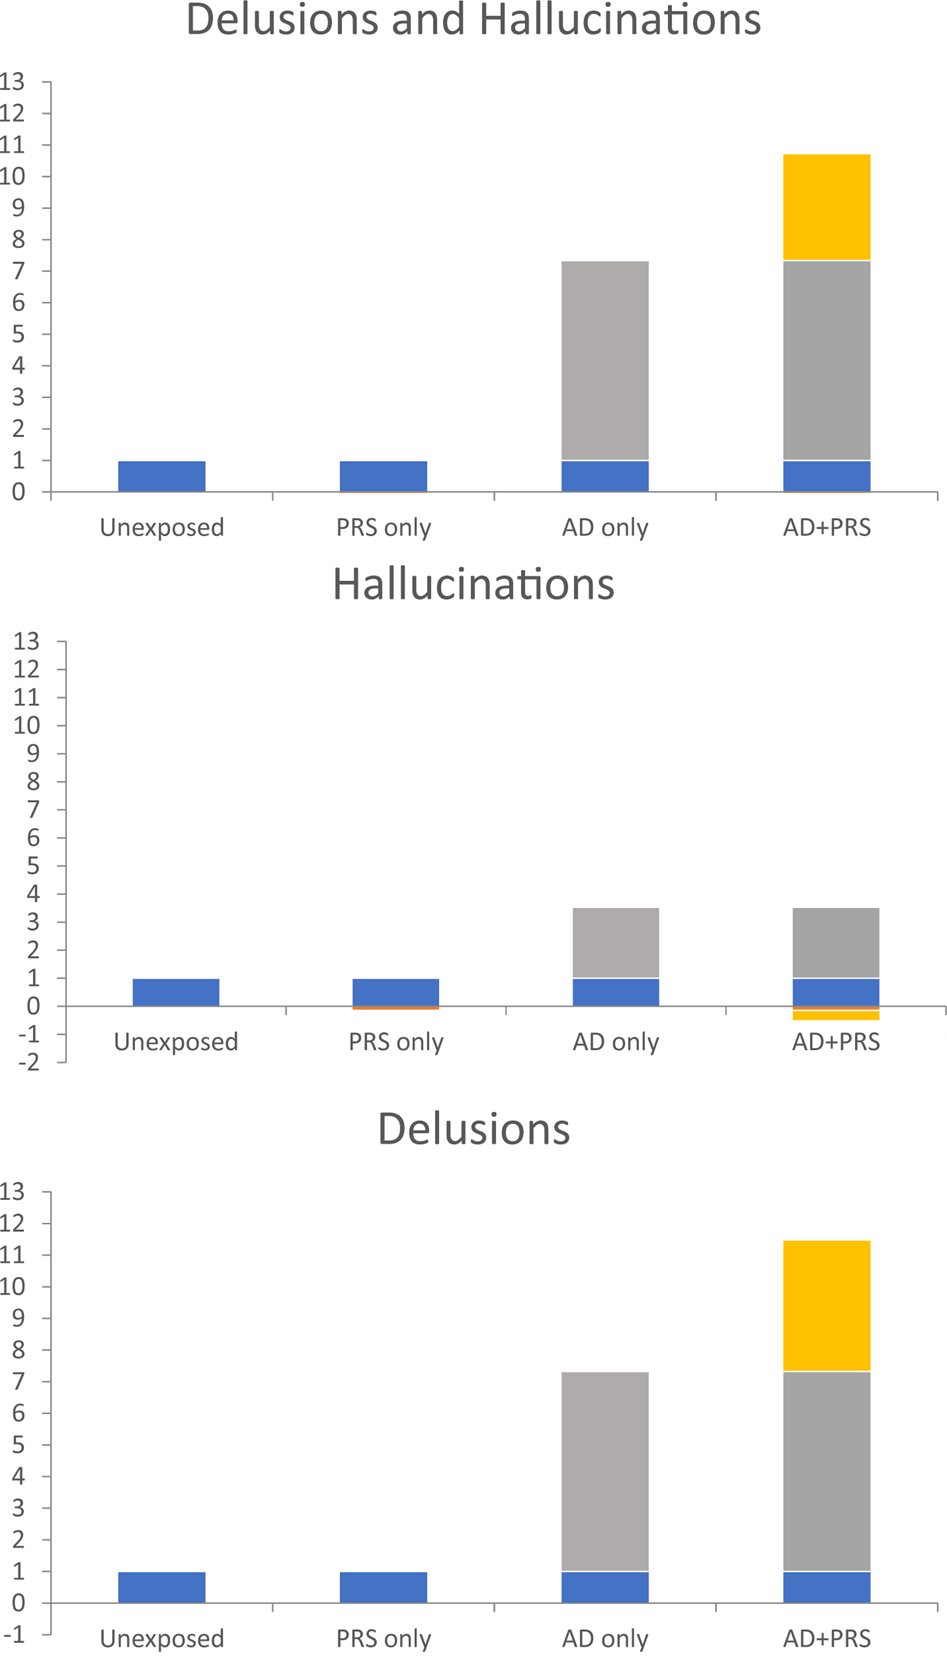
EUGEI: additive interaction effects of affective dysregulation (AD; 80th percentile cut-off) and childhood adversity (CA, 80th percentile cut-off) in models of psychosis phenotypes; RERI – relative excess risk due to interaction.
EUGEI: risk of psychosis admixture as a function of combinations of binary schizophrenia polygenic risk (75th percentile cut-off) and binary affective dysregulation (Cape depression 80th percentile)
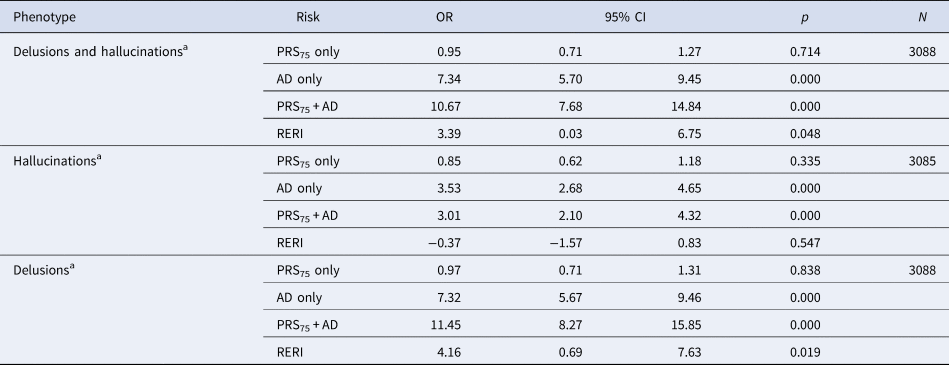
a Delusions and hallucinations: Cape positive dimension 80% control cut-off; Delusions: Cape delusions 80% control cut-off; Hallucinations: any rating of Cape hallucinations.
OR, odds ratio; 95% CI, 95% confidence interval; N, number of observations in analysis; PRS75, polygenic risk score 75th percentile cut-off; AD, affective dysregulation (Cape depression dimension 80% control cut-off); RERI, relative excess risk due to interaction.
EUGEI: risk of psychosis admixture as a function of combinations of binary affective dysregulation (Cape depression 80th percentile) and childhood adversity (80th percentile cut-off)
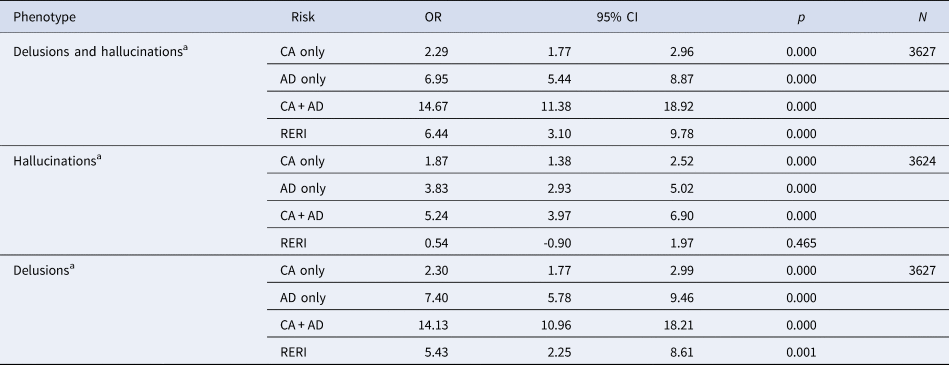
OR, odds ratio; 95% CI, 95% confidence interval; N, number of observations in analysis; CA, childhood adversity; AD, affective dysregulation (Cape depression dimension 80% control cut-off); RERI, relative excess risk due to interaction.
a Delusions and hallucinations: Cape positive dimension 80% control cut-off; Delusions: Cape delusions 80% control cut-off; Hallucinations: any rating of Cape hallucinations.
Sensitivity analyses showed results with binary PRS measures were consistent across the different cut-off values (online Supplementary Figs S6 and S7).
Discussion
Findings
We found, and replicated, that the association between PRS-SZ and CA on the one hand and psychosis outcomes on the other was contingent on the co-presence of affective dysregulation, which suggests that these risks may be mediated by an affective pathway, through which particularly delusional ideation may arise (Freeman et al., Reference Freeman, Dunn, Fowler, Bebbington, Kuipers, Emsley and Garety2013; Garety et al., Reference Garety, Freeman, Jolley, Dunn, Bebbington, Fowler and Dudley2005; Krabbendam & van Os, Reference Krabbendam and van Os2005; Upthegrove et al., Reference Upthegrove, Marwaha and Birchwood2017). These findings may help explain the non-specific, transdiagnostic nature of the risk associated with PRS-SZ and CA and the strong connections between affective dysregulation and psychosis across the spectrum of psychotic disorders and the expression of subthreshold psychotic experiences (Hafner et al., Reference Hafner, Maurer, Trendler, an der Heiden, Schmidt and Konnecke2005; Upthegrove et al., Reference Upthegrove, Marwaha and Birchwood2017; van Os & Reininghaus, Reference van Os and Reininghaus2016). The findings lend credence to the suggestion by Upthegrove and colleagues, that depression may be ‘more than comorbidity, and that increased effective therapeutic attention to mood symptoms will be needed to improve outcomes and to support prevention’ (Upthegrove et al., Reference Upthegrove, Marwaha and Birchwood2017). This suggestion concurs with a growing body of literature showing that psychosis arises as a result of worsening non-psychotic affective psychopathology (Guloksuz et al., Reference Guloksuz, van Nierop, Lieb, van Winkel, Wittchen and van Os2015, Reference Guloksuz, van Nierop, Bak, de Graaf, Ten Have, van Dorsselaer and van Os2016; van Rossum et al., Reference van Rossum, Dominguez, Lieb, Wittchen and van Os2011) and that the pathway from environmental risk to psychosis involves affective processes (Pries et al., Reference Pries, Guloksuz, Ten Have, de Graaf, van Dorsselaer, Gunther and van Os2018; Radhakrishnan et al., Reference Radhakrishnan, Guloksuz, Ten Have, de Graaf, van Dorsselaer, Gunther and van Os2019; Reininghaus et al., Reference Reininghaus, Gayer-Anderson, Valmaggia, Kempton, Calem, Onyejiaka and Morgan2016a, Reference Reininghaus, Kempton, Valmaggia, Craig, Garety, Onyejiaka and Morgan2016b). Recent research has confirmed that high rates of affective symptoms in early psychosis require focussed attention on specific therapeutic options for these (Wilson et al., Reference Wilson, Yung and Morrison2020). Potential therapeutic targets may be found in constructs that research suggest may lie at the interface of the dynamics between mood and psychosis such as emotion dysregulation (Liu, Chan, Chong, Subramaniam, & Mahendran, Reference Liu, Chan, Chong, Subramaniam and Mahendran2019), level of anticipatory pleasure for future experiences (Hallford & Sharma, Reference Hallford and Sharma2019) and cognitive styles shaping response to early symptoms of affective dysregulation (Rauschenberg et al., Reference Rauschenberg, Reininghaus, Ten Have, de Graaf, van Dorsselaer, Simons and van Os2020; Reininghaus et al., Reference Reininghaus, Rauschenberg, Ten Have, de Graaf, van Dorsselaer, Simons and van Os2019).
Affective dysregulation as a core feature of psychosis
Much of the focus of research in clinical psychosis syndromes is on the 30% of patients with a relatively unfavourable prognosis, captured under the diagnosis of ‘schizophrenia’, of which cognitive dysfunction is considered a core feature (Guloksuz & van Os, Reference Guloksuz and van Os2018; Perala et al., Reference Perala, Suvisaari, Saarni, Kuoppasalmi, Isometsa, Pirkola and Lonnqvist2007). However, like most measures of psychopathology, cognitive alterations are transdiagnostic (Millan et al., Reference Millan, Agid, Brune, Bullmore, Carter, Clayton and Young2012), and cognition in patients with schizophrenia is more strongly associated with polygenic risk that indexes cognitive traits in the general population than polygenic risk from mental disorders (Richards et al., Reference Wing, Cooper and Sartorius2020). In other words, lower cognitive ability, distributed in the general population, may predict poorer outcome across mental disorders, which is why it would feature – somewhat tautologically – relatively prominently in the 30% of patients in the psychosis spectrum presenting with the poorest prognosis. Traditionally, affective dysregulation has received much less attention in research on diagnostic categories like schizophrenia (Garety, Kuipers, Fowler, Freeman, & Bebbington, Reference Garety, Kuipers, Fowler, Freeman and Bebbington2001) even though it has a similar unfavourable effect on outcome (McGinty & Upthegrove, Reference McGinty and Upthegrove2020). Review of treatment guidelines indicates a dearth of approaches other than prescription of antidepressant medications (Donde, Vignaud, Poulet, Brunelin, & Haesebaert, Reference Donde, Vignaud, Poulet, Brunelin and Haesebaert2018). The current results concur with previous suggestions that affective dysregulation, in particular depression, may be a fundamental feature of psychosis rather than a comorbidity phenomenon (Upthegrove et al., Reference Upthegrove, Marwaha and Birchwood2017). Indeed, the findings suggest that psychosis spectrum may be best framed as an outcome of developmental vulnerability that can become associated with need for care through an affective pathway. Although this may not be the only pathway, a more formal acknowledgment of the role of affective dysregulation in psychosis would help to reposition diagnostic framing, treatment focus and research.
The findings also have implications for research, as the association between PRS-SZ and psychosis outcomes may be more productively investigated if stratified by evidence of affective dysregulation. Similarly, it is possible that other genetic influences may be more productively uncovered if analyses are stratified by other possible pathways, for example those involving cognitive and motivational factors, that research suggest may also moderate the impact of genetic risk on psychosis outcomes (Pries et al., Reference Pries, Guloksuz, Ten Have, de Graaf, van Dorsselaer, Gunther and van Os2018).
Delusions, hallucinations and differential mediation by affective dysregulation
The results suggest that if psychosis aetiology in part depends on an affective pathway, this may apply to delusional ideation more than to hallucinatory experiences, particularly as regards genetic aetiology. Main effects were observed for affective dysregulation and CA for all three psychosis outcomes, but not for PRS. In addition, evidence for CA mediation by affective dysregulation was evident for both delusions and hallucinations (although not replicated across both samples), whereas for PRS this was only evident for delusions. These findings suggest a degree of dissociation between genetic and non-genetic aetiological factors in the degree of mediation by affective dysregulation, showing as divergence in results for hallucinations and delusions. It has been suggested that hallucinations may represent the ‘primary’ experience of aberrant salience that some suggest may be associated with underlying biological mechanisms (Howes & Murray, Reference Howes and Murray2014). Delusional ideation may, to a degree, be secondary to hallucinatory experiences (Krabbendam et al., Reference Krabbendam, Myin-Germeys, Hanssen, Bijl, de Graaf, Vollebergh and van Os2004; Maher, Reference Maher2006), depending, amongst others, on the level of genetic and non-genetic-induced affective dysregulation (Howes & Murray, Reference Howes and Murray2014; Smeets et al., Reference Smeets, Lataster, Dominguez, Hommes, Lieb, Wittchen and van Os2012; Smeets, Lataster, Viechtbauer, & Delespaul, Reference Smeets, Lataster, Viechtbauer and Delespaul2015). This may explain why for PRS, in the absence of a main effect on psychosis outcomes, mediation by affective dysregulation was limited to delusions, given the role of emotional biases in the onset of secondary delusions. For CA, the main effect on all psychosis outcomes may either depend more on affective dysregulation, or depend on it in a different fashion, causing it to differ from the pattern of results seen for PRS. However, more work is necessary to verify to what degree the level of affective mediation of genetic aetiology in models of psychosis truly differs between delusions and hallucinations, and what the possible underlying mechanisms of this divergence may be.
It could also be argued that hallucinations are less prevalent than delusions, resulting in lower power to detect association and thus explaining the divergent findings. However, both in NEMESIS-2 as in EUGEI, the prevalence of delusions and hallucinations as defined for these analyses was approximately similar (NEMESIS-2: 6% and 5%, respectively; EUGEI: 25% and 20%, respectively). In addition, if lack of power was an issue, effect sizes for hallucinations might still be similar to those observed for delusions, which was not the case.
Methodological issues
Power was low for the analyses with PRS-SZ. The findings suggest that PRS-SZ effect sizes differ as a function of co-presence of affective dysregulation, but this effect was only significant for delusional ideation and effect sizes of PRS-SZ were low. Further replication is therefore required.
Our measure of affective dysregulation was limited to measures of depression. Arguably measures of mania and/or anxiety could have been included, or examined separately for similar interactive effects in the models presented here. Future analyses may address this issue.
Supplementary material
The supplementary material for this article can be found at https://doi.org/10.1017/S0033291720003748.
Financial support
NEMESIS-2 is conducted by the Netherlands Institute of Mental Health and Addiction (Trimbos Institute) in Utrecht. Financial support has been received from the Ministry of Health, Welfare and Sport, with supplementary support from the Netherlands Organization for Health Research and Development (ZonMw). This work was supported by the European Community's Seventh Framework Program under grant agreement No. HEALTH-F2-2009-241909 (Project EU-GEI). These funding sources had no further role in study design; in the collection, analysis and interpretation of data; in the writing of the report; or in the decision to submit the paper for publication. Bart PF Rutten was funded by a VIDI award number 91718336 from the Netherlands Scientific Organisation. Drs Guloksuz and van Os are supported by the Ophelia research project, ZonMw grant number: 636340001. Dr O'Donovan is supported by MRC programme grant (G08005009) and an MRC Centre grant (MR/L010305/1).
Conflict of interest
None.