INTRODUCTION
Phosphorus (P) is an essential mineral in pig nutrition and is one of the most expensive nutrients. However, most P in vegetable feedstuffs is in the phytate form, which is degraded only to a limited extent in the gastrointestinal tract of non-ruminant animals due to the lack of endogenous phytase (Cromwell Reference Cromwell1979; Jongbloed Reference Jongbloed1987).
Addition of exogenous phytase aims to improve P availability, thus reducing environmental pollution as well as the cost of the diet (Cromwell et al. Reference Cromwell, Coffey, Monegue and Randolph1995 a, Reference Cromwell, Coffey, Parker, Monegue and Randolphb). Phytase dose-related responses in pigs have been shown to vary among different categories of animal (i.e. gestating or lactating sows, growing–finishing pigs and piglets) (Kemme et al. Reference Kemme, Jongbloed, Mroz and Beynen1997), type of phytase (Matsui et al. Reference Matsui, Nakagawa, Tamura, Watanabe, Fujita, Nakajima and Yano2000), endogenous phytase present in the diet (Düngelhoef et al. Reference Düngelhoef, Rodehutscord, Spiekers and Pfeffer1994; Zimmermann et al. Reference Zimmermann, Lantzsch, Mosenthin, Biesalski and Drochner2003), Ca:P ratio (Brady et al. Reference Brady, Callan, Cowan, McGrane and O'Doherty2002) and P level supplied by the diet (Zimmermann et al. Reference Zimmermann, Lantzsch, Mosenthin, Shoner, Biesalski and Drochner2002). Therefore, dose-response studies analysing effects of exogenous phytase upon P metabolism would help to elucidate how this enzyme affects P utilization.
Mathematical models can be used as a tool to investigate P metabolism, providing interesting information regarding the effects of different factors (such as phytase addition) upon P flows between body compartments and on P excretion. Vitti et al. (Reference Vitti, Kebreab, Lopes, Abdalla, De Carvalhos, De Resende, Crompton and France2000) and Dias et al. (Reference Dias, Kebreab, Vitti, Roque, Bueno and France2006) proposed a kinetic model for growing small ruminants with four P compartments in the body: (1) gut lumen, (2) plasma, (3) bone and (4) soft tissue, allowing flows between these four pools and out of the system to be determined. The objective of the current study was to investigate P exchanges between bone, soft tissue and other body compartments of growing pigs in response to ingestion of a diet containing microbial phytase by applying the Vitti–Dias model.
MATERIALS AND METHODS
Experimental procedures
Animals and diets
The study was carried out under the approval of animal experimental protocols by the Animal Care Committee of the Centro de Energia Nuclear na Agricultura (CENA), Piracicaba, Brazil. Twelve castrated crossbred pigs (cross-breeding of Agpic male (Hampshire with Landrace×Large White) and Camborough female (Duroc Pic with Landrace Pic×Large White Pic)) with mean body weight (BW) of 32±1·6 kg were used.
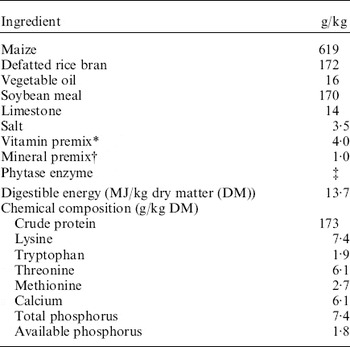
All animals were fed a standard mash diet (Table 1) composed of maize, defatted rice bran, vegetable oil, soybean meal, limestone, salt and vitamin and mineral premixes. The feed mixture contained 7·4 g total P/kg and 1·7 g available P/kg. Experimental treatments consisted of four rates of exogenous phytase addition to the basal diet, namely 253, 759, 1265 and 1748 phytase units (PU)/kg feed, and are denoted by Ph1, Ph2, Ph3 and Ph4, respectively. The phytase supplement (Allzyme Phytase; Alltech Biotechnology, Inc, Nicholasville, KY, USA) used was a fungal enzyme obtained from Aspergillus niger, with a declared activity of 2300 PU/g, which also contained cellulase, protease, xylanase and acid phosphatase activities. The phytase activity, with 1 PU representing the amount of enzyme that under standard conditions releases 1 μmol of inorganic P from sodium phytate in 1 min, was determined in a sodium-phytate substrate at 37°C and pH 5·5.
Diet composition

* Amount per kg of supplement: vitamin A, 1 500 000 UI; vitamin D3, 255 000 UI; vitamin E, 3000 mg; vitamin K3, 500 mg; thiamine, 2500 mg; riboflavin, 750 mg; pyridoxine, 250 mg; vitamin B12, 3 mg; calcium pantothenate, 3750 mg; niacin, 5500 mg; antioxidant, 6·25 g; growth promoter, 6·25 g; choline chloride, 75 g; selenium, 22·5 mg.
† Amount per kg of feed: Mn, 45 mg; Cu, 15 mg; Zn, 80 mg; Fe, 88 mg; I, 1 mg.
‡ Added at 110, 330, 550 and 760 mg/kg of feed in each of the experimental diets to reach levels of phytase activity of 253, 759, 1265 and 1748 PU/kg.
Experimental diets were formulated according to Rostagno et al. (Reference Rostagno, Albino, Donzele, Gomes, Ferreira, Oliveira and Lopes2000) and NRC (1998) (Table 1), and P availability in the basal diet was calculated according to Gomes et al. (Reference Gomes, Rostagno, Pereira, Costa and Lima1989). On the basis of the NRC (1998) approach, Rostagno et al. (Reference Rostagno, Albino, Donzele, Gomes, Ferreira, Oliveira and Lopes2000) adjusted animal requirements and feed composition data to specific Brazilian conditions. The feed composition tables of Rostagno et al. (Reference Rostagno, Albino, Donzele, Gomes, Ferreira, Oliveira and Lopes2000) include information on feedstuffs commonly used for pig feeding in Brazil, and pig nutrient requirements were calculated specifically taking into account particularities of pigs raised under Brazilian conditions, such as growth potential of Brazilian genotypes (considered as average genetic potential) and production in a hot tropical climate (mean annual temperatures between 20 and 25°C, with maximum temperatures of 30–39°C). These adjusted values were used in the present study. Similarly, P availability values are relative to Brazilian feed sources, in an attempt to obtain results more reflective of local conditions. In the case of P allowances, a basal diet with a low available P content was formulated to target maximum response to phytase addition (Qian et al. Reference Qian, Kornegay and Conner1996; Brady et al. Reference Brady, Callan, Cowan, McGrane and O'Doherty2002). As no inorganic P was incorporated into the mixed diet and the main source of P was rice bran (a feedstuff with a low P availability of 0·20 according to Rostagno et al. Reference Rostagno, Albino, Donzele, Gomes, Ferreira, Oliveira and Lopes2000), the amount of total P had to be higher than the recommended allowance in order to match animal requirements for P.
Balance trials and sample collection
A preliminary period of adaptation to diet in metabolism cages lasted for 10 days. After adaptation, a dose of 7·4 MBq of 32P was injected into the jugular vein at 07.00 h, prior to feeding the animals. Radioactive P (Na2H32PO4) was acquired from Instituto de Pesquisas Energéticas e Nucleares (IPEN), São Paulo, Brazil. During the sampling period, urine and faeces were quantitatively collected from each animal every day for 7 days before morning feed (at 07.00 h) to calculate P balance. A representative sample (100 g/kg total faecal output) of faeces from each animal was taken. Daily samples were pooled for each pig at the end of the 7-day collection period, and the composite sample was air-dried in a forced-air oven at 105°C and ground to pass through a 1 mm screen. Both ground faeces and urine samples were kept frozen (−4°C) until used for subsequent analyses.
Blood samples were withdrawn from the jugular vein at 5 min, 1, 2, 4 and 6 h after 32P dosing and, thereafter, every 24 h until the last sample was taken at 144 h. Specific radioactivity (SRA) was measured in plasma samples and the plasma SRA decay curve subsequently constructed. Animals were slaughtered on day 7 after 32P dosing, and samples from liver, kidney, muscle, heart and the third and fourth metatarsal bones were collected for further analysis.
Analysis of samples
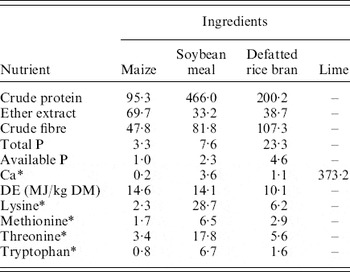
Feed samples were analysed following the methods of the Association of Official Analytical Chemists (AOAC 1995) (Table 2). Crude protein was determined by the Kjeldahl method and P content by colorimetry (Sarruge & Haag Reference Sarruge and Haag1974).
Chemical composition of ingredients (g/kg DM)

* Based on tables by Rostagno et al. (Reference Rostagno, Albino, Donzele, Gomes, Ferreira, Oliveira and Lopes2000).
For inorganic P determination, dry faecal samples were ashed at 500°C, and the residue dissolved in 5 ml of HCl. Afterwards P content was determined by a colorimetric method using vanadate–molybdate reagents (Sarruge & Haag Reference Sarruge and Haag1974). For radioactivity detection, ashes obtained from faeces were digested using 10 ml of H2SO4 (18 N) for 1 h; the remaining hydrolysate added to a scintillation vessel and topped up to 20 ml with distilled water prior to recording radioactivity.
Blood samples were centrifuged for plasma separation. Determination of inorganic P in plasma and urine (diluted 1:10) samples was undertaken by the colorimetric method of Fiske & Subbarow (Reference Fiske and Subbarow1925). For radioactivity detection, plasma and urine samples (0·5 ml) were diluted with 19·5 ml of deionized water in scintillation vessels.
Bones were cleaned and degreased; thereafter samples were acid-digested on a hot plate with the addition of an aqueous solution of nitric acid (500 ml HNO3/l) and then ashed in a muffle at 550°C. The ash residues were further digested using 10 ml of an aqueous solution of HCl (100 ml HCl/l) and filtered into a 25 ml volumetric flask through phosphorus-free filter paper, and inorganic P content was determined (Sarruge & Haag Reference Sarruge and Haag1974). Samples of the third and fourth metatarsal bones were analysed separately and average P concentration values were used subsequently for calculations. Inorganic P in each soft tissue sample (liver, kidney, muscle and heart) was determined by the method of Fiske & Subbarow (Reference Fiske and Subbarow1925). Samples of bone and soft tissue were digested in 18 N H2SO4 and the extract was transferred to counting vials for determination of associated radioactivity. Radioactivity in soft tissue (s 4) was calculated from the measured SRA and the relative proportion of each tissue.
The radioactivity counting was carried out by liquid scintillation spectrometry using Cerenkov radiation (Nascimento Filho & Lobão Reference Nascimento Filho and Lobão1977; IAEA 1979). Radioactivity counting was expressed in terms of SRA relative to the counting in a standard solution of 32P and calculated as

where cpmsample and cpmstd are scintillation counts per minute in the sample (per g or per ml of sample) and in the standard solution, respectively, and P sample is the total inorganic P content of the sample. The standard solution was prepared diluting 7·4 MBq of 32P in 1 litre of distilled water. Thereafter, 1 ml of this standard solution was transferred to a counting vial for radioactivity measurement.
Pool size of P in bone (Q 3) and soft tissue (Q 4) were calculated from P concentrations determined in each tissue and the relative proportion of each tissue in the body mass, assumed to be on average 60, 410, 20, 1·2 and 3 g/kg animal BW for bone, muscle, liver, kidney and heart, respectively. These values are based on measurements in pigs obtained from several experiments carried out at CENA over the last 15 years (data not published), and are well in agreement with values published in the literature (Anugwa et al. Reference Anugwa, Varel, Dickson, Pond and Krook1989; Kerr et al. Reference Kerr, McKeith and Easter1995; Dutra et al. Reference Dutra, Ferreira, Donzele, Euclydes, Tarouco and Cardoso2001; Vasupen et al. Reference Vasupen, Yuangklang, Wongsuthavas, Panyakaew, Mitchaothai and Beynen2008).
Mathematical procedures
The Vitti–Dias model
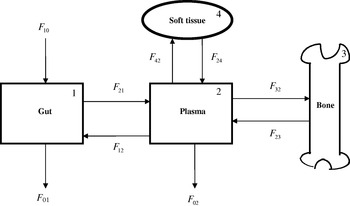
The Vitti–Dias model (Vitti et al. Reference Vitti, Kebreab, Lopes, Abdalla, De Carvalhos, De Resende, Crompton and France2000), as revised by Dias et al. (Reference Dias, Kebreab, Vitti, Roque, Bueno and France2006), was used to examine P metabolism in the current study. A detailed description of the model is given by Dias et al. (Reference Dias, Kebreab, Vitti, Roque, Bueno and France2006) and the relevant calculations are summarized below. The model is shown in Fig. 1. It contains four pools: (1) gut lumen, (2) plasma, (3) bone and (4) soft tissue, and the flows of P between pools and into and out of the system are shown as arrowed lines. Labelled P (32P) was administered intravenously as a single dose D at time zero, and SRA in faeces (s 1), bone (s 3) and soft tissue (s 4) were measured after 7 days. The value of s 2 at 7 days was obtained after fitting the negative exponential equation s 2=Ae−kt to the plasma SRA decay curve, where t (day) is the time after dosing 32P, A is the extrapolated value of s 2 at t=0 and k (/day) is the fractional rate of change of s 2 (i.e. (ds 2/dt)/s 2=−k). The scheme assumes no re-entry of isotopic P from external sources.
Schematic representation of the model of phosphorus metabolism in growing animals. Fij represents total P flow to pool i from j, F 10 denotes ingestion of P, F 01 excretion of P in faeces, F 02 excretion of P in urine.

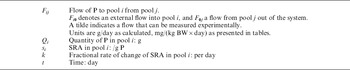
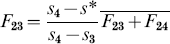
After 7 days, pool 1 (gut lumen) is assumed to be in complete steady state (i.e. isotopic and non-isotopic steady state) and pool 2 (plasma) in non-isotopic steady state. Algebraic solution to the model (Dias et al. Reference Dias, Kebreab, Vitti, Roque, Bueno and France2006; see Table 3 and Fig. 1 for principal mathematical notation) then gives:
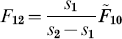





Symbols with a tilde represent flows determined experimentally ( ,
 ,
 for P intake and total P excreted in faeces and urine, respectively). Regarding the formula for F 23, a typographical error appears in Vitti et al. (Reference Vitti, Kebreab, Lopes, Abdalla, De Carvalhos, De Resende, Crompton and France2000) that has been corrected in Eqn (6).
Principal symbols used in the model

Q 3 and Q 4 are the pool size of P in bone and soft tissue, respectively, and both were determined at the end of the experimental period (7 days after dosing 32P).
SRA (SRA/g P) was measured in each pool i and represented by si. The average SRA in a joint pool (s*) formed by combining pools 3 and 4 was calculated as
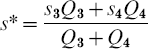
It is assumed that fractional rate of change of SRA has the same magnitude in plasma, bone and soft tissue pools after 7 days, giving:

Finally, the model is solved by computing Eqns (1)–(9).
Endogenous P in faeces (P e) was calculated according to Lofgreen & Kleiber (Reference Lofgreen and Kleiber1953) as  , where s 1 and s 2 are SRA in faeces and plasma, respectively, and
 is the total faecal P. Estimates of P retention in bone (P b) and soft tissue (P t) were obtained by measuring the difference between the flow from plasma to tissue (total accretion) and that from tissue to plasma (mobilization). Therefore, P b=F 32−F 23 and P t=F 42−F 24.
Supplementary calculations were performed. The amount of P apparently absorbed from the gut (P absorption, P aa) was calculated as the difference between total P absorption from (flow gut to plasma, F 21) and P secretion to (flow plasma to gut, F 12) the gut (i.e.  ). The amount of P truly absorbed (P ta) was estimated as
 . P balance was calculated as the difference between all inputs and outputs in the system:
 .
All model flows were weight-scaled and expressed in units of mg P/kg BW/day to take into account differences among animals in BW.
Statistical analyses
Experimental measurements of P intake and excretion, total P in bone and tissue, and P in plasma, as well as the flows calculated from the model, were analysed by analysis of variance (ANOVA) as a completely randomized design. The General Linear Model Procedure (SAS 1999) was used to perform one-way ANOVA with phytase level as the treatment effect in the statistical model. Correlation and regression analyses between variables (calculated flows) were carried out using PROC CORR and PROC REG procedures (SAS 1999), respectively.
RESULTS
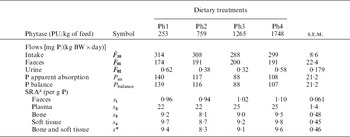
Total P intake ( , mg/(kg BW×day)) was similar for all treatments (Table 4). Phosphorus excreted in urine
 , was negligible for all treatments (Table 4). There were no significant differences among dietary treatments in total amount of P excreted in faeces
 , in apparent absorption of P from the gut to the plasma (P aa) or in P balance (Table 4). SRAs measured in faeces, plasma, bone and soft tissue were unaffected by the level of addition of phytase (Table 4).
Phosphorus intake and excretion, retained P and P absorbed from the diet and SRAs measured or calculated

The values shown are treatment means (three animals per treatment).
a s 2 and s* were calculated as described in the text.
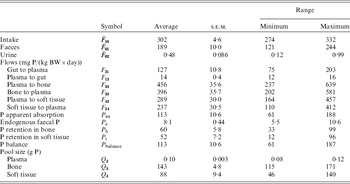
Owing to the lack of significant effects of phytase on P excretion, absorption and balance, data from each treatment were assembled in a single dataset, which was analysed to assess pair-wise relationships between flows estimated by the model. Average value, standard error and range of values for model outputs (flows of P calculated using the model) considering all the animals in the pooled dataset are presented in Table 5. Large ranges in the variables allow for robust correlation and regression analysis.
Average value, standard error and range of values for the model outputs (flows of P calculated using the model) and for calculated P balance measures (absorption and retention) considering all the animals in the pooled dataset

DISCUSSION
Phosphorus intake ( ; Table 4) was adequate (on average 10·5 g/day) for growing pigs of this weight (32 kg on average) according to NRC (1998) recommendations.
Effects of phytase addition on P utilization
Based on theoretical content of available P in the basal diet (1·7 mg/g feed), expected supply of available P from the basal diet without phytase would be 70–75 mg/(kg BW×day), noticeably lower than that observed in all the experimental treatments (with values for F 21 ranging between 101 and 154 mg/(kg BW×day)). This observation is in agreement with Cromwell et al. (Reference Cromwell, Coffey, Monegue and Randolph1995 a), who reported an increase of 15% in P availability from the basal level when 2000 units of the same phytase used in the present trial (Allzyme) were added/kg diet. However, in the present study, there were no differences between experimental treatments (levels of addition of microbial enzyme ranging from 253 to 1748 PU/kg of feed) in P digestibility or P utilization by growing pigs.
The capacity of microbial phytases to enhance P absorption and growth performance and to reduce P excretion in pigs offered diets with inadequate P levels is well documented (Cromwell et al. Reference Cromwell, Coffey, Parker, Monegue and Randolph1995 b; Zimmermann et al. Reference Zimmermann, Lantzsch, Mosenthin, Shoner, Biesalski and Drochner2002). However, the reported effects of phytase addition on the improvement of P digestibility have shown great variation (Johansen & Poulsen Reference Johansen and Poulsen2003), and inconsistent results from phytase studies in pigs can be due to source of phytase, and a number of feed and animal factors (Bedford & Schulze Reference Bedford and Schulze1998). The response to microbial phytases may be affected interactively by several factors, such as the particular phytase used, inclusion rate of phytase, dietary substrate levels, diet composition (ingredients with intrinsic phytases, Ca:P ratio, balance with other nutrients) and the physiological status of the animal (Johansen & Poulsen Reference Johansen and Poulsen2003; Selle & Ravindran Reference Selle and Ravindran2008).
Regarding the studies that report favourable response of pigs to phytase in terms of P digestibility, it is important to point out that these responses are rather variable. For instance, Cromwell et al. (Reference Cromwell, Coffey, Monegue and Randolph1995 a) observed that pigs fed maize and soybean meal supplemented with increasing levels of microbial phytase did not consistently decrease their P excretion in faeces. The current results support studies which have reported decreasing improvements in P digestibility with increasing levels of phytase (Young et al. Reference Young, Leunissen and Atkinson1993; Schindler et al. Reference Schindler, Lantzsch, Mosenthin, Biesalski, Drochner, Laplace, Février and Barbeau1997; Traylor et al. Reference Traylor, Cromwell, Lindemann and Knabe2001). Moreover, decreased P utilization related to an increase in available P has been observed by several researchers. Although not working with phytase, Ketaren et al. (Reference Ketaren, Batterham, White, Farrell and Milthorpe1993) reported a decrease in P utilization with higher available P intakes in grower–finisher pigs, suggesting a decrease in efficiency of P absorption. Rodehutscord et al. (Reference Rodehutscord, Faust and Pfeffer1999) suggested a possible adaptation of the pig to increased P supply that could explain the inhibition in net absorption of P.
In relation to the effects of diet composition on response to phytase, it is well known that Ca and P levels may affect the efficiency of phytase addition, but there is still a need to explore other aspects of the complex interaction between these minerals (Selle et al. Reference Selle, Cowieson and Ravindran2009) and phytase. The effect of phytase on P availability in maize and soybean meal diets may also be affected by the level of lysine in the diet (Brumm Reference Brumm2001).
Several studies have shown a significant effect of phytase level on P accumulation in bone and soft tissue (Young et al. Reference Young, Leunissen and Atkinson1993; Han et al. Reference Han, Yang, Zhou, Miller, Ku, Hogberg and Lei1997; Kies et al. Reference Kies, Gerrits, Schrama, Heetkamp, Van Der Linden, Zandstra and Verstegen2005). The animals used in the present study were growing pigs so it is expected that absorbed P is accreted in bone to facilitate animal growth. As P provision was not affected by level of phytase (there were no differences among treatments in absorbed P), no response in P accretion in bone could be expected with the different doses of phytase used in the present experiment.
Phosphorus absorption and excretion
Flows between gut and plasma and out of the system were calculated from P intake, P in faeces and urine and SRA determined in faeces and plasma.
Endogenous P in faeces (P e) was within the range of values reported by other authors (Jongbloed Reference Jongbloed1987; Ajakaiye et al. Reference Ajakaiye, Fan, Archbold, Hacker, Forsberg and Phillips2003). Endogenous faecal P was closely correlated with total faecal P, accounting for 0·04 g P e/g of total P in faeces  , based on the relationship:

Ajakaiye et al. (Reference Ajakaiye, Fan, Archbold, Hacker, Forsberg and Phillips2003) pointed out that endogenous P is important in partitioning whole-body P utilization and maintaining P homeostasis in the growing pig. Rodehutscord et al. (Reference Rodehutscord, Faust and Pfeffer1999) suggested that endogenous faecal P losses do not influence regulatory P excretion in growing pigs fed increasing P concentrations in the diet.
The mean value of P excreted in urine (0·42 mg/(kg BW×day)) was slightly higher than the value 0·35 mg/(kg BW×day) reported by Rodehutscord et al. (Reference Rodehutscord, Haverkamp and Pfeffer1998) as the daily inevitable urinary loss for growing pigs fed suboptimal P. Urinary P  accounted on average for 1·6 mg/g of P ingested, comparable to the value reported by Figueredo et al. (Reference Figueredo, Fialho, Vitti, Lopes, Silva Filho, Teixeira and Lima2000) studying pigs fed rolled rice meal with phytase added to the ration. Rodehutscord et al. (Reference Rodehutscord, Faust and Pfeffer1999) studied P excretion in pigs in response to increasing concentrations of P in the diet, and concluded that an adaptation to surplus P supply occurred initially in the gut, whereas a similar adaptation to an excess in P provision would be observed in the kidneys when P body stores were replete. Therefore the negligible P urinary excretion reported herein could indicate that body stores were not fully replete.
Apparent absorption of P (P aa) and faecal excretion of P  showed a significant and negative correlation as given by the equation (with P aa and
 in mg/(kg BW×day)):

A similar relationship was found between F 21 (flow of P from gut lumen to plasma) estimated by the model and faecal excretion of P (both in mg/(kg BW×day)):

In contrast, apparent absorption of P (P aa) was not correlated with P intake (r=0·35, P=0·262), owing to lack of a significant relationship between faecal excretion of P and P intake (r=0·091, P=0·779).
Model performance
The Vitti–Dias model was built on the assumption that all P was accounted for in the calculations, considering a single input through dietary intake and that no P disappeared from the system, except from defined exits (faeces and urine). The Vitti–Dias model is formulated using rate:state principles, is dependent on SRA measurements and has been demonstrated as applicable to both goats (Vitti et al. Reference Vitti, Kebreab, Lopes, Abdalla, De Carvalhos, De Resende, Crompton and France2000) and pigs (Schulin-Zeuthen et al. Reference Schulin-Zeuthen, Lopes, Kebreab, Vitti, Abdalla, Haddad, Crompton and France2005). There is no reported information on the actual values of exchanges of P between plasma and bone or soft tissue that could be compared with the present values obtained using isotopic tracer methodology and applying the Vitti–Dias model. Therefore, the model was refined in the current study and applied to study P metabolism of growing pigs, examining the relationships between some of the flows to appraise the feasibility and suitability of the values determined by the model. Flows derived from the model follow a similar trend to those reported by Dias et al. (Reference Dias, Kebreab, Vitti, Portilho, Louvandini and France2007) for sheep, although values were dissimilar as expected considering that animal species, diets and P supplies were different in both experiments.
Phosphorus retention in bone was positively correlated with flow of P from gut to plasma:

indicating that P retention in bone was highly determined by P provision from the gut (0·415 mg of P retained in bone per g of P transferred to plasma from the gut). There was also a significant relationship between P retention in bone and urinary P excretion:

Phosphorus retention in soft tissue was also significantly related to the flow of P from gut to plasma:

The efficiency of utilization of truly absorbed P (P ta) was estimated as P balance/P ta, showing that, on average, 0·937 (±0·0081) g of P truly absorbed were effectively accreted in the body of the pig (R 2=0·99, P<0·001), equivalent to 0·374 g of P accreted per g of P ingested. The partitioning of net total P retention between bone and soft tissue was estimated regressing P retained in bone against P balance (regression constrained to pass through the origin), giving:

indicating that in the current study approximately half of the P was retained in bone and half in soft tissue. Vitti et al. (Reference Vitti, Kebreab, Lopes, Abdalla, De Carvalhos, De Resende, Crompton and France2000), studying P metabolism in growing goats, reported greater amounts of P transferred from plasma to bone (F 32) for goats receiving a lower P level than for goats receiving higher levels, suggesting that metabolism in growing animals works essentially to provide P for bone formation even if the animal ingests a low level of this mineral element. The animals used in the present study were growing pigs, so it is expected that absorbed P be accreted in bone to facilitate animal growth.
There was a close relationship between the flow of P from plasma to bone (F 32) and P returned from bone to plasma (F 23):

As a result, only 0·14 g of total P flowing from plasma to bone is actually retained in osteoid tissue. Similarly, the uptake of P from the plasma to soft tissue was balanced to some extent by the mobilization of P from these tissues, so that net P retention in soft tissue was only 0·20 g/g total P flowing from plasma to these tissues. The relationship between flow of P from plasma to soft tissue (F 42) and P mobilized from soft tissue to plasma (F 24) was

Kemme et al. (Reference Kemme, Schlemmer, Mroz and Jongbloed2006) suggested that different phosphates (penta, tetra, tri, di and mono) could be formed in the upper gastrointestinal tract of pigs, and that inositol phosphates of different molecular weight may have different fates after being absorbed.
Based on P flows to and from bone and soft tissue, and pool size of these compartments (Table 5), turnover rates (accretion and mobilization rates) can be calculated, resulting in values of 0·102 and 0·104 per day for P accretion in bone and soft tissue, respectively, and of 0·088 and 0·086 per day for P resorption from bone and P mobilization from soft tissue, respectively. These values suggest that there is an important turnover of P in bone and soft tissue, and that both P resorption from bone and P mobilization from soft tissue contribute to maintain P levels in the central pool (plasma) for normal functions of the animal body (Fernández Reference Fernández1995). The current values are within the ranges (0·09–0·17/day in bone and 0·07–0·14/day in soft tissue) calculated from flows and pool sizes reported by Schulin-Zeuthen et al. (Reference Schulin-Zeuthen, Lopes, Kebreab, Vitti, Abdalla, Haddad, Crompton and France2005) for growing pigs fed increasing levels of P. However, values reported by Dias et al. (Reference Dias, Kebreab, Vitti, Portilho, Louvandini and France2007) for sheep fed increasing levels of P were slightly higher (0·13–0·21 per day), probably because ruminants excrete greater amounts of faecal endogenous P than non-ruminants. Unfortunately, the scientific literature provides scarce quantitative data of P turnover rates in bone and soft tissue, and thus a detailed comparison of P turnover in tissues from the current study with those obtained by others is not possible. This emphasizes the importance of the present work.
In conclusion, the model provides suitable representation of P flows between the central pool (plasma) and the gut (absorption of dietary P and resorption of endogenous P) and other peripheral compartments, resulting in appropriate estimates of P flows between compartments (comparable with values calculated from balance data) and allowing for quantification of the partition of available P between bone and soft tissue. The Vitti–Dias model may be considered a useful tool for studying the effect of different factors on P metabolism in pigs.