1. Introduction
Small-amplitude, symmetry-breaking magnetic field perturbations can profoundly impact plasma properties in both tokamaks and stellarators (Callen Reference Callen2011). Externally applied resonant magnetic perturbations (RMPs) form the basis of mitigation strategies for edge-localised modes in tokamaks and will play an important role in ITER (Evans et al. Reference Evans2004, Reference Evans, Moyer, Burrell, Fenstermacher, Joseph, Leonard, Osborne, Porter, Schaffer and Snyder2006, Reference Evans2008; Turnbull et al. Reference Turnbull, Ferraro, Izzo, Lazarus, Park, Cooper, Hirshman, Lao, Lanctot, Lazerson, Liu, Reiman and Turco2013). Unintended three-dimensional (3-D) magnetic field perturbations, known as error fields, can be introduced in a variety of ways, including through coil construction, alignment and positioning, 3-D structures in the vessel wall and blanket materials (Piron et al. Reference Piron, Kirk, Liu, Cunningham, Carr, Gowland, Katramados and Martin2020). Quasisymmetry in stellarators, for example, can be particularly sensitive to error fields which arise due to finite-build coils (Singh et al. Reference Singh, Kruger, Bader, Zhu, Hudson and Anderson2020), misalignment and other coil imperfections (Zhu et al. Reference Zhu, Gates, Hudson, Liu, Xu, Shimizu and Okamura2019, Reference Zhu, Hudson, Lazerson, Song and Wan2018; Imbert-Gerard, Paul & Wright Reference Imbert-Gerard, Paul and Wright2020).
A variety of equilibrium and time-dependent approaches for modelling plasmas in the presence of externally applied, symmetry-breaking magnetic fields have been explored. These include linear (Liu et al. Reference Liu, Bondeson, Fransson, Lennartson and Breitholtz2000; Ferraro et al. Reference Ferraro, Evans, Lao, Moyer, Nazikian, Orlov, Shafer, Unterberg, Wade and Wingen2013; Wingen et al. Reference Wingen, Ferraro, Shafer, Unterberg, Canik, Evans, Hillis, Hirshman, Seal, Snyder and Sontag2015) or perturbative methods (Nührenberg & Boozer Reference Nührenberg and Boozer2003; Boozer & Nührenberg Reference Boozer and Nührenberg2006; Park, Boozer & Glasser Reference Park, Boozer and Glasser2007; Park & Logan Reference Park and Logan2017), as well as nonlinear approaches (Izzo & Joseph Reference Izzo and Joseph2008; Hudson et al. Reference Hudson, Dewar, Dennis, Hole, McGann, von Nessi and Lazerson2012; Orain et al. Reference Orain, Bécoulet, Morales, Huijsmans, Dif-Pradalier, Hoelzl, Garbet, Pamela, Nardon, Passeron, Latu, Fil and Cahyna2014; Suzuki Reference Suzuki2017). For detailed discussions see Turnbull (Reference Turnbull2012); Turnbull et al. (Reference Turnbull, Ferraro, Izzo, Lazarus, Park, Cooper, Hirshman, Lao, Lanctot, Lazerson, Liu, Reiman and Turco2013) and Reiman et al. (Reference Reiman, Ferraro, Turnbull, Park, Cerfon, Evans, Lanctot, Lazarus, Liu, McFadden, Monticello and Suzuki2015) and references therein.
It has been argued (Turnbull Reference Turnbull2012) that linear and perturbative methods are insufficient to completely model the effect of symmetry-breaking magnetic field perturbations, which induces both an ideal and a non-ideal response in the plasma. Even in a linear ideal magnetohydrodynamic (MHD) model, these perturbations can change the shape of the plasma and, consequently, can qualitatively modify MHD stability boundaries (Hegna Reference Hegna2014). Perturbative methods, particularly those which seek to identify nearby ‘perturbed equilibria’, do not explicitly account for dynamical accessibility so there is no guarantee that these states will (or even can) be reached by a dynamically evolving plasma (Turnbull Reference Turnbull2012).
Presently, there exist few numerical tools capable of modelling – at least, in principle – both nonlinear and non-ideal effects due to externally applied, symmetry-breaking magnetic field perturbations in realistic toroidal geometries. Among these are extended-MHD codes such as M3D-C$^{1}$ (Jardin et al. Reference Jardin, Ferraro, Breslau and Chen2012), NIMROD (Sovinec et al. Reference Sovinec, Gianakon, Held, Kruger and Schnack2003) and JOREK (Hoelzl et al. Reference Hoelzl2021), and MHD equilibrium codes such as the Stepped Pressure Equilibrium Code (SPEC) (Hudson et al. Reference Hudson, Dewar, Dennis, Hole, McGann, von Nessi and Lazerson2012), HINT2 (Suzuki et al. Reference Suzuki, Nakajima, Watanabe, Nakamura and Hayashi2006), PIES (Reiman & Greenside Reference Reiman and Greenside1986) and SIESTA (Hirshman, Sanchez & Cook Reference Hirshman, Sanchez and Cook2011), which do not assume continuously nested flux surfaces. Unlike extended-MHD codes, most MHD equilibrium codes do not explicitly calculate the time-dependent dynamics associated with the evolution of the plasma (a notable exception being HINT2 which obtains equilibria as the long-time solution of a reduced time-evolution model Park et al. Reference Park, Monticello, Strauss and Manickam1986). Instead, a time-independent state, consistent with the physics assumptions of each code's underlying reduced model, is returned. In contrast to extended-MHD codes, this means that most equilibrium codes are not guaranteed to produce a solution that closely approximates the actual plasma evolution, i.e. a dynamically accessible state. However, when they do, non-ideal equilibrium codes can be particularly useful since they are much faster and less computationally expensive than extended-MHD codes.
In this work we are interested in examining the conditions under which SPEC (Hudson et al. Reference Hudson, Dewar, Dennis, Hole, McGann, von Nessi and Lazerson2012) recovers the same nonlinear, non-ideal plasma response to externally applied symmetry-breaking magnetic field perturbations as an extended-MHD model. This is determined by comparing SPEC solutions with nonlinear simulations with the extended-MHD code, M3D-C$^{1}$ . SPEC is based on the Multi-Region Relaxed MHD (MRxMHD) physics model (Hole, Hudson & Dewar Reference Hole, Hudson and Dewar2007) and involves partitioning the plasma into a finite number of volumes (denoted by $N_{\rm vol}$
 ) across which the pressure is constant so that the magnetic field is force free in each volume. Importantly, while SPEC has several modes of operation, only one of these is based on the MRxMHD model; namely, where the magnetic helicity in each volume is held fixed during the solution procedure. In Cartesian slab geometry it has been shown that, when $N_{\rm vol}$
 is very large, SPEC produces magnetic islands that are consistent with saturated tearing mode islands obtained from solving a time-dependent resistive MHD model (Loizu et al. Reference Loizu, Huang, Hudson, Baillod, Kumar and Qu2020). Also, in Cartesian slab geometry, it was recently shown (Huang et al. Reference Huang, Hudson, Loizu, Zhou and Bhattacharjee2021) that SPEC can recover the expected response of the Hahm–Kulsrud forced reconnection problem (Hahm & Kulsrud Reference Hahm and Kulsrud1985) in the limit $N_{\rm vol}\gg 1$
 .
For actual and experimentally relevant use cases, however, SPEC calculations are performed with only a small number of volumes. For example, a recent application of SPEC to model current crashes in the Wendelstein 7-X stellarator used five volumes (Aleynikova et al. Reference Aleynikova, Hudson, Helander, Kumar, Geiger, Hirsch, Loizu, Nührenberg, Rahbarnia and Qu2021). In part, this is due to present limitations in code performance (with respect to both speed and convergence) in realistic geometries. More generally, however, since the ideal MHD model is well established and there exist robust and efficient ideal MHD equilibrium solvers, e.g. VMEC (Hirshman & Whitson Reference Hirshman and Whitson1983), the utility of MRxMHD is not in the $N_{\rm vol}\gg 1$ limit, but rather when $N_{\rm vol}$
 is relatively small. The veracity of the underlying physics model in this regime remains largely untested and, therefore, motivates this work.
An important consideration when applying the MRxMHD model is deciding how to choose $N_{\rm vol}$ . In the MRxMHD model, KAM theory (Kolmogorov Reference Kolmogorov1954; Möser Reference Möser1962; Arnold Reference Arnold1963) is invoked to justify the existence of the interfaces that separate adjacent plasma volumes, in the absence of axisymmetry. This, in turn, constrains but does not necessarily specify $N_{\rm vol}$
 , leaving some freedom to choose $N_{\rm vol}$
 , particularly in the small volume and/or weakly non-axisymmetric limit. As far as we are aware, there is currently no standardised approach to selecting $N_{\rm vol}$
 in these cases. In § 3 we discuss in greater detail some considerations that affect the choice of $N_{\rm vol}$
 for this work. We find that the normalised toroidal flux in the volume containing the resonant surface of interest determines the key physics properties of interest in the SPEC solution (e.g. magnetic island width). Thus, for the purposes of the present study we focus on the dependence of solutions on toroidal flux which, together with $N_{\rm vol}$
 , is one of several input parameters that need to be specified. As a consequence, for tractability we consider a single choice of $N_{\rm vol}=5$
 since it is the same as that which was recently used by Aleynikova et al. (Reference Aleynikova, Hudson, Helander, Kumar, Geiger, Hirsch, Loizu, Nührenberg, Rahbarnia and Qu2021).
Our paper is subsequently organised as follows. In § 2 we present the equilibrium profiles used for this study and characterise the linear stability properties. In § 3 we discuss discretisation of the equilibrium profiles and the SPEC workflow for experimentally relevant use cases. In § 4 we describe how externally applied symmetry-breaking magnetic field perturbations are represented in SPEC and M3D-C$^{1}$ . In § 5 we present parameter scans and compare SPEC solutions with M3D-C$^{1}$
 simulations of the nonlinear, non-ideal plasma response to $(m=2,n=1)$
 RMP fields. Finally, discussion and conclusions are presented in § 6.
2. Characterisation of equilibrium properties
In this work we consider a circular cross-section tokamak that is modelled by a periodic cylinder with radius $a=1\ \text {m}$ and axial period $2{\rm \pi} R_0$
 where $R_0=10\ \text {m}$
 is the analogue of the major radius in toroidal geometry. This approximation is valid in the large aspect ratio limit and has the advantage of eliminating poloidal mode coupling. As will be seen in § 4, the latter allows us to prescribe an RMP field with a single poloidal and toroidal mode number ($m$
 and $n$
 , respectively) in the M3D-C$^{1}$
 model. The equilibrium safety factor and pressure profiles are given by


respectively, where $x=r/a$ is a normalised radial coordinate, $q_0=1.3$
 and $p_0=10^{4}\ \text {Pa}$
 are the values of $q$
 and $p$
 at the magnetic axis and $q_a=4$
 is the value of $q$
 at the plasma edge. This corresponds to a volume-averaged plasma $\beta$
 of $0.82\,\%$
 . The equilibrium $q$
 and $p$
 profiles are shown in figure 1.
Equilibrium safety factor ($q$ , solid) and pressure ($p$
 , dashed) profiles. Here, $q_0=1.3$
 , $q_a=4$
 and $\beta =0.82\,\%$
 . Mode rational surfaces, located at $x_s=\{0.11,0.19,0.27,0.51\}$
 and corresponding to $q(x_s)=\{4/3, 7/5,3/2,2\}$
 , respectively, are indicated by vertical dotted lines.

2.1. Tearing and interchange stability
To determine stability with respect to ideal interchange modes, we evaluate Suydam's criterion (Hosking & Dewar Reference Hosking and Dewar2016) at several resonant surfaces of interest. Recall that

is required for stability, where $'$ denotes differentiation with respect to $x$
 , B z is the axial component of the equilibrium magnetic field and $\mu _0$
 is the vacuum permeability. Specifically, we consider the $(m=2,n=1)$
 , $(m=3,n=2)$
 , $(m=4,n=3)$
 , $(m=6,n=4)$
 and $(m=7,n=5)$
 modes which are associated with the following set of low-order mode rational surfaces; $q(x_s)=\{2,1.5,1.33,1.4\}$
 where $x_s=\{0.51,0.27,0.11,0.19\}$
 , respectively. The mode rational surfaces are shown in figure 1. Of these, only the $(m=4,n=3)$
 mode is interchange unstable.
Next, linear stability with respect to tearing modes is determined by evaluating the usual $\varDelta '$ parameter at the resonant surfaces of interest, $x_s$
 , which are such that $q(x_s)=m/n$
 for a particular $(m,n)$
 mode. Recall that (Furth, Rutherford & Selberg Reference Furth, Rutherford and Selberg1973),

is required for stability, where $\psi (x)$ is a solution of the Euler–Lagrange equation that follows from the Energy Principle (e.g. see (1) from Furth et al. Reference Furth, Rutherford and Selberg1973). The requisite boundary conditions are $\psi (0)=0$
 if $m\neq \pm 1$
 , $\psi '(0)=0$
 if $m=\pm 1$
 and $\psi (1)=0$
 with $\psi \left ( x_s \right )=\psi _0$
 for some $\psi _0={\rm const.}>0$
 . Applied to the modes of interest, we find that the $(m=2,n=1)$
 , $(m=3,n=2)$
 , $(m=6,n=4)$
 and $(m=7,n=5)$
 modes are tearing unstable since $\varDelta '>0$
 in all cases.
2.2. Non-ideal linear growth rates
To compute linear growth rates and verify the characterisation given in § 2.1, we use the linear version of M3D-C$^{1}$ . Specifically, we calculate the non-ideal (linear) growth rates, $\gamma _{(m,n)}$
 , for $1\leq n\leq 5$
 . For each $n$
 , the corresponding $m$
 is that associated with the fastest growing linear instability. We perform a series of parameter scans with varying resistivity, $\eta$
 , to determine the scaling of $\gamma _{(m,n)}$
 with respect to resistivity, which allows us to classify the dominant linear instabilities.
The growth rates for modes with $1\leq n\leq 5$ are shown in figure 2 and calculated for $\eta \in [10^{-8},10^{-6}]$
 and $\nu =10^{-7}$
 , where $\nu$
 is the viscosity. The parameter range considered is equivalent to $\eta \in [0.0274,2.741]\ \Omega \text {m}$
 in SI units, $S\in [7.96\times 10^{5}, 7.96\times 10^{7}]$
 and $P_m\in [0.1,10]$
 , where the Lundquist number, $S$
 , is the ratio of the resistive and Alfvénic time scales and $P_m\equiv \nu /\eta$
 is the magnetic Prandtl number. For each $n$
 considered, the poloidal mode number of the most unstable mode coincides with those considered in § 2.1. This is as expected since the $(m=2,n=1)$
 , $(m=3,n=2)$
 , $(m=4,n=3)$
 , $(m=6, n=4)$
 and $(m=7,n=5)$
 modes are associated with mode rational surfaces of relatively low order. We observe that the growth rate for each of these modes scales linearly on a log–log plot, indicating that they are all of resistive character. In particular, we find $\gamma _{(2,1)}\sim \eta ^{0.684}$
 , $\gamma _{(3,2)}\sim \eta ^{0.603}$
 , $\gamma _{(4,3)}\sim \eta ^{0.344}$
 , $\gamma _{(6,4)}\sim \eta ^{0.653}$
 and $\gamma _{(7,5)}\sim \eta ^{0.538}$
 . Of these, $\gamma _{(2,1)}$
 , $\gamma _{(3,2)}$
 and $\gamma _{(6,4)}$
 agree well with the theoretical scaling for tearing modes (Wesson & Campbell Reference Wesson and Campbell2011), which goes like $\gamma \propto \eta ^{3/5}$
 . Similarly, $\gamma _{(7,5)}$
 agrees qualitatively. This is consistent with the classification of these instabilities as tearing modes. By contrast, the dependency of $\gamma _{(4,3)}$
 on $\eta$
 is much weaker.
Non-ideal linear growth rates, $\gamma _{(m,n)}$ , computed using M3D-C$^{1}$
 for toroidal mode numbers $1\leq n\leq 5$
 . In each case, the poloidal mode number, $m$
 , corresponds to that of the fastest growing linear instability. The dependence of $\gamma _{(m,n)}$
 on resistivity, $\eta$
 , indicates these are resistive modes. In particular, $\gamma _{(2,1)}\sim \eta ^{0.684}$
 , $\gamma _{(3,2)}\sim \eta ^{0.603}$
 , $\gamma _{(4,3)}\sim \eta ^{0.344}$
 , $\gamma _{(6,4)}\sim \eta ^{0.653}$
 and $\gamma _{(7,5)}\sim \eta ^{0.538}$
 .

In § 5, we will consider and compare the nonlinear plasma responses to externally applied $(m=2,n=1)$ RMP fields as calculated by M3D-C$^{1}$
 and SPEC, for the equilibrium specified by (2.1) and (2.2). Whereas the preceding analysis shows that this equilibrium is linearly unstable, figure 3 also indicates that $\gamma _{(m,n)}$
 depends strongly on the viscosity, $\nu$
 . This is as expected and, based on figure 3, we find that increasing the viscosity by an order of magnitude reduces the growth rate by approximately half an order of magnitude. For the nonlinear studies, we use $P_m=1$
 . We will find that growth of the $(m=4,n=3)$
 interchange mode is largely damped out in the nonlinear M3D-C$^{1}$
 simulations. In addition, the resistive instabilities are sufficiently slow growing that there is adequate separation between growth of these modes and saturation of the $(m=2,n=1)$
 magnetic island associated with the applied RMP.
Non-ideal linear growth rates, $\gamma _{(m,n)}$ , computed using M3D-C$^{1}$
 for $\nu =10^{-7}$
 (circles) and $\nu =10^{-6}$
 (stars) and three different values of resistivity, $\eta$
 .

3. Profile discretisation and SPEC workflow
With the (smooth) equilibrium profiles characterised, we now consider the discretisation of these profiles and preparation of input profiles for SPEC. In MRxMHD (Hudson et al. Reference Hudson, Dewar, Dennis, Hole, McGann, von Nessi and Lazerson2012), the plasma is partitioned into $N_{\rm vol}$ concentrically nested volumes. Each volume is separated by an interface across which a discontinuity in the pressure can be supported. Within each $i$
 th volume, the pressure ($p_i$
 ) is constant. Thus, the magnetic field in each volume ($\boldsymbol {B}_i$
 ) is assumed to be force free, satisfying

Here, $\mu _i$ is a constant and can be related to the parallel current density by taking the dot product of (3.1) with $\boldsymbol {B}_i$
 . In general, $p_i$
 and $\mu _i$
 will differ between volumes. Each interface is required to satisfy a jump condition (Hole et al. Reference Hole, Hudson and Dewar2007),

which ensures that the total pressure (magnetic plus thermal) is continuous. Depending on the mode of operation, specific combinations of input parameters are held fixed while the geometry of the interfaces is varied at each iteration to satisfy (3.2).
As alluded to in § 1, SPEC currently has at least three modes of operation. In all cases, the pressure is approximated by a piecewise constant profile and held fixed. In each volume, the toroidal flux ($\varPsi _{t,i}$ ), poloidal flux ($\varPsi _{p,i}$
 ), volume-averaged magnetic helicity ($\mathcal {K}_i$
 ) and $\mu _i$
 also need to be specified. Depending on the mode of operation, particular combinations of these parameters are held fixed. Details of the calculation of these quantities in cylindrical geometry may be found in Hole, Hudson & Dewar (Reference Hole, Hudson and Dewar2006). In addition, the value of the rotational transform, $\iota \equiv 1/q$
 , on either side of each interface may be required.
In the so-called ‘fixed helicity’ mode, the toroidal flux and helicity in each volume are held fixed. This mode is the one that corresponds to the assumptions of the MRxMHD model and, therefore, in this work we consider only solutions that are calculated using the fixed helicity method (Hudson et al. Reference Hudson, Dewar, Dennis, Hole, McGann, von Nessi and Lazerson2012).
Although an essential feature of the MRxMHD model, the number of volumes $N_{\rm vol}$ is usually a free parameter in practice. In the MRxMHD model, the interfaces are associated with invariant KAM surfaces (Hole et al. Reference Hole, Hudson and Dewar2006). Therefore, in the absence of axisymmetry, the rotational transform on each interface is required to satisfy specific properties (McGann et al. Reference McGann, Hudson, Dewar and von Nessi2010), that effectively depend on the strength of the non-axisymmetry. This constrains the values of the rotational transform for which interfaces may be supported and effectively fixes the discretisation of the pressure profile. If, however, the interface geometry is independent of the toroidal-like angle, $\phi$
 , then there exists a continuous symmetry. As a consequence, the preceding restrictions do not apply and we are also free to prescribe the initial positions of the interfaces.
Despite – or, perhaps as a consequence of – the flexibility of SPEC to compute solutions to (3.1) and (3.2) subject to different constraints, there does not currently exist a standardised or self-consistent approach for transforming smooth profiles (e.g. obtained from experimental reconstruction) into the piecewise constant representation required by SPEC. Thus, in this work we propose and describe one approach that is based on the experimentally motivated use cases of SPEC.
We consider a piecewise constant pressure profile obtained by discretising (2.2) using 5 volumes. Specifically, we take the value of the pressure in each volume to be the volume-averaged pressure calculated from (2.2). In this case, we have chosen $N_{\rm vol}=5$ to ensure that the original $q$
 -profile is well approximated, while still keeping the total number of volumes relatively small. The original and discretised pressure profiles and $q$
 -profiles are given in figure 4.
The original (green, dashed) and discretised (a) $q$ -profiles and (b) pressure profiles for $\varPsi _{t,i=3}=0.3$
 (blue), $0.4$
 (purple) and $0.5$
 (pink), where $\varPsi _{t,i=3}$
 is the normalised toroidal flux in the volume containing the $q=2$
 resonance (a, horizontal dashed line). The original profiles are given by (2.1) and (2.2), respectively. The discretised profiles are obtained from SPEC by running in ‘fixed iota’ mode and enforcing axisymmetry. See figure 5 for a summary of the procedure.

The workflow used to compute SPEC solutions with fixed helicity is summarised in figure 5. Our aim is to consider experimentally relevant use cases, so our procedure starts with smooth initial profiles for $q$ and $p$
 . In this work, $q$
 and $p$
 are given by (2.1) and (2.2). However, these could readily be substituted for profiles obtained from experimental reconstruction, e.g. EFIT (Lao et al. Reference Lao, John, Stambaugh, Kellman and Pfeiffer1985). From the smooth profiles, we compute the toroidal and poloidal fluxes in each volume, $\varPsi _{t,i}$
 and $\varPsi _{p,i}$
 . The parallel current density, $J_\parallel$
 , is discretised using the same approach as is taken for $p$
 , to determine $\mu _i$
 in each volume.
Summary of the workflow used to calculate a nonlinear, non-ideal response to externally applied, symmetry-breaking magnetic field perturbations using SPEC. The equilibrium profiles are used to calculate the toroidal and poloidal fluxes in each volume, $\varPsi _{t,i}$ and $\varPsi _{p,i}$
 . The parallel current density is discretised to obtain $\mu _i$
 . SPEC's ‘fixed iota’ mode is then used to obtain the volume-averaged helicity, $\mathcal {K}_i$
 , in each volume. In this first calculation, axisymmetry is enforced by setting the toroidal Fourier resolution parameter equal to zero. The SPEC boundary is then deformed to model the effect of an externally applied magnetic field perturbation. Finally, with $\mathcal {K}_i$
 , $\mu _i$
 , $\varPsi _{t,i}$
 and $\varPsi _{p,i}$
 as inputs in each volume, SPEC's fixed helicity mode is used to calculate a nonlinear, non-ideal response to the applied magnetic field perturbation.

The final radial position of each interface is determined by the toroidal flux enclosed in each volume. As an initial guess, we choose $\varPsi _{t,i}$ so that half of the toroidal flux in the volume containing the $q=2$
 rational surface (which is the mode rational surface of interest in this work) is enclosed by that surface. We then distribute $\varPsi _{t,i}$
 equally in the remaining volumes.
Next, we run SPEC in ‘fixed iota’ mode, where $\iota$ on either side of each interface is held fixed while $\mu _i$
 and $\varPsi _{p,i}$
 are varied. As an output, we obtain values for $\mathcal {K}_i$
 , the volume-averaged helicity in each volume. To preserve a continuous rotational transform profile, $\iota$
 on either side of each interface is equal and taken from the corresponding value of $q(x_i)$
 where $x_i$
 is the radial position of each jump in the discretised pressure profile. In this first calculation, axisymmetry is enforced by setting the toroidal Fourier resolution parameter, $\texttt{ntor}$
 , equal to zero.
With values for $\mathcal {K}_i$ , $\mu _i$
 , $\varPsi _{t,i}$
 and $\varPsi _{p,i}$
 in hand, an externally applied, symmetry-breaking magnetic field perturbation is modelled in SPEC by deforming the plasma boundary. As SPEC uses a doubly periodic Fourier representation for the poloidal and toroidal angles, this is achieved by modifying the amplitude of the Fourier component of the boundary representation corresponding to the particular $(m,n)$
 mode of the external perturbation. SPEC is then run in fixed helicity mode. Non-axisymmetric solutions are admitted by choosing the poloidal and toroidal Fourier resolution parameters so that $\texttt{mpol}$
 $>0$
 and $\texttt{ntor}$
 $>0$
 , respectively. The resultant solution corresponds to the nonlinear, non-ideal response associated with the prescribed externally applied, symmetry-breaking magnetic field perturbation.
4. The RMP models and coordinate systems
Before proceeding to a comparison of results, in this section we describe the methods and coordinate systems that are used to model externally applied magnetic field perturbations in SPEC and M3D-C$^{1}$ .
4.1. Coordinate systems
For the periodic, cylindrical geometry considered in this work, quantities in SPEC and M3D-C$^{1}$ can be described using the same Cartesian coordinate system, with orthonormal basis vectors $\{\hat {\boldsymbol {i}},\hat {\boldsymbol {j}},\hat {\boldsymbol {k}}\}$
 . A position vector, $\boldsymbol {r}$
 , can be decomposed as


in SPEC and M3D-C$^{1}$ , respectively. From (4.1) and (4.2), we can define cylindrical coordinates, $\{r,\theta,\zeta \}$
 and $\{r,\theta,z\}$
 , for SPEC and M3D-C$^{1}$
 , respectively. Since $\zeta$
 and $z$
 are analogues of the toroidal angle, $\phi$
 , both $\zeta$
 and $z/R_0$
 must be $2{\rm \pi}$
 -periodic and such that $\zeta =z/R_0$
 . To distinguish the latter from the cylindrical coordinates used by M3D-C$^{1}$
 in a toroidal geometry and which are usually denoted $\{R,\phi,Z\}$
 , we refer to $\{r,\theta,z\}$
 as the ‘local’ cylindrical coordinates.
4.2. Boundary representation in SPEC
For this work, we use the fixed-boundary version of SPEC. In this case, an externally applied magnetic field perturbation is modelled by modifying the shape of the plasma boundary, which is a required input parameter. For a periodic cylinder, the boundary shape is specified by $r_b(\theta,\zeta )\cos \theta \hat {\boldsymbol {i}}+r_b(\theta,\zeta )\sin \theta \hat {\boldsymbol {j}}+\zeta \hat {\boldsymbol {k}}$ . The scalar function $r_b(\theta,\zeta )$
 is given by the following stellarator symmetric Fourier representation (Hudson et al. Reference Hudson, Dewar, Dennis, Hole, McGann, von Nessi and Lazerson2012):

where $\{r_i\}$ are the Fourier coefficients and $i$
 indexes every unique ordered pair $\{m_i,n_i\}$
 for $m_i\in [0,\texttt {mpol}]$
 and $n_i\in [0,\texttt {ntor}]$
 . Therefore, for an externally applied $(m,n)$
 magnetic field perturbation, the perturbed boundary in SPEC is given by

where $\Delta r_a$ denotes the magnitude of the non-axisymmetric perturbation. Clearly, when $\Delta r_a\to 0$
 , (4.4) reduces to the circular cross-section configuration with minor radius $a=1\ \text {m}$
 of the axisymmetric equilibrium given in § 2. In this work, we consider only the case where a single $(m,n)$
 perturbation field is applied for $0.01\ \text {mm}\leq \Delta r_a<2\ \text {mm}$
 . However, it is straightforward to generalise to an externally applied field with multiple harmonics.
4.3. Representation of RMP fields in M3D-C$^{1}$

In M3D-C$^{1}$ , several different approaches for modelling RMP and error fields have been implemented and are regularly used to study the plasma response (Ferraro Reference Ferraro2012; Ferraro et al. Reference Ferraro, Evans, Lao, Moyer, Nazikian, Orlov, Shafer, Unterberg, Wade and Wingen2013; Reiman et al. Reference Reiman, Ferraro, Turnbull, Park, Cerfon, Evans, Lanctot, Lazarus, Liu, McFadden, Monticello and Suzuki2015; Wingen et al. Reference Wingen, Ferraro, Shafer, Unterberg, Canik, Evans, Hillis, Hirshman, Seal, Snyder and Sontag2015; Canal et al. Reference Canal, Ferraro, Evans, Osborne, Menard, Ahn, Maingi, Wingen, Ciro, Frerichs, Schmitz, Soukhanoviskii, Waters and Sabbagh2017; Lyons et al. Reference Lyons, Ferraro, Paz-Soldan, Nazikian and Wingen2017). Moreover, the recent extension of M3D-C$^{1}$
 to stellarator geometry (Zhou et al. Reference Zhou, Ferraro, Jardin and Strauss2021) affords additional capability to self-consistently model plasma evolution in the presence of strong non-axisymmetric external fields.
For this work, the externally applied magnetic field perturbation is modelled in M3D-C$^{1}$ by a vacuum field, $\boldsymbol {B}_{\text {RMP}}$
 , so that the total magnetic field, $\boldsymbol {B}$
 , is given by $\boldsymbol {B}=\boldsymbol {B}_{\text {plasma}}+\boldsymbol {B}_{\text {RMP}}$
 . From this definition, $\boldsymbol {B}_{\text {RMP}}$
 satisfies,


Importantly, in cylindrical geometry, the absence of poloidal mode coupling makes it possible to impose an RMP field associated with a single poloidal and toroidal mode number.
Using the local cylindrical coordinates $\{r,\theta,z\}$ we can expand the differential operators in (4.5) and (4.6) according to their usual definitions. From (4.5) and (4.6) it follows that $\boldsymbol {B}_{\text {RMP}}=\boldsymbol {\nabla } M(r,\theta,z)$
 , where $M(r,\theta,z)$
 is a scalar function satisfying

Assuming boundedness at $r=0$ and $2{\rm \pi}$
 -periodic boundary conditions in $\theta$
 and $z$
 , the general solution of (4.7) is given by

where $I_{m}\left ( x \right )$ is a modified Bessel function of the first kind and $\alpha$
 and $\delta B_{r}$
 are some constants. The exponential terms in (4.8) correspond to a ‘phase factor’ which we denote by $\varPhi (\theta,z)$
 for convenience. Thus, in cylindrical $\{r,\theta,z\}$
 -coordinates, the components of $\boldsymbol {B}_{\text {RMP}}$
 are given by


where $\alpha$ is chosen so that $B_{r,\text {RMP}}(r=1,\theta,z)=\delta B_{r} \varPhi (\theta,z)$
 yielding

4.4. Relating the M3D-C$^{1}$ and SPEC representations of RMP fields

Whereas an externally applied magnetic field perturbation in SPEC is modelled by specifying the amplitude of a deformation of the plasma boundary, $\Delta r_a$ , in M3D-C$^{1}$
 the amplitude of the field at the plasma boundary, $\delta B_{r}$
 , is prescribed. In order to compare the M3D-C$^{1}$
 and SPEC parameters, we now derive a relationship between $\Delta r_a$
 and $\delta B_{r}$
 .
Recall that the total magnetic field in M3D-C$^{1}$ is given by $\boldsymbol {B}=\boldsymbol {B}_{\text {plasma}}+\boldsymbol {B}_{\text {RMP}}$
 , i.e. the sum of the (nonlinear) plasma response and the vacuum RMP field. In this work, we consider small-amplitude external magnetic field perturbations, corresponding to a $\sim 1\,\%$
 perturbation of the magnetic field at the plasma edge. Since $\delta B_{r}\ll 1$
 , it suffices to use linear theory to relate $\delta B_{r}$
 to $\Delta r_a$
 .
Let $\boldsymbol {r}(r,\theta,\zeta )=\boldsymbol {r}_{0}(r,\theta,\zeta )+\boldsymbol {\xi }(r,\theta,\zeta )$ denote a position vector in SPEC, where $\boldsymbol {\xi }(r,\theta,\zeta )$
 is a displacement vector that vanishes when $\Delta r_a=0$
 . In the $\{\hat {\boldsymbol {r}},\hat {\boldsymbol {\theta }},\hat {\boldsymbol {\zeta }}\}$
 basis and using (4.4), we can write


Under a linear approximation, the plasma response in M3D-C$^{1}$ is given by $\boldsymbol {B}=\boldsymbol {B}_0+\boldsymbol {B}_{\text {RMP}}$
 , where $\boldsymbol {B}_0$
 is the equilibrium magnetic field described in § 2. Consequently, we can relate $\boldsymbol {B}_{\text {RMP}}$
 to $\boldsymbol {\xi }$
 using,

which follows from the linearised ideal MHD equations.
Using the fact that $\boldsymbol {B}_0(r)=B_{\theta,0}(r)\hat {\boldsymbol {\theta }}+B_{z,0}(r)\hat {\boldsymbol {z}}$ , we expand (4.15) in the $\{\hat {\boldsymbol {r}},\hat {\boldsymbol {\theta }},\hat {\boldsymbol {\zeta }}\}$
 basis assuming that $\boldsymbol {\xi }(r,\theta,z)$
 is given by (4.14) with $\zeta =z/R_0$
 . The radial component, $\hat {\boldsymbol {r}}$
 , yields

Using (4.14) and (4.9) we find,

Evaluating at the boundary, $r=a$ , yields

Using the fact that $q=rB_{z,0}/R_0 B_{\theta,0}$ , it follows that

where $q_a$ is the edge safety factor. By assumption, we require that $m/n< q_a$
 so the right-hand side of (4.19) is always positive.
When $a=1$ , as is the case considered throughout this work, (4.19) reduces to

or equivalently

5. Comparing nonlinear responses to $(2,1)$ RMP fields

For this study, we focus on the plasma response to an externally applied perturbation with a single helicity, namely $(m=2,n=1)$ . In the nonlinear calculations that follow, all modes are included in the plasma response (up to the limit of numerical resolution). In SPEC, we consider poloidal and toroidal Fourier resolution up to $\texttt {mpol}=12$
 and $\texttt {ntor}=6$
 , respectively, which we find sufficient to resolve islands that may arise due to resonances other than $q=2$
 . And, as M3D-C$^{1}$
 does not use a spectral representation in the nonlinear calculations, all modes are included in the calculation of the plasma response. In this study, we used 24 toroidal planes for the nonlinear M3D-C$^{1}$
 simulations.
Since we use the fixed helicity option of SPEC (see figure 5), in this study, the physics of the nonlinear plasma response calculated by SPEC is governed by the (static) MRxMHD model. Therefore, solutions correspond to plasma states that minimise the energy, subject to conservation of the volume-averaged helicity in each volume, i.e. volume-localised Taylor relaxation (Hole et al. Reference Hole, Hudson and Dewar2006; Dewar et al. Reference Dewar, Yoshida, Bhattacharjee and Hudson2015).
The second key assumption of the MRxMHD model is the existence and persistence of the ideal current sheet interfaces, that partition the plasma into volumes. One consequence of MRxMHD interfaces is that plasma in different volumes are prevented from mixing since $\boldsymbol {B}\boldsymbol {\cdot }\hat {\boldsymbol {n}}=0$ is enforced on each interface, where $\hat {\boldsymbol {n}}$
 is the unit normal vector. Consequently, the MRxMHD interfaces frustrate radial transport of plasma. Thus, good agreement between the SPEC and M3D-C$^{1}$
 solutions implies that the RMP does not lead to large-scale transport of plasma, e.g. from the core to the plasma edge. Finally, another consequence of the MRxMHD model is that SPEC solutions do not include flows, in either the initial profiles or nonlinear solution. Therefore, good agreement between SPEC and M3D-C$^{1}$
 implies that flows do not have a significant impact on the nonlinear plasma RMP response.
In subsequent sections (§§ 5.1–5.3) we will find that the nonlinear plasma response is primarily dominated by formation of an $(m=2,n=1)$ island that is associated with the helicity of the applied RMP. As we will see, for low values of the RMP amplitude ($\delta B_{r}\leq 0.5\text { mT}$
 ) there are conditions under which SPEC and M3D-C$^{1}$
 show close agreement for the nonlinear plasma response. When this is the case, MRxMHD theory implies that it is the 3-D state associated with saturation of the $(m=2,n=1)$
 mode that is energetically favourable, i.e. which minimises the energy, even though there may be other modes present (e.g. as suggested by the linear stability analysis of the smooth equilibrium cf. § 2).
Note that if an RMP field with a different helicity were applied, e.g. $(m=3, n=2)$ which is resonant at $x_s=0.27$
 , one would expect a different 3-D state to be the energy-minimising state. Finally, in tokamak or stellarator geometry where there is poloidal and toroidal Fourier mode coupling, it is plausible that modes associated with other resonant surfaces may contribute more significantly to the minimum energy 3-D solution because of mode coupling effects.
5.1. Nonlinear RMP response in M3D-C$^{1}$

Starting from the initial axisymmetric equilibrium given by (2.1) and (2.2), we use M3D-C$^{1}$ to simulate the full, nonlinear plasma evolution in response to an $(m=2,n=1)$
 RMP field, which is applied from $t=0$
 and specified by (4.9)–(4.11). Note that, while we consider static equilibria as an initial condition, M3D-C$^{1}$
 allows for flows to develop self-consistently in the course of the plasma evolution. In all cases, we choose isotropic values of resistivity and viscosity with $\eta =2.741\, \Omega \text {m}$
 such that $P_m\equiv \nu /\eta =1$
 and $S=7.96\times 10^{6}$
 , where $P_m$
 and $S$
 are the magnetic Prandtl number and Lundquist number, respectively. We use a model for the heat flux density, $\boldsymbol {q}$
 , that is given by

where $\kappa _{\parallel }/\kappa _t=10^{6}$ is the ratio of the parallel to perpendicular heat conductivity coefficients, $T$
 is the temperature and no heat source is applied.
In §§ 2.1 and 2.2 we saw that the equilibrium is linearly unstable, including to an $(m=2,n=1)$ tearing mode and $(m=4,n=3)$
 interchange mode. To determine the potential impact of the unstable modes on the nonlinear plasma response, we first performed a preliminary nonlinear study using M3D-C$^{1}$
 without an RMP field applied. We find that the unstable resistive modes are slow growing, which ensures sufficient separation between growth and saturation of the $(m=2,n=1)$
 magnetic island that is driven by the RMP, and other instabilities of the equilibrium. In particular, the $(m=2,n=1)$
 tearing mode is very slow growing, which is consistent with the linear studies described in § 2.2. As indicated in § 2.2, the linear growth rates depend strongly on $\nu$
 and, for the dissipation and transport parameters used in the nonlinear studies (which represent realistic experimental values), we find that the $(m=4,n=3)$
 interchange mode is largely damped out. Therefore, for the parameters considered in this study, the plasma evolution in the presence of the RMP is primarily due to the nonlinear plasma response to the externally applied field.
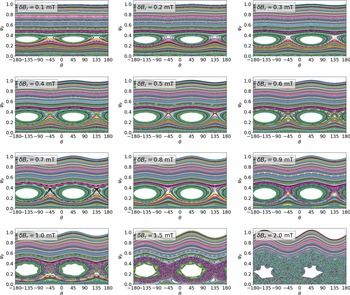
We consider RMP amplitudes in the range $0.1\ \text {mT}\leq \delta B_{r}\leq 2\ \text {mT}$ and examine the plasma properties at $t=5000\tau _A$
 , which we found was sufficient for the plasma response to reach a quasi-steady state. This was determined by examining the growth rate of the kinetic energy. Poincaré sections taken at $t=5000\tau _A$
 for each $\delta B_{r}$
 considered are shown in figure 6 as a function of poloidal angle and normalised poloidal flux. As expected, when the amplitude of the applied RMP is small ($0.1\ \text {mT}\leq \delta B_{r} \leq 0.5\ \text {mT}$
 ), we observe saturation of an $(m=2,n=1)$
 magnetic island at the $q=2$
 surface, that is driven by the externally applied magnetic field.
Poincaré sections of the plasma response as computed by M3D-C$^{1}$ and evaluated at $t=5000\tau _A$
 for $0.1\ \text {mT}\leq \delta B_{r}\leq 2\ \text {mT}$
 . Shown here as a function of normalised poloidal flux, $\psi _p$
 , and poloidal angle, $\theta$
 .

For intermediate values, where $0.6\ \text {mT}\leq \delta B_{r} \leq 0.9\ \text {mT}$ , we see the formation of secondary island chains about the O-points of the primary $(m=2,n=1)$
 magnetic island chain. For example, for $\delta B_{r}=0.7$
 mT, we see a secondary $m=9$
 island chain. As the perturbation amplitude increases and the secondary islands grow larger, nonlinear interactions begin to drive significant chaos, leading to break up of the separatrix associated with the primary $(m=2,n=1)$
 island. For sufficiently large perturbation amplitudes ($\delta B_{r}\geq 1\ \text {mT}$
 ), the primary $(m=2,n=1)$
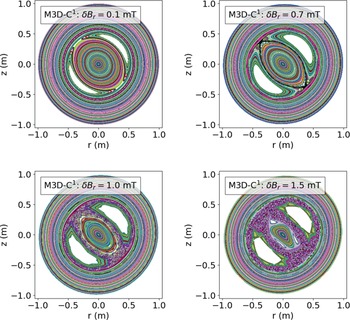
 island becomes embedded in, and eventually consumed by, a sea of chaos. In figure 7, we show a selection of Poincaré sections in $r-z$
 coordinates which illustrate the different qualitative features associated with the nonlinear plasma response for varying $\delta B_{r}$
 . Namely, (i) a saturated $(m=2,n=1)$
 magnetic island ($\delta B_{r}=0.1\ \text{mT}$
 ), (ii) formation of secondary island chains ($\delta B_{r}=0.7\ \text{mT}$
 ), (iii) break up of the separatrix associated with the primary $(m=2, n=1)$
 island ($\delta B_{r}=1\ \text{mT}$
 ) and, finally, (iv) near-complete stochasticisation of the plasma core ($\delta B_{r}=1.5\ \text{mT}$
 ).
Poincaré sections of the plasma response as computed by M3D-C$^{1}$ and evaluated at $t=5000\tau _A$
 for $\delta B_{r}=0.1,\ 0.7,\ 1,\ 1.5\ \text{mT}$
 . The pressure profiles shown in figure 8 correspond to cuts taken along $z=0$
 .

The corresponding pressure profiles taken at a cut along $z=0$ when $t=5000\tau _A$
 are shown in figure 8. Overlaid for comparison are the discretised pressure profiles used in the SPEC calculations, with $\varPsi _{t,i=3}=0.3$
 , $0.4$
 and $0.5$
 . As expected, for $0.1 \text {mT}\leq \delta B_{r} \leq 1.5\ \text {mT}$
 we find significant flattening of the pressure profile in regions coinciding with the $(m=2,n=1)$
 magnetic island. Nonetheless, in all these cases we observe the presence of pressure gradients in regions coinciding with the $(m=2,n=1)$
 island and magnetic field line chaos. This is attributable to the fact that the M3D-C$^{1}$
 model accommodates finite perpendicular heat conductivity, where $\kappa _{\parallel }/\kappa _t\gg 1$
 . On the other hand, in the MRxMHD model there is assumed to be no perpendicular heat diffusion. As a consequence, pressure gradients cannot be supported across magnetic islands or in regions of magnetic field line chaos. It is to be expected that the SPEC and M3D-C$^{1}$
 results will diverge when the effect of finite perpendicular heat conductivity becomes significant, although the differences may diminish for $\kappa _{\parallel }/\kappa _t$
 significantly larger than the value considered in this work (Hudson Reference Hudson2009).
Pressure profiles at $t=5000\tau _A$ as computed by M3D-C$^{1}$
 shown as a cut taken along $z=0$
 for $\delta B_{r}= 0.1,\ 0.7,\ 1,\ 1.5\ \text{mT}$
 (solid lines). Also shown is the equilibrium pressure profile (black line), given by (2.2). For comparison, the discretised pressure profiles used in the SPEC calculations are represented by filled curves for $\varPsi _{t,i=3}=0.3$
 (red), $0.4$
 (green) and $0.5$
 (blue).

5.2. Properties of the RMP response calculated with SPEC
As in § 5.1, we start from the initial axisymmetric equilibrium given by (2.1) and (2.2) and, this time, use the procedure described in § 3 to calculate MRxMHD solutions to an $(m=2,n=1)$ perturbation of the plasma boundary, with amplitude $\Delta r_a$
 . Specifically, we consider $0.01\ \text {mm}\leq \Delta r_a< 20\ \text {mm}$
 which, using (4.20), corresponds to $0.0053\ \text {mT}\leq \delta B_{r}<1\ \text {mT}$
 . As discussed in § 3, we considered a fixed number of volumes, $N_{\rm vol}=5$
 , which is representative of practical use cases for the code, including in the context of modelling experimental measurements.
A key parameter for SPEC calculations is the amount of normalised toroidal flux, $\varPsi _{t,i}$ , in each $i$
 th volume. This parameter has two important consequences. Firstly, the flux in each volume (which is held fixed during every SPEC solve) impacts the position of the interfaces in real space. This controls the spatial locations at which the original equilibrium profiles are discretised and, in turn, affects the fidelity of the discrete representation that is used by SPEC. This is particularly true for cases where $N_{\text{vol}}$
 is relatively small, as is considered presently.
As will be seen, the value of $\varPsi _{t,i}$ in the volume containing the resonant surface of interest also has a strong effect on the properties of the magnetic islands that are computed by SPEC. In particular, the island width depends strongly on $\varPsi _{t,i}$
 in the volume of interest, which is consistent with what has been observed previously in SPEC calculations performed in a slab geometry (Loizu et al. Reference Loizu, Hudson, Bhattacharjee and Helander2015).
We also find that the relative position, with respect to $\varPsi _{t,i}$ , of the resonant surface of interest within the volume affects the shape of the resultant islands. Specifically, where the resonant surface is closer to one of the two bounding interfaces than the other (in terms of enclosed toroidal flux), the islands become distorted and deviate from the physically expected result. Therefore, for this study we took particular care to ensure that the $q=2$
 resonant surface (which lies in the third volume) was centred with respect to $\varPsi _{t,i=3}$
 . This was achieved by carefully prescribing the value of $\iota =1/q$
 for each interface in the ‘fixed iota’ step of the calculation procedure (see figure 5) and amounts to a particular discretisation of the $q$
 -profile. While possible in this work, the procedure adopted here may not be universally applicable because, in the general 3-D setting, the MRxMHD model requires interfaces to be associated only with surfaces that have sufficiently irrational $\iota$
 , in the sense of KAM theory. Since the existence of these KAM invariant tori is closely related to the shape of the surfaces (McGann et al. Reference McGann, Hudson, Dewar and von Nessi2010), the discretisation of the $q$
 -profile in the most general case is effectively fixed by the geometry of the problem.
5.3. Comparing the nonlinear RMP response in SPEC
In figure 9 we compare the island widths obtained from M3D-C$^{1}$ and SPEC for $\varPsi _{t,i=3}=0.3,0.4$
 and $0.5$
 . The shaded regions correspond to the error bars associated with measurement of the island widths, which are obtained from field line tracing and examination of the Poincaré sections. As seen in figure 6, for $\delta B_{r}\geq 0.6\ \text {mT}$
 we begin to observe significant stochasticisation of the separatrix associated with the primary $(m=2,n=1)$
 island chain in M3D-C$^{1}$
 . In these cases, the island ‘widths’ shown in figure 9 are calculated by considering the distance between the two nearest flux surfaces bounding the islands and/or chaotic volume. Clearly, for $\delta B_{r}=2\ \text {mT}$
 where we observe complete stochasticisation of the plasma core (figure 6, bottom right), no such quantity can be calculated.
Saturated widths of $(m=2,n=1)$ magnetic islands due to externally applied $(2,1)$
 RMP fields, as calculated by M3D-C$^{1}$
 (pink), and SPEC for $\varPsi _{t,i=3}=0.3$
 (blue), $\varPsi _{t,i=3}=0.4$
 (orange) and $\varPsi _{t,i=3}=0.5$
 (purple), where $\varPsi _{t,i=3}$
 is the normalised toroidal flux enclosed in the volume containing the $q=2$
 surface.

As already alluded to, in figure 9 we find a strong dependence of the SPEC island widths on $\varPsi _{t,i=3}$ , the normalised toroidal flux in the volume containing the $q=2$
 rational surface. Increasing $\varPsi _{t,i=3}$
 in SPEC allows for larger islands as the strength of the RMP increases. This is to be expected since the maximum possible width of the island is only what can be allowed based on the toroidal flux initially enclosed in the volume. As can be seen for $\varPsi _{t,i=3}=0.3$
 and $0.4$
 , if $\varPsi _{t,i}$
 is too small the size of the resultant islands is artificially limited. For $\delta B_{r}\leq 0.5\ \text {mT}$
 , we observe the best overall agreement across this range of $\delta B_{r}$
 when $\varPsi _{t,i=3}=0.5$
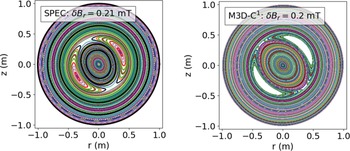
 . In figure 10 we present an example of one such case (with $\delta B_{r}\approx 0.2 \text {mT}$
 ) showing good agreement between the SPEC and M3D-C$^{1}$
 calculations of the plasma response, which consists of a saturated $(m=2,n=1)$
 magnetic island at the $q=2$
 resonant surface. For the SPEC calculation, $N_{\rm vol}=5$
 and $\varPsi _{t,i=3}=0.5$
 , while the M3D-C$^{1}$
 solution is evaluated at $t=5000\tau _A$
 .
Poincaré sections of the plasma response as computed by SPEC (left, $\delta B_{r}=0.21 \text { mT}$ and $\varPsi _{t,i=3}=0.5$
 ) and M3D-C$^{1}$
 (right, $\delta B_{r}=0.2 \text { mT}$
 ). The SPEC interfaces are represented by black curves with $N_{\rm vol}=5$
 and the M3D-C$^{1}$
 solution is evaluated at $t=5000\tau _A$
 .

At very small RMP amplitudes, particularly below $\delta B_{r}\sim 0.05\text { mT}$ , there is insufficient information in this study to conclusively determine which value of $\varPsi _{t,i=3}$
 gives the best agreement between SPEC and M3D-C$^{1}$
 . This underscores an overarching observation, which is the sensitivity of the island properties as calculated by SPEC to the value of $\varPsi _{t,i=3}$
 . Because of the freedom that (to varying degrees) exists to prescribe $\varPsi _{t,i}$
 , this effect is especially important when SPEC is used to calculate quantitative island properties, such as in recent applications of the code to stellarator optimisation (Landreman et al. Reference Landreman, Medasani, Wechsung, Giuliani, Jorge and Zhu2021).
Particularly for $\varPsi _{t,i=3}=0.5$ , we observe that the SPEC island widths, $w$
 , scale approximately as $\delta B_{r}^{1/2}$
 for the values of $\delta B_{r}$
 considered. According to theory (Wesson & Campbell Reference Wesson and Campbell2011), this implies that the resonant component of the total magnetic field at the $q=2$
 surface, $\delta B$
 , remains linearly proportional to $\delta B_{r}$
 , the driving field at the plasma edge.
There are two conditions under which we expect island width to scale differently to $\delta B_{r}^{1/2}$ . The first is when the island size is no longer small compared with equilibrium scale lengths such as the minor radius. From figure 7, we see that significant islands can open up in the M3D-C$^{1}$
 solution, even for $\delta B_r=0.1 \text { mT}$
 . It is expected that the inclusion of equilibrium flows would lead to a significant reduction of the island size. While M3D-C$^{1}$
 can accommodate states with equilibrium flows, work to extend the MRxMHD model to incorporate flows is ongoing. Consequently, we were limited to the static version of the MRxMHD model for this study and, therefore, do not consider the effect of equilibrium flows.
The island width scaling can also be modified when the resonant component of the field at the $q=2$ surface is no longer linearly proportional to the driving field, i.e. no longer satisfying $\delta B\propto \delta B_r$
 . This is indicative of significant nonlinearity in the plasma response, such as shielding or amplification of the applied RMP field. At larger $\delta B_{r}$
 , figure 9 suggests that for $\varPsi _{t,i=3}=0.5$
 the response computed by SPEC remains largely linear insomuch that $\delta B\propto \delta B_r$
 since $w\propto \delta B_{r}^{1/2}$
 . In contrast, solutions calculated by the M3D-C$^{1}$
 model, which has been extensively validated and used to model the plasma response (both linear and nonlinear) to externally applied 3-D fields in a range of applications (Ferraro et al. Reference Ferraro, Evans, Lao, Moyer, Nazikian, Orlov, Shafer, Unterberg, Wade and Wingen2013; Reiman et al. Reference Reiman, Ferraro, Turnbull, Park, Cerfon, Evans, Lanctot, Lazarus, Liu, McFadden, Monticello and Suzuki2015; Wingen et al. Reference Wingen, Ferraro, Shafer, Unterberg, Canik, Evans, Hillis, Hirshman, Seal, Snyder and Sontag2015; Canal et al. Reference Canal, Ferraro, Evans, Osborne, Menard, Ahn, Maingi, Wingen, Ciro, Frerichs, Schmitz, Soukhanoviskii, Waters and Sabbagh2017; Lyons et al. Reference Lyons, Ferraro, Paz-Soldan, Nazikian and Wingen2017), shows a clear deviation from the square-root scaling at larger $\delta B_{r}$
 . This suggests that nonlinear mechanisms, leading to shielding and/or amplification of the applied RMP field, contribute significantly to the plasma response. While beyond the scope of the present work, further elucidating the physics properties of the plasma response predicted by the MRxMHD model would be valuable as part of future work. In particular, examining the resonant component of the magnetic field at the corresponding rational surface to identify linear and nonlinear contributions to the plasma response.
5.4. Robustness and sensitivity of SPEC solutions
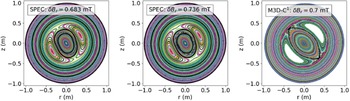
SPEC uses Newton methods to solve for both the Beltrami fields (3.1) and the interface geometry (3.2) and, as a consequence, can become sensitive to small changes in parameters such as $\Delta r_a$ . We observed this to be the case for larger perturbation amplitudes, where $\delta B_{r}>0.5\ \text {mT}$
 . An example of this is illustrated in figure 11. As in figure 10, $N_{\rm vol}=5$
 and $\varPsi _{t,i=3}=0.5$
 in the SPEC calculation, while the M3D-C$^{1}$
 solution is evaluated at $t=5000\tau _A$
 . For $\delta B_{r}=0.7\ \text{mT}$
 , the plasma response obtained from M3D-C$^{1}$
 is charact- erised by a saturated $(m=2,n=1)$
 island at the $q=2$
 resonant surface and about which there is a higher $m$
 secondary island chain. In contrast, for ${\delta B_{r}=0.683 \text {mT}}$
 and $\delta B_{r}=0.736 \text { mT}$
 , which differ only slightly, we observe two qualitatively different solutions for the plasma response as calculated by SPEC, both of which differ from the M3D-C$^{1}$
 response. In particular, for $\delta B_{r}=0.736 \text { mT}$
 we observe the appearance of a high $m$
 island chain in an inner volume which does not contain the $q=2$
 resonant surface.
Poincaré sections of the plasma response as computed by SPEC (left, $\delta B_{r}=0.683 \text { mT}$ and $\varPsi _{t,i=3}=0.5$
 ) and (centre, $\delta B_{r}=0.736 \text { mT}$
 and $\varPsi _{t,i=3}=0.5$
 ) and M3D-C$^{1}$
 (right, $\delta B_{r}=0.7 \text { mT}$
 ). The SPEC interfaces are represented by black curves with $N_{\rm vol}=5$
 and the M3D-C$^{1}$
 solution is evaluated at $t=5000\tau _A$
 .

As a measure of robustness, we consider the residual force error which represents the net force on each interface and, therefore, the difference between the numerical solution and the equilibrium condition, (3.2). For $\delta B_{r}\leq 0.5\ \text {mT}$ , at fixed Fourier resolution, the force error is $O(10^{-12})$
 or less and, for $\varPsi _{t,i=3}=0.5$
 , we find good agreement between SPEC and M3D-C$^{1}$
 (see figure 9). However, at the same Fourier resolution, for $\delta B_{r}\geq 0.6\ \text {mT}$
 we find that the force error becomes very sensitive to small changes in $\Delta r_a$
 . In this regime, we observed that even when the force error was at most $O(10^{-13})$
 , a change of $\Delta r_a=0.1\ \text{mm}$
 could be sufficient to yield solutions with qualitatively different characteristics, e.g. a single $(m=2,n=1)$
 island chain vs. islands embedded in a chaotic sea.
One strategy for reducing sensitivity is to choose an initial guess that is close to the desired solution. This may be achieved, for example, by starting from an axisymmetric solution and constructing a sequence of solutions while incrementally increasing a parameter of interest (such as $\Delta r_a$ ) until the desired value is reached. Such an approach requires the calculation of a large number of solutions, which is time consuming and, thus, not a universally viable strategy.
The observed decrease in robustness in the strongly driven RMP regime ($\delta B_{r}>0.5\ \text {mT}$ ) has important implications for applications including stellarator optimisation, where SPEC may be used to calculate quantitative properties of the equilibrium magnetic field structure. The ability to efficiently and reliably compute physics properties is essential for plasma optimisation procedures. In practice, parameters such as Fourier resolution are commonly specified in advance and held fixed during an optimisation run. On the other hand, $\Delta r_a$
 , which is related to the boundary shape, can change significantly in a free-boundary optimisation. We have seen, however, that the robustness of SPEC solutions can depend sensitively on both parameters.
6. Discussion and conclusions
In this work, we examined the conditions under which SPEC, an equilibrium code based on the MRxMHD model, can be used to model the nonlinear, non-ideal plasma response to externally applied symmetry-breaking magnetic field perturbations. In particular, we considered externally applied $(m=2,n=1)$ RMP fields and compared solutions obtained from SPEC to a series of nonlinear simulations performed using the initial-value, extended-MHD code, M3D-C$^{1}$
 . Specifically, we consider perturbation amplitudes in the range $0.0053\ \text {mT}\leq \delta B_{r}\leq 1\ \text {mT}$
 .
First, we first developed a workflow for SPEC to compute the plasma response to a prescribed RMP, under conditions that represent experimentally relevant use cases. We described the discretisation of (smooth) equilibrium profiles, such as those which might be obtained from reconstruction of experimental measurements, and preparation of the input profiles required for SPEC.
We found that the normalised toroidal flux, $\varPsi _{t,i}$ , in the volume containing the resonant surface of interest is a key input parameter and has a significant effect on the properties of the magnetic islands that are computed by SPEC. For the work considered presently, the $q=2$
 surface is located in the $i=3$
 volume. We observed a strong dependence of the SPEC island width on $\varPsi _{t,i=3}$
 . Importantly, when $\varPsi _{t,i=3}$
 was not large enough, we found that the maximum width of the islands, as calculated by SPEC, were artificially limited. Because there exists some freedom to choose $\varPsi _{t,i}$
 and since it must be prescribed a priori and remains fixed, this is particularly important when SPEC is used to calculate quantitative island properties, such as in some recent stellarator optimisation applications.
Starting from an axisymmetric initial equilibrium, we used M3D-C$^{1}$ to simulate the nonlinear plasma evolution in response to $(m=2,n=1)$
 RMP fields which were applied from $t=0$
 . We considered RMP amplitudes in the range $0.1\ \text {mT}\leq \delta B_{r}\leq 2\ \text {mT}$
 which, for an $0.1\text { T}$
 radial magnetic field at the plasma edge, corresponds to an RMP field strength of up to 2 %. For increasing RMP amplitudes, we observed four qualitatively distinct plasma responses in M3D-C$^{1}$
 ; (i) a saturated $(m=2,n=1)$
 magnetic island, (ii) formation of secondary island chains about the primary $(m=2,n=1)$
 island, (iii) break up of the separatrix associated with the $(m=2,n=1)$
 island and, eventually, (iv) complete stochasticisation of the plasma core.
Of the toroidal flux parameters considered in this study, we found that $\varPsi _{t,i=3}=0.5$ yielded the best overall agreement across the range of relatively small RMP amplitudes, where $\delta B_{r}\leq 0.5\ \text {mT}$
 . Above $\delta B_{r}>0.5\ \text {mT}$
 , we observed a clear divergence between SPEC solutions and the nonlinear plasma response as determined by M3D-C$^{1}$
 . The critical RMP amplitude at which this occurred corresponds to the onset of secondary island chains and break up of the separatrix associated with the primary $(m=2,n=1)$
 island. For this parameter range, in M3D-C$^{1}$
 we observed significant pressure gradients in regions of chaotic magnetic fields. This is due to finite parallel heat conductivity that is not captured by SPEC. For $\delta B_{r}>0.5\ \text {mT}$
 we also encountered a marked decrease in the robustness of SPEC solutions, including finding that the qualitative features of SPEC solutions became highly sensitive to small changes in the amplitude of the applied RMP.
Given the strong dependence of the SPEC solution properties on the flux in the volume containing the resonant surface of interest, an obvious question that remains outstanding is how to determine this quantity a priori. To do so requires additional theoretical development and exploration of the underlying MRxMHD physics model, which is beyond the scope of the present work. However, this is a critical question to address if SPEC is to be used as predictive tool for modelling the plasma response to externally applied 3-D fields.
In this work, we focussed on the role of the toroidal flux in determining the physics properties of the SPEC solutions. The MRxMHD model justifies the existence of interfaces by requiring the corresponding $q$ value to be ‘sufficiently irrational’, in the sense of KAM theory. Therefore, a related question is to understand the effect of the $q$
 -profile discretisation on the solutions as computed by SPEC. Preliminary studies suggest that this may introduce an additional source of sensitivity in SPEC, which motivates continued theoretical development of the MRxMHD model to better understand the connection between the underlying physics assumptions of MRxMHD and explicitly time-dependent extended-MHD models.
The ability to compute both the nonlinear and non-ideal plasma response to externally applied, symmetry-breaking magnetic field perturbations in realistic toroidal geometries is critical to a range of tokamak and stellarator applications. The ability to do so efficiently (in terms of both time and computational resources) opens up new opportunities in applications such as plasma optimisation and design. Our work indicates that SPEC is currently a viable tool for modelling the non-ideal plasma response to externally applied 3-D fields (including resonant magnetic perturbations and error fields) in the weakly nonlinear regime. Specifically, this means for perturbation amplitudes below the threshold for break up of the separatrix and onset of secondary magnetic island formation, and makes reliably identifying this critical value an important task for future work. Finally, future numerical improvements to SPEC, together with continued theoretical development of the MRxMHD model, may extend the parameter regime in which SPEC is a viable tool for modelling the plasma response to externally applied 3-D fields, by addressing outstanding questions, including how to prescribe $\varPsi _{t,i}$ and $N_{\rm vol}$
 .
Acknowledgements
Editor William Dorland thanks the referees for their advice in evaluating this article.
Declaration of interest
The authors report no conflict of interest.
Funding
This work was supported by Department of Energy Contract No. DE-AC02-09-CH11466 and the Summer Undergraduate Laboratory Internship (SULI) program.