Party politics in the European Union (EU) is organized at two levels. In each of the EU’s member states, national political parties contest elections and fulfil other traditional party roles. In the European Parliament (EP), national political parties also form into party groups, groupings of like-minded national parties at the transnational level, fulfilling many of the legislative and representative functions of their national counterparts. The process whereby national parties affiliate with EP party groupings is thought to be driven primarily by ideological compatibility, but its exact working remains largely unstudied. Party groups have been analysed in terms of voting cohesion but never, at least using systematic empirical evidence, in terms of the ideological or programmatic cohesion of their constituent national members.Footnote 1 Our analysis, by contrast, finds that the fundamental driving force behind national party affiliation in EP party groups is policy congruence: national political parties will seek membership in EP party groups whose policy platforms are closest to their own, on their most important national policy dimensions. Conversely, EP party groups will also attempt to maintain a degree of policy coherence among their national party members in order to facilitate intra-party decision making in a challenging environment.
The problem of maintaining policy congruence in EP groups is driven by the nature of politics and political competition at the national level. Political parties will and do frequently change their policy preferences on multiple dimensions, as well as the importance they attach to each dimension. This creates a chronic problem for EP political groups, since movement of policy positions at the national level can generate even greater incongruities between party group policy positions and those of some of their national party members. When these incongruities exceed a tolerable range, national parties may switch (or be forced to switch) to a different party group whose positions are more aligned with the national party’s own updated preferences. The implication of this is that political group affiliation should be primarily attributed to the congruence of policy preferences, and we test this proposition in this paper using data on the policy positions of EP party groups and national parties from the twenty-five member states of the EU that competed in the 2004 European election.
The degree of policy coherence exhibited by EP political groups has important implications for both democratic representation and legislative effectiveness in the European Parliament. It is well documented that European elections are ‘second order’ in nature.Footnote 2 Knowledge of the activity of the EP political groups and the behaviour of individual Members of the European Parliament (MEPs) is negligible among the citizenry of Europe. If we find that national parties typically affiliate with their closest ideological group in the EP, however, then voting on the basis of national party positions at European elections is not a bad informational shortcut for voters, suggesting that representational flaws and the ‘democratic deficit’ are less dire than EP critics would have us believe.Footnote 3 In addition, better understanding of group cohesion in the EP may help improve its legislative functions. Given the disparate ideological and party traditions of the EU’s numerous member states, the potential for discordant policy preferences within a given political group in the EP is considerable. All other things being equal, coalition building and decision making should be more difficult for political groups in the EP (compared with their counterparts in national parliaments) when the policy preferences of their members are very diverse. Exploring the workings of policy preferences in the process of party group affiliation by member parties thus provides a means of understanding how cohesion and consensus building might be maximized, subsequently enhancing legislative effectiveness.
In what follows, we briefly characterize political competition in the EP, identifying the mechanisms available to EP party groups for maintaining policy coherence among their members. We then turn to the politics of EP party group choice and affiliation within the Parliament, focusing on the policy congruence model and using Bayesian methods to predict party group affiliations of national parties in the 2004 EP, and then identifying misplaced parties. This examination allows us not only to identify the national parties that are in the ‘wrong’ party groups, but also to pinpoint which parties are most likely to switch groups in the future. Our concluding remarks discuss these findings and explore some implications for a more dynamic analysis of the process of party group affiliation and switching.
A Policy Explanation Of Party Group Affiliation
Party and Policy Competition in the European Parliament
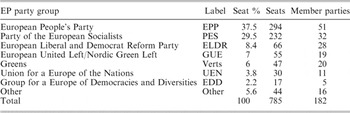
Now commonly viewed as the EU-level equivalent of political parties, political groups in the EP fulfil many of the same functions as their national-level counterparts. Seven political groupings existed in 2004, representing over 180 different political parties from the twenty-five member states then part of the EU. Table 1 lists the groups and their names immediately prior to the June 2004 elections, along with their seat shares and the number of national parties affiliated with each grouping.Footnote 4 Over time, party groups have become increasingly cohesive and powerful.Footnote 5 As a consequence, increased emphasis has been placed on maintaining voting cohesion in the party groups, especially the two largest political groups which operate a whipping system. This has occurred in spite of, or perhaps as a response to, increases in the size of the EP and the number of member states.Footnote 6
Political Party Groups in the European Parliament just prior to the 2004 Election

Note: These figures represent the standing just prior to the EP elections of 2004. The 785 member total is composed of the 626 members from the fifteen pre-enlargement states and the temporary members representing the accession states since 1 May 2004 prior to the June elections.
Source: European Parliament official website (http://www.europarl.europa.eu/members/archive/term5.do?language=EN).
In elections to the Parliament, EP political groups formulate their own policy positions, and the established groups have issued their own election manifestos since direct elections to the EP began in 1979. Party group policy positions have been mapped in several previous exercises but most clearly by McElroy and Benoit.Footnote 7 Very little is known about the precise manner in which policy platforms are formulated by party groups – a lacuna shared with manifesto studies in almost every other context – but anecdotally the process is driven by the demands and preferences of member parties, who have various ‘demand weights’ or degrees of influence according to delegation size, and also the process is influenced by possibly idiosyncratic factors such as seniority, nationality or the personal influence of well-positioned individuals.
Once formulated, the party groups’ policy positions serve as a guide to their legislative activity in the Parliament. Furthermore, new group members usually must agree officially to follow party policy. The rules of procedure of the ALDE group (successor to the ELDR examined here), for instance, explicitly state that new members must endorse ‘the 10 Point Program for Europe of the ALDE Group’. MEPs elected by national parties are regularly issued voting instructions by party groups and subject to the party whip. Party groups have mechanisms to punish MEPs who vote against the party group instructions, whether on individual initiative or (more likely) because of national party instructions, including demotion or even expulsion.Footnote 8 Strong divergences in policy positions between national member parties and the EP party groups could, therefore, cause persistent and potentially costly conflicts between national party and EP party group voting positions. Hix et al.’s analysis of roll-call votes from the 1999–2004 Parliament, for instance, showed that 6.6 per cent of MEPs disobeyed their party group’s instructions in order to vote with their national party.Footnote 9 MEPs nonetheless vote along party group lines over 90 per cent of the time and this political group cohesion has increased over the years.Footnote 10 Consequently, the high and increasing cohesion of MEP voting behaviour suggests that the policy congruence of national party members’ preferred positions with the positions of EP party groups should also be high. Maintaining cohesion is a constant struggle for party groups, however, because their support depends on constituent national parties whose success and survival come from diverse domestic arenas. When policy preferences between a party group and one of its national party members drift apart, the resulting incongruence creates tensions which may alter the calculus of affiliation.
National Party Dynamism and the Problem of Policy Incongruence
Detailed studies of party platforms over time have documented significant movement in party positions by major parties in the post-war period.Footnote 11 This dynamism follows naturally from the need to respond to shifts in the nature and importance of national issues, the positioning of new parties, and the repositioning of rival parties. Yet this constant motion also creates a large potential for incongruence between a party’s positions and that of the supranational EP party group to which it belongs, since EP party group positions are likely to be much more static given that they are determined by coalitions of different parties. Because membership in a party group is voluntary (and indeed some parties and MEPs may deliberately choose to remain officially unaffiliated), national parties always have the option to leave. When a national party’s position drifts away from the median position of a party group, it will not be the case, following Black’s classic expectation, that majority rule on single dimensions leads to group positions that are equivalent to the median voter’s most preferred point, because an alienated group member will find it easier simply to leave the group for another whose positions are closer to its own.Footnote 12 It is quite feasible, in fact, that a national party’s position may shift far enough away from its party group’s position that a rival party grouping’s position becomes more proximate to the national party’s preferences. When this happens, it is more likely that party groups will ‘unravel’ in the fashion similar to that described by Johnson, as a threshold of tolerable incongruence is exceeded and members withdraw because of unhappiness with the distance between its own changed position and that of their (former) party group.Footnote 13 Parties may also form new groupings when no existing group fits their programmatic needs, provided they meet some threshold requirements (nineteen members from at least five member states in 2004).
National parties, whenever possible, will attempt to steer EP group policies on issues of the greatest domestic importance towards the positions most preferred by the national parties. This ability, however – what Hearl calls ‘demand weight’ or political influence over the party group’s median position – may be quite small in the context of EP political groups, especially as the largest ones represent broad coalitions of multiple parties from many different member states.Footnote 14 When demand weight is outweighed by national political considerations, a party is likely to leave (or not join) that grouping. When this incongruence reaches a threshold, a national party will perceive the benefits of switching to a more policy-compatible party group to outweigh the costs of retaining its current less congruent affiliation.
A recent example of this process can be found in the debate within the British Conservative party over whether or not to withdraw from the European People’s Party (EPP), the main centre-right grouping in the EP. Having adopted a stronger and more explicitly anti-federalist policy position on the EU, reinforced in its 2005 manifesto and by Conservative party head David Cameron’s 2006 leadership election, the Conservatives experienced a high degree of tension between their own relatively anti-EU national party position and the pressure exerted by the EPP to vote for pro-federalist measures in the Parliament. The Conservative party eventually formed a new party grouping in 2008 with some like-minded parties from the EPP, such as the Czech Civic Democrats (ODS), whose leader Mirek Topolanek similarly declared in June 2006 that they found ‘it increasingly difficult to accept the way that French and German parties [were] voting in parliament’.Footnote 15
Consistent with this expectation that national party movement implies dynamism in party group affiliation, the empirical record of party group composition in the EP has shown high levels of change. EP groups experience a high frequency of party switching and most of this switching occurs when national political parties decide to change EP group affiliations, bringing all their MEPs along with them.Footnote 16
Realignments of affiliation, in the form of national party switching between EP groups, constitute a dynamic implication of the policy congruence explanation of party group affiliation. At any given time point, however, policy congruence also implies that the national parties affiliated together into party groups will be highly congruent on the most important dimensions of policy, as parties will have placed themselves in party groups according to the match between their policies and those of the party groups. Parties whose policies have become incongruent with those of their party group will exist, but these will be few in number. Moreover, the policy incongruent parties may also be identified as the most likely candidates for switching party groups, from a less to a more congruent parent party.
The Limitations of ‘Party Family’ Explanations
Because it is the conventional wisdom – and because its observable implications are clearly different from the policy congruence explanation set forth above – we briefly discuss the notion that party affiliation in transnational party groupings is driven by party family, determined by historical tradition and a party’s set of core principles. Rooted in cleavage theory, party families categorize parties based on long-standing issue associations and positions that arise from basic political cleavages in which parties are rooted. EP party groups are then the organizational units formed to ‘broadly represent the policy positions of … the classic European “party families” ’.Footnote 17
While capturing the broad spirit of the ideological basis on which party groupings originally formed, the party family explanation is inadequate to explain national party affiliation with EP party groups. First, party family is an essentially static characterization, while national party policy and (most importantly) EP group affiliation are clearly dynamic phenomena. On the one hand, national parties frequently modify their policy positions, sometimes dramatically, and they also switch EP party groups. Party families, on the other hand, are defined by ‘essential and indelible’ issue positions and orientations that do not change between elections.Footnote 18 Because party family is a static conception, while party positions and party affiliation change regularly, party family approaches can never offer more than a very general and indirect explanation of the dynamic process of party group affiliation.
Secondly, many national parties do not belong to clearly identified party families, either because their organizational basis does not correspond to the classic cleavages identified by Lipset and Rokkan or because they are formed primarily around new (single) issues such as European integration or immigration.Footnote 19 This situation characterizes many of the parties from the eight post-communist member states whose young party systems had developed for less than fourteen years at the time of this study. In Hungary, for instance, the Christian Democratic People’s party (KDNP) has been characterized as populist, the populist Hungarian Democratic Forum (MDF) has been classified as Christian Democratic, and the originally liberal Fidesz (Federation of Young Democrats, later Fidesz-Hungarian Civic Party) recast itself as a populist, right-of-centre party. Attempting to classify party families in Poland or Bulgaria – where even keeping track of the latest set of parties and party names is not for the faint-hearted – is even more problematic. In short, party family categories developed from cleavage patterns in West European democracies mean something very different when applied to the party systems of the EU’s post-communist member states.
Finally, while party family does provide a rough measure of party policy positions, within party family categories are parties with quite diverse positions on policy, especially on ‘new politics’ issues such as the environment, immigration or European integration. When direct measures of party policy are available on multiple dimensions, then these will always provide more information than party family categories, which are low information, categorical in nature, and apply poorly to new parties and parties from post-communist states. For these reasons, party family cannot provide a satisfactory explanation of party group affiliation in the EP.
Data: Policy Positions Of Parties And Party Groups
To test the policy congruence theory of party group affiliation, we have assembled a unique dataset of party positions in the EU based on expert surveys. This dataset combines the results of an expert survey of the policy positions of European party groups conducted in 2004 by McElroy and Benoit, and those of expert surveys of the policy positions of European national parties conducted in 2002–03 by Benoit and Laver.Footnote 20 The survey of the EP party group positions, including the methodology and precise wording of the political dimension on which experts were asked to locate the party groups, is reported in detail in McElroy and Benoit.Footnote 21 This survey of experts was conducted from April to June 2004, just before the June 2004 elections to the newly expanded EP. The survey solicited comments from thirty-six experts on the EU and the EP, obtaining a total response of 24 or 67 per cent.
Each party group was scored on a 20-point scale presenting two extremes of policy. Substantive policy dimensions covered in the survey included a set of four ‘core’ dimensions deployed in every country in the Benoit and Laver data: increase spending v. reduce taxes; the relative liberalism of ‘social’ policy; pro-growth versus pro-environmental policy; and pro-deregulation versus anti-deregulation. Also included were a set of three questions about EU integration covering party stances towards the scope of EU authority, national control versus federalism and the approach towards collective security. The results were therefore easily comparable to the Benoit and Laver data, which we employed for all measures of party policy at the national level for the EU-25 countries, covering a total of 146 of the 182 EU member state parties affiliated with EP party groups in June 2004.
Mapping Congruence Between National And European Policy Positions
The policy congruence explanation of EP group affiliation implies that policy incongruence will be the exception, rather than the rule, among the national party members that groups comprise. In other words, we expect to observe strong similarities in policy positioning among the national parties within each EP party group. By comparing evidence on positions from the expert surveys, we can look for direct evidence of these similarities.
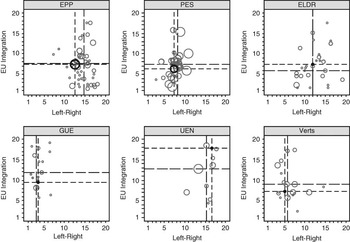
Previous work indicates that the structure of political contestation in the EU consists of positioning on two orthogonal dimensions, ‘one related to classic national left and right issues from national party politics, and the second clearly related to EU issues’.Footnote 22 These findings accord with earlier descriptions of politics in the European arena as consisting of two dimensions, socioeconomic left–right as well as a dimension of EU integration versus national sovereignty.Footnote 23 To take an initial look at this possibility, Figure 1 plots national party locations for each of the main party groupsFootnote 24 on the two dimensions of left–right and EU integration. The darker overlaid circles also indicate the position of the EP party group as measured independently by the EP expert survey. Each party and party group is represented by a circle whose size is proportional to that party’s vote share (or EP seat share in the case of party groups). Furthermore, the crosshairs identify the median position for the national parties, as well as pinpointing each party group’s position. The size of the inner square formed by the crosshairs can therefore be taken as a rough two-dimensional measure of the divergence between the party group’s position in two-dimensional space from the median point of its members.
National party and EP party group positions in two policy dimensions Note: The long dashed line is the two-dimensional position of the (weighted) median national party; the short dashed line locates the two-dimensional position of the EP party group. Sources: Benoit and Laver (2006) for national party positions; McElroy and Benoit (2007) for EP party group positions. EU integration is EU Authority from Table 2.

As clearly emerges from Figure 1, the policy location of the EP party groups on the two most important dimensions is nearly indistinguishable from the position of the (weighted) median national party. The differences that emerge are mainly on the European dimension, in particular the more pro-Integration stance of the GUE compared with its median national party member, and especially the more anti-Integration stance of the UEN compared with its median national party member. For the other party groups, however, the party group position corresponds neatly to the median national member party’s position. It deserves reiteration that the policy positions of the national party members and the EP group positions are drawn from completely separate expert surveys – twenty-six separate expert surveys in total – ranked by completely different experts, usually in different languages.
This congruence between national parties and EP party groups implies two results. First, it lends face validity to the policy congruence explanation of party group affiliation, since parties are clearly associated with party groups closest to their median member. Party groups appear to be taking policy positions designed to attract, and to retain, as many member parties as possible, which means attempting to locate on each dimension of the median the national member party’s most preferred point. Secondly, it also lends support to the notion that the left–right dimension and European integration form two distinct primary axes of political competition in the EU at both the national and transnational levels.
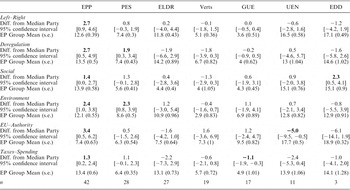
To compare more fully the party group positions to the median national party locations, we have summarized six dimensions of policy in Table 2. The EP group mean figure indicates the party group position estimated from the EP expert survey, along with a standard error. For each policy dimension and each party group, we also indicate the estimated difference between the weighted median party position and the party group position. By bootstrapping the medians of the national party positions, we computed 95 per cent confidence intervals for this difference. Among the vast majority of measures of comparisons between party groups and their median parties, most were indistinguishable from zero. Notable differences include the EPP’s median members being slightly more to the ‘right’ than the party group’s position, especially on the dimensions of EU integration (difference 3.4), the environment (2.4), and the two economic issues (2.7 and 1.3 for deregulation and taxes–spending, respectively). The median national party from the PES was also slightly less pro-environment (difference 2.3) than the PES itself. On the extreme left, the median GUE national party was even more left than the far-left position of the GUE (difference −1.1) on taxes–spending; on the other extreme, the far-right EDD’s median member was even more far right (difference 2.3) than the EDD’s position on social issues.
EP Group Positions and Position of Median Member Party

Notes: Diff. from Median Party represents the median national party position from the Benoit and Laver (Party Policy in Modern Democracies) data, weighted by the number of MEPs, minus the mean. Bold figures are statistically significant at p ⩽ 0.05; confidence intervals are bootstrapped from 1,000 draws per party group per dimension. Figures for EP Group Mean represent the mean (std. error) of expert responses from the EP expert survey (see McElroy and Kenneth Benoit, ‘Party Groups and Policy Positions in the European Parliament’).
As a whole, the differences between median national parties and their group’s policy position measured at the transnational EP level were indistinguishable, especially on the highly salient dimensions of left–right and EU integration. We take this as good initial evidence that party groups consist of national members who are affiliated on the basis of similar policy preferences, as well as indicating that policy contestation in the EU is similar between the national and transnational levels. To complete the evidence for the explanation that parties affiliate in the EP on the basis of policy congruence, however, we need to test directly whether congruence can explain and predict the observed party groupings, conditional on policy congruence.
Explaining Party Group Affiliation In The European Parliament
Conditional Logit Model of Party Group Choice
Party group affiliation involves choosing between alternatives, and given the difficulties of establishing new groupings, for all practical purposes this entails choosing from between available alternatives. For national parties considering affiliation, therefore, the driving factor should be the relative distance of alternatives: how close a party group’s position is to a national party’s own position, compared with other party groups’ positions. To test this explanation, we develop and apply a discrete choice model to the question of party group affiliation, using relative policy congruence on multiple dimensions of policy to predict party group choice.
Our model uses conditional logit regression, based on fitting N = 146 national parties for which we observed fully non-missing policy data to the K = 7 political groups in the EP. An attractive feature of the conditional logit model is that it permits both choice-level variables as well as individual-level variables, and can be motivated by a random utility model.Footnote 25 The corresponding utility function associated with the kth choice in this mixed model is given by:

where zik refers to the choice-varying covariates and xi refers to individual varying covariates. The utility to party i of choice k is linear in some predictors but also contains a random component. An outcome yik is observed for each party group category k as:

The conditional logit model derived by McFadden relates the choice probabilities to uik according to:

when yi∼multinomial(pi).Footnote 26
In our model, the key independent variables are choice-related, consisting of the absolute difference between the national party’s mean point (on a given dimension) and the mean policy position of the political group under consideration. The variable thus takes on different values dependent on the response category for each national party. These variables are:
— Policy distance (a choice-level variable). This variable measures the absolute difference between party group k’s position and the policy position of the national party i on six commonly measured dimensions: Left–Right; Taxes–Spending; EU–Authority; Environment; Social-Liberalism; and Deregulation. Our argument suggests that national parties will seek to minimize these distances in order to achieve policy congruence between themselves and the political groups, and therefore we expect the signs on these coefficients to be negative. The greater the distance between party i and political group k, the less likely it is to choose to affiliate with this group.
— Decentralization position (individual-level variable). This variable captures the national party position on the decentralization dimension, where 1 indicated that the party favoured decentralized decision making, and 20 indicated that a party opposed decentralization. This variable was re-centred by subtracting it from the scale midpoint of 10.5. This variable could not be included as a choice level variable as there was no measure of decentralization included in the expert survey on the positioning of the EP political groups. Nonetheless, the national party position on decentralization is included because national parties’ positioning on this issue still identifies an important policy dimension around which parties might coalesce into like-minded groups, even if as an individual-level variable it does not capture proximity to the nearest EP group.
— National party vote share (individual-level variable). This variable measures the percentage of votes that party i received in the most recent national election. This measure is included to capture the concept that large national parties (regardless of the number of MEPs they elect) may be predisposed to association with the larger political groups in the EP for reputational and influence reasons. Key parliamentary positions such as chairmanships and membership of the Bureau are ‘owned’ by the larger groups. So, for instance, when the governing British Conservative party switched to the (large) EPP in 1992, it moved out of a much smaller group in the Parliament, the ED, which had just 6 per cent of the EP seats. Sitting Conservative party MEPs voiced similar concerns in the recent negotiations over the formation of a new group in the EP, one party insider commenting that ‘it’s not really in Britain’s interests if the Tories quit the biggest group in the Parliament’.Footnote 27
Two estimation methods were used to fit the model. The first uses maximum likelihood (estimated via the STATA 9 package). The second fits a general MCMC-based Bayesian model that allows the α parameters to be estimated separately for each party group, k. Using (diffuse) multivariate normal priors, this model was run for 80,000 iterations, discarding the first 50,000 as burn-in, and mixing three chains set with random starting values.Footnote 28 The advantages of fitting the Bayesian model for our context are several. First, it permits us to estimate separate (random) effects from each choice variable for each party group. Because political groups attach different levels of importance to different policy dimensions, we have strong substantive reasons to believe that some policy incongruities will operate differently for certain groups. For instance, the effect of policy distance on the environmental dimension should be different for the Green (Verts) party group versus the anti-European (EDD) party group, for which environmental policy is not a high-salience issue. Secondly, the Bayesian approach permits full characterization of the posterior distribution for the quantities of interest, which includes not only the variable coefficients but also the predicted probabilities for each case, including the ratio of predicted probabilities for a party belonging to one group versus another, something we focus attention on below.
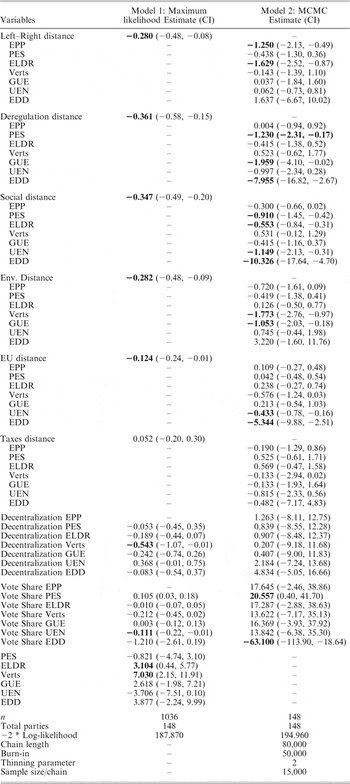
The results of the model estimation are presented in Table 3. The coefficient estimates for the choice variables of policy distance represent the influence of policy incongruence on the probability that a given national party will be a member of a particular group. When the coefficients are negative, this indicates that as the distance between the national party’s mean and that of the European political group in question increases, the less likely the national party is to affiliate with the given party group. The confidence intervals represent the uncertainty around the coefficient estimates, providing evidence of a real effect when the interval does not include zero.
Conditional Logit Estimates of Party Group Choice

For the policy distance variables in the first model, the coefficient estimates are very consistent: all are statistically significant (with the exception of Taxes–Spending) and in the expected negative direction. The greater the distance between a national party’s position and the position of a political group in the EP, on a given policy dimension, the less likely the national party is to be a member of this party group. Tax distance fails to reach significance in either of these two models, possibly because it is highly collinear with the Left–Right and Deregulation dimensions. Decentralization is only significant for the Green grouping, which is not altogether surprising given that this party is the only one fully committed to the concept of subsidiarity, with a policy platform centred on a commitment to deepen democracy by decentralization. This commitment makes the group attractive to regional parties lobbying for further autonomy.
The second column (Model 2) reports the results of the more general MCMC model in which the parameters for each group were allowed to vary. These results provide richer detail about the significance of policy distance for the individual groups and their affiliated national parties. For instance, Left–Right distance, as we would expect, is significant for two of the big political groups, though oddly not the PES. Distance on the Social dimension (attitudes to such matters as abortion and homosexuality) is significant for half of the parties (the PES, ELDR, UEN and EDD) and again in the right direction. Environmental distance, as would be expected, is significant for both of the Green groups (Verts and GUE). Attitudes to levels of EU authority are again significant for the two anti-federalist groups, the UEN and EDD. Finally, deregulation is significant and in the expected negative directions for three Groups, the PES, GUE and EDD. The individual level policy variable ‘Decentralization’ fails to reach significance for any political group. While the lack of a baseline category makes it more difficult to detect statistical significance in these coefficients, this more informative model nonetheless forms the basis for generating predicted probabilities of group membership for each party, by drawing from the posterior distribution. On the basis of these predictions, it is then possible to assess, at least from the standpoint of policy congruence, which parties do and do not fit in their existing party groups.
Evaluating Party Group Fit
The Bayesian framework makes it straightforward to generate posterior predictions of our key quantities of interest: the probability that a given party will choose a particular party group. Because these probabilities can be simulated directly from the posterior distribution, they provide an alternative to other methods, such as parametric bootstrapping from maximum likelihood parameter estimates.Footnote 29 By comparing the posterior probabilities of the group predicted as having the highest probability of membership for a given party to the group of which the party is actually a member, we can also directly estimate the ratio of actual to predicted group membership as a posterior quantity, to estimate the degree of ‘fit’ (or ‘misfit’) for each national party. This quantity is of direct substantive interest to any scholar, observer or political actor interested in party group cohesion as well as being relevant to party and coalition formation generally at the European transnational level.
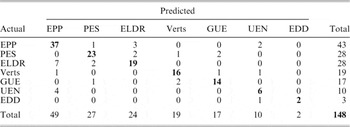
Based on the highest mean posterior probability of being in a party group, computed for each party from the Bayesian estimates in Table 3, we can predict a party group based on the model and compare this to parties’ actual groups. Table 4 presents a cross-tabulation of these predicted groups with actual group membership. The result is impressive: a total of 79 per cent of the national parties’ party groups are correctly predicted by the model, based on 117 of 148 parties correctly predicted by having the mean posterior  , where
 represents the mean posterior probability of party i being in party group k. In other words, simply by minimizing policy distance – without informing the model in any way of the absolute policy positions of the parties or groups – we have predicted nearly four out of five parties correctly. As an indicator of just how impressive this predictive result is, we can compare the prediction to non-informative models. If we simply assumed a uniform probability for each party joining a group, then our baseline predictive rate would be to predict just 0.14 (or one out of seven) correctly. Of course, we could do much better by simply choosing, for every party i, the largest or modal category of party group in our sample (here, the EPP with forty-three national parties from the 148), which would correctly predict 0.29 of the national parties’ group alliances. Measured against this benchmark, our model represents an increase in correct prediction of an additional 50 per cent of the sample. Furthermore, if we exclude as a ‘prediction’ any posterior mean ratios whose highest posterior densities include 1.0, then only five parties are incorrectly predicted, for a percentage correctly predicted of 0.966.Footnote 30
Cross-Tabulation of Predicted Group Affiliation versus Actual Group Affiliation

Note: Predicted party group is determined by  where
 represents the mean posterior probability of party i being in party group k, from Table 3.
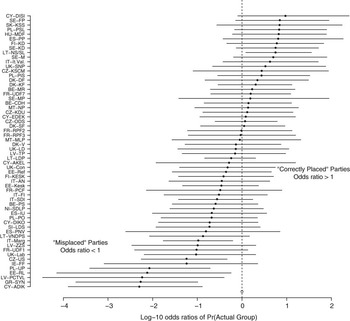
In addition to merely predicting the most likely category, our model estimates also provide direct information on the degree of ‘fit’ for each national party according to the model’s posterior predictions. Figure 2 summarizes the fit for sixty parties by plotting the estimated ‘odds ratios’ that a party would be in its observed group: the mean posterior probability of being in this group divided by the probability of not being in this group. To reduce skew and improve interpretation, we have logged the scale using base 10 to provide the ‘logged odds ratios’. A value of 1.0 – such as that scored by the Cypriot DISI party at the top of the plot – therefore means a party was estimated at being ten times more likely to be in its actual party group than in another group. Conversely, a party like the British Labour party with a value close to −1.0 means it was ten times less likely to be in its observed group than not. In the most extreme cases, such as the five parties at the bottom of the plot whose logged odds ratios were less than −2.0, these were more than 100 times less likely to be in their observed party than not, according to the model. Finally, the dashed line through the zero point on the x-axis indicates the point at which the odds are the same for being in the observed group as any other group (since log(1) = 0), and hence this line demarcates what we have called the ‘mis’- versus ‘correctly’-placed parties. For all parties whose mean posterior (logged fit) was less than 1.0, Figure 2 thus summarizes at a glance the ‘fit’ of each national party, along with estimates of uncertainty represented by the width of the lines.
Logged odds ratios of probability that a party belongs to its actual party group, from posterior distributions Note: Plots the posterior distribution of base-10 logged odds ratios of the probability of a party belonging to its actual group, according to the (Bayesian) model from Table 3. Solid circles represent posterior means, and the bars represent the 90 per cent highest posterior density region.

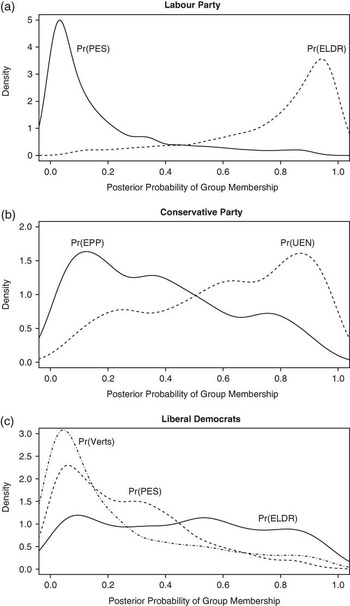
More insight on ‘correct’ versus ‘mis’-placement of parties into party groups can be gained by focusing on the posterior predictions of individual parties. In Figure 3, we focus the spotlight on the three main British parties, directly plotting the posterior densities of the probability of group membership for several candidate party groups. In each panel, the solid line represents the posterior density for the party group in which the party is observed, while the dashed lines represent posterior densities of the probability of this party being a member in some other party group. In the first panel, for instance, we see that the model clearly predicts Labour as better fitting in the liberal ELDR grouping – because its mass is concentrated around the (0.8, 1.0) probability region – no doubt because under Blair its well-known ‘New Labour’ policies assumed many centrist or even liberal characteristics. The Conservative party is also ‘misplaced’ since the greatest mass of its posterior density is in the anti-federalist UEN group rather than its observed group, the EPP. As we have already pointed out, this misplacement is not surprising given the party’s pledge under leader David Cameron (elected in 2006) to quit the EPP and their subsequent formation in 2009 of a new political group, the European Conservatives and Reformists Group. Finally, the widely distributed posterior mass for the probability of the Liberal Democrats being in their actual group, the liberal ELDR, shows that while this is the ‘best’ fitting group for this party, it is nonetheless not a great fit. The Liberal Democrats could also have fitted into the PES, or even – although considerably less likely according to the model – the Greens.
Posterior probability densities for British parties Note: Plots individual posterior densities for the probability of each party being in the given party group, from a Bayesian model shown in Table 3.

As a final insight into the model’s ability to evaluate party group fit, we examine a case where French MEPs from two national parties each split into two different party groups. From the Union pour la Démocratie Française (UDF), seven deputies moved from the ELDR to join the EPP, while one deputy refused and remained affiliated with the former party group. Similarly, in 2004, French MEPs from the Rassemblement pour la France (RPF) were split between two party groups, three joining the EDD and two affiliating with the UEN. By examining the posterior densities of the probabilities of each party’s membership in the different groups, we can assess which party faction is in the ‘wrong’ party group. Figure 4 plots these densities for each party group for the UDF and RPF. In the case of the UDF, this national party is clearly much more likely to belong to the EPP, and hence the stubborn MEP remaining in the ELDR either does not belong or has very different policy preferences from his national party. This is something which our data and model cannot determine, of course, since our examination focuses on parties rather than individuals, but it does suggest that this lone member is in one way or another ‘out of sync’ with his national party. In the case of the RPF, the posterior densities have an almost identical mass over the middle regions of probability, suggesting that one group is basically as good as the other from the standpoint of policy congruence.
Posterior probability densities for two French parties, each split between two EP groups Note: The UDF (Union pour la Démocratie Française) was split with seven members in the EPP and one in the ELDR; the RPF (Rassemblement pour la France) was split with three members in the EDD and two in the UEN.

Discussion
Our look at the organization of political contestation in the EU has examined two arenas. In the European arena, represented by the directly elected institution of the EP, political contestation is centred around party groups, that control the organization of committees and other legislative resources and formulate their own policy platforms for European elections. In the domestic national arena, national political parties remain both the main unit of political organization and important gatekeepers and actors to the European arena, recruiting most MEPs from their own ranks, and choosing which EP party groups they will affiliate with. Our findings show that the structure of political contestation in both the national and transnational arenas is substantially similar. Even given the extraordinary diversity of the national political systems of the newly expanded EU – including eight states that were under communist control just fifteen years before their first European elections in 2004 – we find a convergence in the structuring of political contestation between the national and European arenas. Party groups at the transnational level not only operate in a similar policy space as do national parties, but also tend to be formed mainly as coalitions of parties that are like-minded on matters of policy. In short, party and policy competition in the EP is an extension of national politics by other means. This understanding not only implies that concerns of a ‘democratic deficit’ arising from voter ignorance of Parliament affairs at European election time are overstated, but also points to the significance of maintaining congruence among national party preferences for policy as a means to effect more stable and effective party groupings in the EP.
In order to examine the relationship between national parties and the EP party groups with which they affiliate, we predicted EP group membership as a function of the policy distances between national parties and the EP groups in the choice set. The results strongly indicate that proximity of a party group to a national party’s policy platform determines the likelihood that the national party will be affiliated with that EP group. Parties tend not to affiliate with party groups that are farther from their own preferred positions. We explain this clearly observed tendency through an explanation based on policy congruence: the notion that party groups, as coalitions of national parties, will tend to adopt positions close to their median member’s. When a national member party finds itself in a party group incongruent with its own policy positions, the likelihood increases that the national party will move to a different political group whose positions are closer to its own. The potential for this form of group ‘unravelling’ is one of the reasons party groups tend to adopt positions closer to their median national member’s position, and yet this positioning can never be perfectly achieved. Because of policy movement at the national level, there is a constant problem for party groups in maintaining a policy position that will retain current members, while at the same time attracting potential new members. When the policy incongruence between a national party and a party group grows beyond some threshold of intolerance, we are likely to observe a national party switching to a different group, a phenomenon that is in fact quite common in the history of the EP.
While policy congruence drives our explanation, we certainly do not expect that policy explains every instance of national party affiliation with party groups. As we have seen in the British case, for example, there clearly exists a potential for some parties to become members in EP groups that later seem inappropriate from a pure policy standpoint, for what we can only assume are non-policy reasons. For similar reasons, we may also find cases in other countries where political histories, national rivalries or party rules may hinder the unfettered operation of the simplified policy free-market model of affiliation that we have outlined here. Nonetheless, our model examining just a snapshot of the EP in 2004 suggests that policy alone may explain four-fifths of national party affiliation, suggesting that policy congruence is far and away the single most important driving factor guiding national parties in their decisions to join transnational party groups.
As a first investigation of party group affiliation, our approach has been based on a snapshot of party affiliation at a specific time, albeit a time point carefully chosen for its political significance. Despite the fact that we have successfully demonstrated that policy underlies national party affiliation with transnational EP party groups – something never before systematically examined in any literature – our picture has been essentially static rather than dynamic. Not only national party positions, but also EP party group positions change over time. Furthermore, new parties and even new countries are periodically added to the EP; indeed, two new countries, Bulgaria and Romania, have joined the EU and added MEPs to the EP since the time of our study and the writing of this article. Future research into the calculus of party affiliation in the European arena should focus on changes over time, especially national party switching between groups during the period 1979–2004, something the authors have planned for future work. The practical challenges are enormous and probably explain why this phenomenon has never before been systematically investigated, but the theoretical and substantive importance of the growing dynamic of transnational politics in the EU is enough to warrant a great deal of future effort in this direction.
Appendix: Full Estimation Results
The fully parameterized model upon which the predictions are based was used to generate 1,000 draws of the posterior distribution of the quantities of interest, namely the posterior conditional probabilities of a national party joining each of the K = 7 party groups. Data were fully observed on 146 national parties, and αk coefficients for each policy distance variable were estimated separately for each party group. In addition to the six choice-based policy distance variables, three individual-level variables were used (national vote share; and position on decentralization policy, centred at 10.5). Vote share was normalized to improve convergence and avoid numerical problems in WinBUGS. Estimations were performed in WinBUGS 1.41. The likelihood function and priors are modelled in WinBUGS using the following code:
model {
set priors once per variable, per party group
for (j in 1 : K) {
b.tax[j] ∼ dnorm (0, .001)
b.soc[j] ∼ dnorm (0, .001)
b.env[j] ∼ dnorm (0, .001)
b.auth[j] ∼ dnorm (0, .001)
b.dereg[j] ∼ dnorm (0, .001)
b.lr[j] ∼ dnorm(0, .001)
b.decent[j] ∼ dnorm(0, .001)
b.votesha[j] ∼ dnorm(0, .001)
}
Loop around groups
for (i in 1:I) {
Multinomial model
Y[i, 1:K] ∼ dmulti (p[i, 1:K], 1)
loop around parties
for (k in 1:K) {
p [i, k] <- phi[i, k]/sum(phi[i,])
log(phi[i, k]) <- b.tax[k] * tax[i, k] + b.soc[k] * soc[i, k] +
b.env[k] * env[i, k] + b.auth[k] * auth[i,k] + b.dereg[k] * dereg[i, k]+
b.lr[k] * lr[i, k] + b.decent[k] * decent[i] + b.votesha[k] * votesha[i]
the next line commented out except for last 1,000 runs
probp[i, k] <- p[i, k]/sum(p[i, ])
} } }
The initial estimation was run using three simultaneous chains for 80,000 iterations, discarding the first 50,000 as a burn-in. Alternate iterations were recorded, resulting in a total of 15,000 saved iterations per chain. Convergence was excellent as evidenced by examining trace plots and observing chain mixtures. Full convergence diagnostics are available upon request.