Background
Based on the World Disaster Risk Report, sustainable development is impossible without considering the Disaster Risk Reduction (DRR) approach. Reference Desai, Maskrey, Peduzzi, De Bono and Herold1 In recent decades, mortality from disasters has increased to such an extent, that the epidemiology of disasters has gained a special place in the world in the last 20 years, and deaths due to natural and man-made hazards have attracted the attention of researchers and policymakers. Reference Safarpour and Khorasani-Zavareh2 Ample evidence indicates that the risk of loss of life and assets increases faster than vulnerability reduction strategies. 3 Statistics show that from 1980 to 2012, 42000000 years of life have been lost (YLL) due to disasters, over 80% of which occurred in Low and Middle-Income Countries (LMICs). Reference Wallemacq, Guha-Sapir and McClean4
At the Third United Nations’ World Conference, the International Strategy for DRR was adopted under the Sendai Framework. After implementing it, expected outcomes included a substantial reduction in disaster risk, mortality, and losses to all aspects of life in the countries. Despite the emphasis on governments’ roles for the DRR, the Sendai Framework endorsed the common duty of the governments and concerned stakeholders that effectively can participate in the disaster management. 3
Given the diversity of relevant organizations, traditional methods that analyze stakeholder performance individually are less able to investigate the dynamics of the whole system and interactions among stakeholders. Reference Aboelela, Merrill, Carley and Larson5–Reference Prizzia9 It is important to understand how organizations contribute to each other. Therefore, Social Network Analysis (SNA) approaches that investigate the behavior of systems collectively would be an appropriate option. Reference Wyllie, Lucas, Carlson, Kitchens, Kozary and Zaki10–Reference Hedayatifar, Hassanibesheli, Shirazi, Farahani and Jafari12 This is a matter of distinguishing and prioritizing the network analysis approaches, compared to descriptive methods. Reference Marin, Wellman, Scott and Carrington13 The flow of information among relief teams and ways of communicating in the response phase was evaluated in many studies; Drawbacks, which were learned as a lesson, were also considered. Reference Comfort6,Reference Kapucu7,Reference Prizzia9,Reference Houghton, Baber and McMaster14–Reference Varda, Forgette, Banks and Contractor19 While coordination is an essential action in Disaster Risk Management (DRM), inconsistency among stakeholders has become 1 of the major recognized organizational challenges. Reference Mohammadfam, Bastani, Esaghi, Golmohamadi and Saee20 Analyzing the stakeholders’ roles and responsibilities are considered as the first step for establishing effective coordination and cooperation in the pre-disaster phase. Reference Prizzia9,Reference Mohammadfam, Bastani, Esaghi, Golmohamadi and Saee20
Planning and policy-making challenges could be eliminated by identifying the inter and intra coordination problems, and systems communication challenges. Reference Aboelela, Merrill, Carley and Larson5,Reference Hedayatifar, Bar-Yam and Morales21 A study was conducted to investigate the communication between the members of the Incident Command System in 2 different types of incidents. The authors showed that different types of communications affect the response quality and introduced a communication model. Reference Houghton, Baber and McMaster14,Reference Butts22 Effective response and recovery requires trust between governmental and non-governmental stakeholders at all levels, as well as in society. Reference Kapucu23
Iran’s World Risk Index was ranked high-risk based on the lack of coping capacities (80.35%). Reference Porter, Onnela and Mucha8 Due to its geographical location, topographical properties, and high vulnerability, Iran is prone to many hazards. Reference Kapucu7,Reference Safarpour, Fooladlou and Safi-Keykaleh24 As far as we know, no pre-disaster stakeholder’s interaction analysis in the field of DRM has been conducted based on the network analysis. A limited number of network analyses have also focused on the response phase in Iran. Reference Mohammadfam, Bastani, Golmohamadi, Saei and Es-Haghi17,Reference Mohammadfam, Bastani, Esaghi, Golmohamadi and Saee20 Hence, we used the network of DRM stakeholders as the first step for implementing the Sendai Framework. This method provides a visual and tangible image of the status and interrelationships among the stakeholders. It identifies groups with better interaction using community detection and modularity optimization methods. Centrality indices and quantitative results were used to interpret the interaction between the organizations, and to understand the blind spots of the links. Through understanding the relationships among various stakeholders, an opportunity will arise to plan for enhancing the level of stakeholders’ participation with weaker roles. The main aim of this study was to provide a visual and tangible picture of the status and interrelationships among the stakeholders of DRM. It helps policymakers to understand the strengths and weaknesses of the interactions among stakeholders and helps them plan to strengthen their roles and solve their problems.
Methods
There are 2 main organizations for DRM in Iran: National Disaster Management Organization (NDMO) and Civil Defense Organization (CDO). The NDMO has 14 specialized working groups, with diverse members according to their duties. A list of 52 organizations was prepared based on the members of these working groups. Data triangulation was used to enhance the data’s credibility. Reference Guion, Diehl and McDonald25 We, therefore, conducted a review of the literature, rules, and regulations related to DRM in December 2018; 11 organizations were added to the list as a result. A comprehensive review of the texts, rules, and regulations related to disaster risk management in Iran employed the use of keywords such as “Disaster management” or “Disaster risk management” or “Disaster risk reduction” and “Iran” were searched in Persian databases (Websites of National Institute of Health Research, National Disaster Management Organization, Ministry of Health, Tehran Disaster Mitigation and Management Organization, Islamic Parliament of Iran, Government of the Islamic Republic of Iran, Supreme Leader website, Ministry of Interior website, and Scientific Information database). We emailed the list to 32 DRM experts with an experience of more than 5 years in 1 of the DRM organizations. In observing ethical considerations, the participants were informed about the objectives and importance of the study. Participants were also reassured that the information obtained was for research purposes. The approval code to do the research, IR.TUMS.SPH.REC.1396.4315 was received on January 22, 2018. Following snowball, this list expanded to 85 and has remained unchanged after receiving the 19th response (28 experts responded to the email). The name and assigned number to each organization are presented in the supplementary.
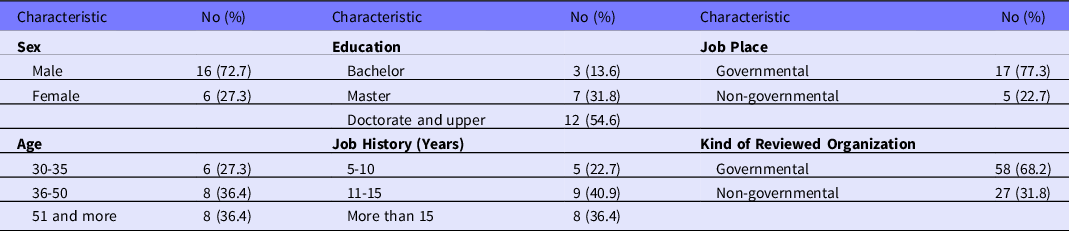
In the next step, a matrix was created in Excel software, in which its first column and row were the 85 organizations’ names. We emailed the list to 32 experts and asked them “Based on your opinion, how much is the current interaction level between each row and column?” During this round of Delphi, organizations’ interactions were rated based on the Likert scale (0-5: with 0 meaning a lack of interaction, and 5 meaning the maximum connection). This method is best known as the full-rank ordinal measures of relations. Reference Marin, Wellman, Scott and Carrington13 17 participants returned the completed matrix. After 2 reminder emails, the number of responding experts reached 22 (68.75% response rate). Table 1 shows the characteristics of the participants.
Characters of experts who participated in the Delphi process

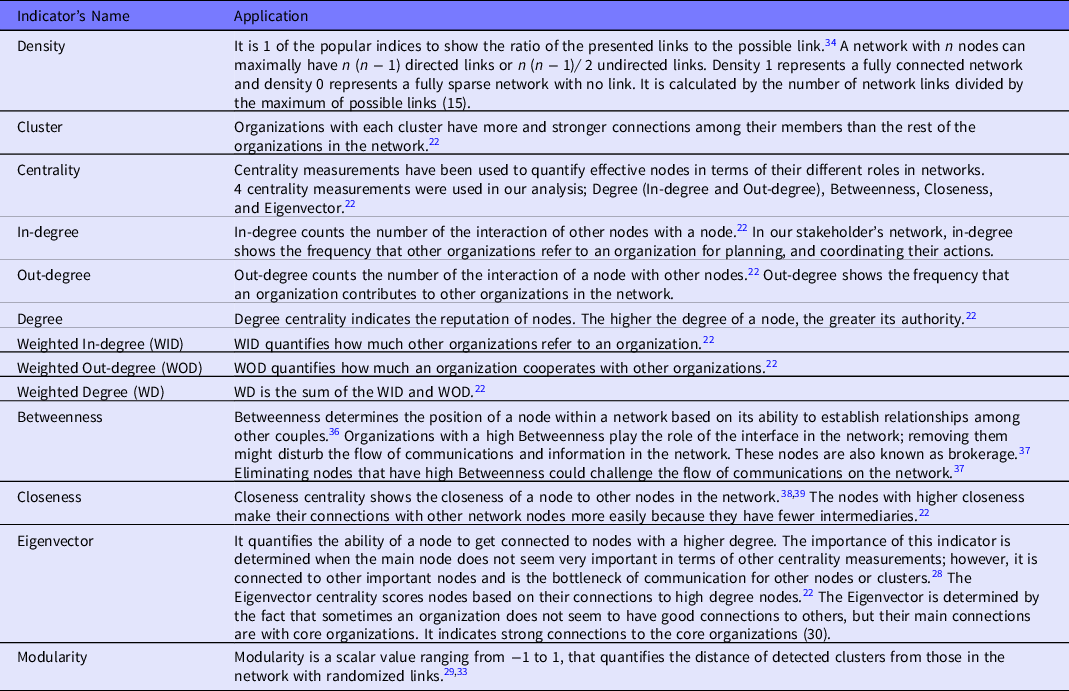
For data analysis, the responses were run through Python software and the corresponding networks were formed. Then, networks were visualized by Gephi software. In the network, organizations played the role of nodes (circles), and the relations were the links. Links were directed, and their weight shows the average score of each link in the 22 response sheets. In a directed network, In-Degree and Out-Degree can be different for each node. Since links in this network were weighted, Weighted Degree (WD), Weighted In-Degree (WIN), and Weighted Out-Degree (WOD) were also extracted. Table 2 shows the indices and their application that were used in this study. Due to the long name of the organizations, the numerical code was used instead of their name. The non-governmental sector was identified through bolder margin circles.
Name of indicators, their abbreviations, and applications in SNA

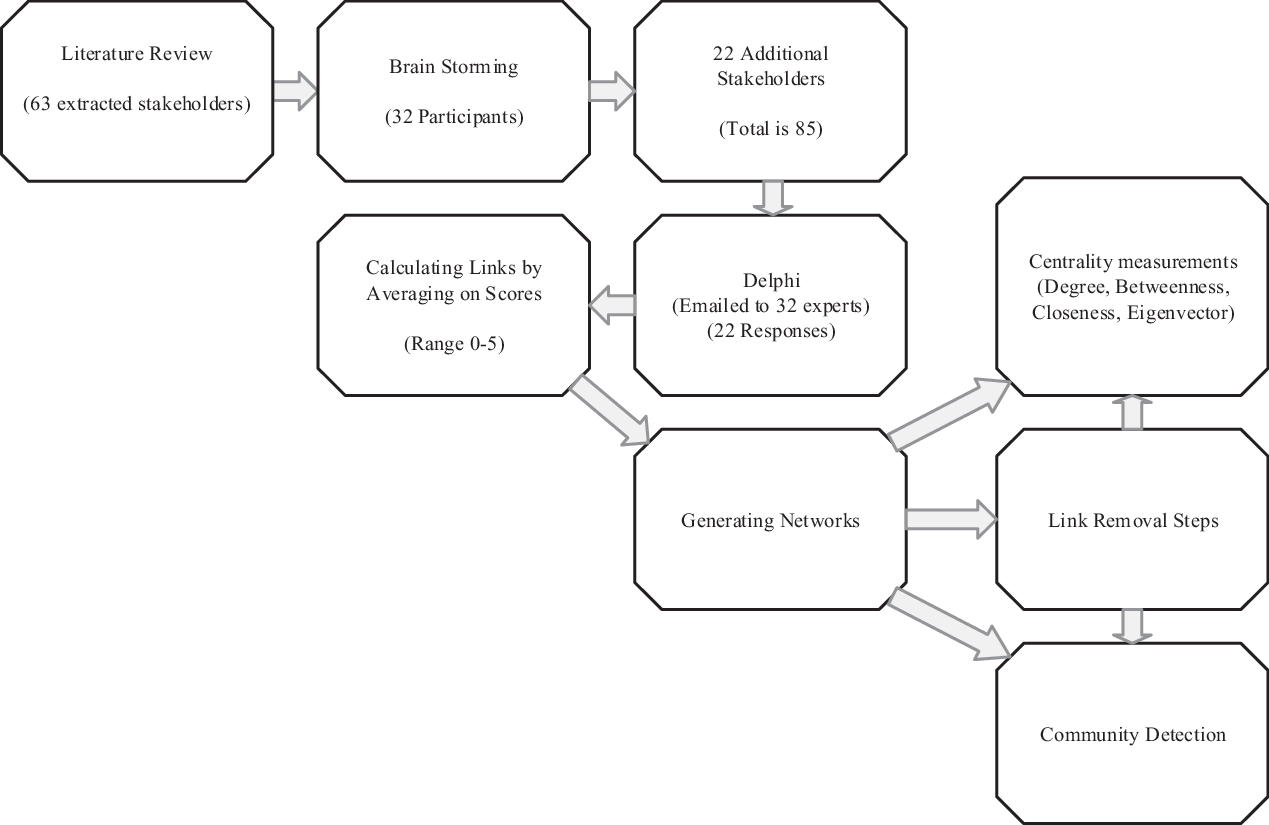
Subsequently, the clusters were determined by applying the Louvain method with modularity optimization. Reference Reichardt and Bornholdt26 In the first step, the Louvain algorithm considers all the nodes as single clusters. Iteratively, nodes join their neighboring clusters in the next steps to maximize modularity. Reference Blondel, Guillaume, Lambiotte and Lefebvre27 Then, weaker links were eliminated with the network reduction technique. In the sequential stages in order to view the backbone structure of the disaster management system of Iran and clusters of organizations that strongly interact with each other. Reference Wyllie, Lucas, Carlson, Kitchens, Kozary and Zaki10 This was conducted to identify organizations with weaker communications and to design interventions to ensure their cooperation. Due to the existence of multiple local minima in the Louvain algorithm, some variation in the assignment of nodes may occur between algorithm runs. Reference Favre, Brailly, Scott and Carrington28,Reference Barabási29 To quantify the stability of detected clusters and identify areas in which clusters overlap with each other, we generated an ensemble of multiple realizations and analyzed the borders of clusters in all the realizations. Reference Guion, Diehl and McDonald25 Figure 1 shows the summarized process of data preparation and analysis.
A schematic view of the process of data preparation and network analysis.

Results
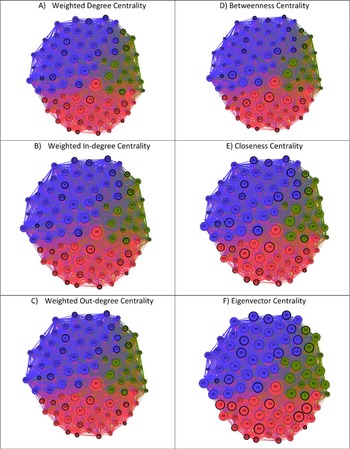
Out of 85 organizations involved in DRM in Iran, 58 were governmental, and the rest were non-governmental actors (Table 1). Figure 2 indicates that the directed DRM network has 5370 links out of a maximum of 7140 possible links (85 * 84). The density of the network was 0.75 which indicates the network is fairly connected, and most of the organizations have a reciprocal collaboration even though it is very low sometimes. Using the Louvain method, 3 clusters of organizations were detected (Figure 2). The members in each cluster belonged to a specific class of DRM, shown with a different color (Table 3). Links were colored based on the color of the origin and destination nodes. In each of the A-F panels in Figure 2, by changing the size of the nodes, we emphasized the role of the organizations based on different centrality indices. Panels A, B, and C were shown among all agencies; NDMO (30) from the operational and executive affairs cluster has the largest cooperation with other organizations in the system. Ministry of Communications and Information Technology (MCIT) (76), Iranian Red Crescent Society (IRCS) (16), and International Organizations (35) play a more important role in the network compared to the others. Most of these organizations are governmental. Figure 2-D shows that according to Betweenness measurement, the IRCS (16) and MCIT (76) organizations make the most of the connections among the organizations in the network. Figure 2-E focuses on the closeness of organizations to the most important agencies in the network. It is shown that most of the organizations were close to the core organizations reasonably and got notified soon about new changes or policies. Eigenvector in Figure 2-F shows there are only a few organizations on the network border, which are not connected well (For all details see supplementary 1).
Overview of network centrality indicators of Iran’s disaster risk management (85 organizations and 5370 links), with 3 clusters that have been identified through the modularity optimization methods that are shown with different colors. Each panel represents the importance of organizations regarding a centrality measurement (the title of the panels). Non-governmental stakeholders are also featured with the bolder margin nodes.

Clusters characteristics based on color, number of members, and class

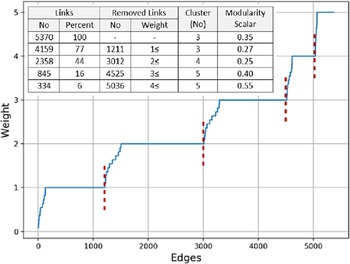
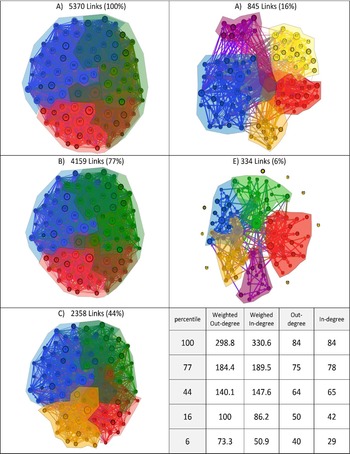
In order to see the backbone structure of the network, weaker links were removed in consequent steps. In Figure 3, we showed the link removal steps in the weighted network. Figure 4 represents the network structure with an emphasis on the weighted degree of the organizations during the link removal steps. Figure 4-A shows the whole network. By removing links ≤ 1, the network followed almost the same pattern as before (Figure 4-B). The number of clusters did not change at this point, but the number of organizations in each cluster, as well as the cluster of some organizations, changed. In the next steps, the number of clusters changed to 4 and 5, respectively, by removing the links weighing 0-2 and 0-3.
Number of edges that had weights less than or equal to the weights shown on y-axes. Red dashed lines represent the threshold of link removal in each stage. The inner table shows the total number of links, their percentage, number of removed links, and number of detected clusters.

Network view of Weighted Degree Centrality after Network graph reduction. Title of the panels represents the number and parentage of present links in the network after removing weak links. The right bottom table displays the centrality indicators in each of the stages of deletion.

In the last step, by keeping only the strongest links, > 5, the relationship of some organizations was completely interrupted. In the stages of deletion, NDMO (30), CDO (45), Center for Strategic Studies (66), Ministry of Health and Medical Education (MoHME) (47), and Ministry of Defense and Armed Forces Logistics (MDAFL) (1) showed an acceptable position in all stages which indicates their key role. In addition, some actors including the MCIT (76), the Guardian Council (28), and various Insurance Organizations (36) were among the important organizations which lost their position in the second step of link removal, indicating the most of their links are pretty weak and they do not play an effective role in this network.
Discussion
Comprehensive DRM is essential to reduce the consequences that result from a crisis. Reference Bahadori, Khankeh, Zaboli and Malmir30 It is defined as the management of all hazards through all phases of the disaster management cycle (prevention and mitigation, preparedness, response, recovery, and rehabilitation). Reference Cheema, Mehmood and Imran31
To apply a comprehensive approach, some measures must be performed in the preparedness phase to promote coordination between organizations. The coordination often begins before the occurrence of hazards, and all actors in this area must establish appropriate communication with other stakeholders following their duties. Reference Prizzia9,Reference Houghton, Baber and McMaster14,Reference Steelman, Nowell, Bayoumi and McCaffrey18,Reference Varda, Forgette, Banks and Contractor19 Hence, stakeholder identification and analysis are the prerequisites of coordination. Stakeholder identification and analysis is known as a planning and coordination tool, as well as a communication tool. Reference Bahadori, Khankeh, Zaboli and Malmir30 Policymakers use the results of a stakeholder analysis to develop their action plans. Besides, key organizations that are not in an appropriate position will be identified, and then interventions will be designed to address their problems. Reference Varvasovszky and Brugha32
Responsibility for DRM in Iran lies primarily with 2 organizations: CDO and NDMO. The CDO operates under the command of the General Staff of the Armed Forces, and NDMO affiliates with MoI. Integrated management of policy, planning, and coordination in the areas of implementation, research, and monitoring of DRM is considered as the aim of NDMO. It organizes the affected areas using the capacities of ministries, institutions, public and governmental companies, banks, insurance corporations, and community-based organizations. The DRM stakeholder‘s network of Iran shows acceptable consistency with a density of 0.75. This network had 3 clusters representing 3 different classes based on their nature: the red, blue, and green clusters involved in the operational and executive affairs, the theoretical basis of DRM, and the policy affairs, respectively (Figure 2, Table 2).
The NDMO (30) was the main organization in the red cluster with the highest degree. Other important members in this cluster were IRCS (16), MoHME (47), and IRIB (20), whose dominant activities are operational. Considering the NDMO political position and its reasonable links to the related organizations, it is sometimes classified in the blue cluster (Figure 4A). CDO (45) was the core organization in the blue cluster that had good connections with many organizations in the other clusters. It appeared as part of the blue cluster in all the realizations. This might result from the government’s comprehensive support for the activities of the CDO in Iran. This subject also has been emphasized in the 2nd goal of the Sendai framework that disaster risk governance at the national, regional, and global levels is of great importance for effective and efficient DRM. The members of this cluster were often major organizations that had an effective role in DRM, especially in the prevention and preparedness phase. It could be happening by defining clear visions, plans, and coordination within and across organizations, as well as the participation of relevant stakeholders (Figure 4A).
The green cluster had 16 constant members in all realizations e.g., Guardian Council (28), and MoI (3), which were among the most important organizations. Organizations that could be effective in financial support, like the Ministry of Economic Affairs and Finance (53) and Banks (7), were also placed in this cluster. The presence of these organizations, along with the policymakers, is an ideal position for policymaking and policy implementation (Figure 4A). The presence of national organizations, as the core member of all clusters, represents the dominant governmental role of national coordination in the DRM of Iran. Although it could be a strong point, DRR is a shared responsibility between governments and relevant stakeholders. In particular, non-governmental stakeholders play an important role as enablers in providing support to states, following national policies, laws, and regulations in the implementation of DRM at local, national, regional, and global levels. While borders of blue and red clusters were 80% consistent in all the realizations, in 20% of the realizations, the green cluster organizations were included in blue and red clusters (See Figure 4A).
By using the feature of central indicators, key organizations will be identified, and their capacities could help to solve problems and develop new and common programs. Reference Newman33 Figure 2 shows that in general, private organizations have lower centrality indicators than governmental organizations. This shows the fundamental role of the government in DRM in Iran.
Given the contribution of private organizations to services in Iran, the lowness of these indicators seems logical. However, the important point is the size of the nodes of government organizations such as the Ministry of Education (55) and the Iranian Blood Transfusion Organization (6). Since these organizations play a key role in DRM, their low centrality indicators are important. In this situation, the NDMO (30) as the main organization in this cluster, and organizations (IRCS, IRIB, and MoHE) 16, 47, and 20 with their high Betweenness, can help intermediate organizations to improve their performance. Figure 2F shows these organizations also have a high Eigenvector that can facilitate communication with key organizations if needed.
Unlike the red cluster, most members of the blue cluster are government ministries that are responsible for policy-making, and all Centrality indices are high (Figure 2). The role of organizations in this cluster is to lay the theoretical basis of DRM, and as a result, intermediaries with high Betweenness are needed to translate science into action. The low Betweenness index in these organizations could be due to the “Top to Down” approach to DRM policies in Iran. This means that important organizations do not consider the role of Street-Level Bureaucrats in the policy-making process and decide independently. Obviously, not paying attention to the Policy to Action chain can lead to a lot of unfulfilled policies. Reference Jackson34
The stakeholders of the Green Cluster are also mainly governmental, and nodes such as the Municipalities and Villages Administrators (40) according to their legal duties, must play their role in formulating community-based programs. Community-based DRM programs require appropriate communication with multiple stakeholders. However, with Betweenness, (see Figure 2D) it will be difficult to succeed in this task.
In Figure 4, colored polygons show the clusters, and overlapping areas represent the organizations that appear in other clusters. By identifying these organizations and considering the characteristics of each of their centrality indicators, the required intervention measures can be designed and implemented. Therefore, the IRIB (20) and the Militia Volunteer Force (85) in Figure 4A can help in this regard.
Removing weaker links, sequentially, reveals the isolated organization and, the backbone structure of the network and clusters. Reference Butts22 By removing links weighing ≤ 1 (77% or 4159 links remained), the network still had solid consistency and most organizations remained in their clusters (Figures 4A and B). While some organizations from the blue cluster relocated to the green cluster, the members of the red cluster, except NDMO (30), were the same. Figure 4A shows that the research centers (15) and NDMO (30) have the most interaction between blue and red clusters. Therefore, using organizational power, NDMO (30) along with organizational research ability (15) can facilitate the process of converting Word to Action.
The clusters were increased to 4 by removing links weighing ≤ 2 (44% or 2358 links remained) (Figure 4C). The blue cluster was mostly unchanged, indicating strong communication among its members while the other 2 clusters, in panels A and B in Figure 4, were divided into 3 clusters.
The Climatological Research Institute (44), Agricultural Economics Association (78), Water Resources Management Company (68), and Ministry of Agriculture (49) have been placed in the green cluster. These organizations could have joint activities in all areas of climate change and land use. Therefore, their placement in a cluster indicates their proper relationship and it could bring good results in the case of joint planning and using this opportunity. Also, IRIC (16), MoHME (47), UMS (14), and private hospitals (10) have common functions in the brown cluster in executive activities. Proper coordination between these organizations could improve the provision of services, especially in the response phase. Reference Houghton, Baber and McMaster14,Reference Butts22 This coordination should take place in the working group meetings, joint programs, and operational exercises before the occurrence of the incident so determining organizational duties, expectations, monitoring, and evaluation strategies are inevitable. Reference Comfort6,Reference Wyllie, Lucas, Carlson, Kitchens, Kozary and Zaki35
In the next step (Figure 4D), the number of clusters was increased to 5 by deleting links of weight ≤ 3 (16% or 845 links remained). This network was still connected, so this issue shows that all organizations have at least some strong cooperation with organizations inside the network.
The nature of organizations’ tasks in the mustard cluster like IRIB (20), CBOs (23), and Ministry of Culture and Islamic Guidance (2) shows they could do effective measures to promote public awareness. In the case of proper planning, this would allow access to the first objective of the Sendai Framework which is disaster risk understanding. 3
In the purple cluster, the relationship of involved organizations in climate change shows their strength and coherence. Nevertheless, it does not have an effective relationship with the yellow and mustard clusters. However, tackling climate change requires education and culture-making to prevent and deal with the consequences. UMS (14), MoHME (47), and the Commission of health in parliaments (77) in the yellow cluster are considered the most important organizations which have significant roles in climate change. Therefore, NDMO must strengthen its role to facilitate communication between these clusters.
Finally, links with a weight ≤ 4 (6% or 334 links have remained) were deleted (Figure 4E). Following this, although the number of clusters did not change, the relationship of 8 organizations was completely interrupted by the network. Some of the disfigured organizations included Iran Small Industries and Industrial Parks Organization (8), Islamic Revolution Housing Foundation (9), and Ministry of Education (6). Despite their undeniable role in this area, they can challenge DRM, if there is no plan to enhance their communication, especially for prevention. This is because according to the Sendai Framework, it is necessary to communicate and cooperate closely with stakeholders, including indigenous people, volunteers, and owners of the professions, for designing and implementing policies, programs, and standards. 3 For example, the Ministry of Education (6), as a vital infrastructure, has a significant effect on community resilience. 3 A resilient community is able to resist, absorb, accommodate, and recover from the effects of a hazard in a timely and effective manner. Schools play an effective role, as educational poles, and also could be used as evacuation places at the response phase. Reference Blondel, Guillaume, Lambiotte and Lefebvre27 Besides, DRR should be incorporated into educational policies to be used for promoting educational systems to transfer training into the community. Reference Newman33 The mustard cluster members were active in the military field and were most closely related to the blue one. The logical high centrality indices of CDO (45) are a strong point, and reviewing the links confirms the authority of this organization among the 4 other clusters.
NDMO (30) had conditions similar to CDO (45) in the green cluster. However, CDO (45) receives most of its communication from the mustard cluster, while NDMO (30) receives links from all clusters in a balanced manner. As a result, this organization can facilitate the CDO (45) communication with others.
Briefly, the strength of the DRM network in Iran is due to the presence of cohesion clusters, in which particular groups work with their members. In parallel, they cooperate with members of other groups. Moreover, the presence of multiple core organizations, which have been spread across all clusters, shows that a single core organization is not responsible for the overall management of events. Nevertheless, NDMO and CDO could theoretically play the role of cores in the network. Also, the multi-core networks can reduce the time of activation the system when a disaster happens and let them get coherent in a short time. Reference Comfort6 Besides, the findings indicate that despite the high density in the network, there are weaknesses in the communications of some organizations. Therefore, tangible upgrades will be achieved if network communications of DRM stakeholders are improved. Network analysis provides a large amount of information in a visual view that any organization can use based on its organizational tasks and position on the network. In addition, responsible organizations, policymakers, and decision makers can properly identify network bottlenecks and make the most of them.
Conclusions
Traditionally DRR has been the responsibility of the government in Iran, while it is a shared responsibility of the government and relevant stakeholders. So, the governments can use SNA and centrality indices for planning and policymaking, developing regulations, and building culture. We should therefore define the organizational tasks, and the participatory plan should be defined to strengthen DRM, and implement the Sendai Framework based on the network interpretation. Of course, the transparent process of accountability, monitoring, evaluation, and reporting on the progress of programs should also be explained.
Moreover, SNA could provide a visual and tangible image of the inter-relationships among the stakeholders, and identify groups with better interaction using community/cluster detection, and modularity optimization in different issues. Using SNA helps every stakeholder to identify the weaknesses and strengths of its organizational relationships, and also assists organizations to improve their performance in addressing problems arising from disasters.
Limitations
In Iran, many organizations are involved in disaster risk management. Due to the fact that determining the level of communication of this number of organizations was very time consuming, it was difficult to attract the participation of the participants. Hence, by sending follow-up emails 3 times, the number of participants gradually reached 22.
Acknowledgment
We wish to thank all the researchers who helped us in this study.
Authors’ Contributions
AA, AT, and HYK conceived and designed the study. HYK and BS conducted data collection. HYK and LH carried out data analysis and interpretation. HYK, AT, and AO drafted the manuscript. AA and AT supervised the whole process of research and are guarantors. All authors have read and approved the final draft of the manuscript.
Funding
The authors did not receive any funds for this study.
Competing interests
We declare that neither the authors nor their organizations have any conflict of interest in the publication of this paper.
Ethics Approval and Consent to Participate
This research was approved by the Tehran University of Medical Sciences’ Institutional Review Board (IRB). The IRB follows the stipulated clauses of the Helsinki Declaration. In observing ethical considerations, the participants were informed about the objectives and importance of the study. As this part of the research was based on Delphi and response to emails, responding to the email was considered as consent by the research participants. Participants were also reassured that the information obtained was for research purposes. The approval code to do the research is Ir.tums.sph.rec.1396.4315, and was received on January 22, 2018.
Supplementary Material
To view supplementary material for this article, please visit https://doi.org/10.1017/dmp.2021.167