


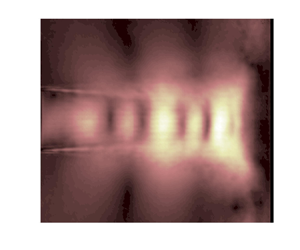



1. Introduction
It has been well recognized that subsonic and underexpanded jets perpendicularly impinging on a flat plate usually generate intense discrete tones (Powell Reference Powell1953; Tam & Ahuja Reference Tam and Ahuja1990; Edgington-Mitchell Reference Edgington-Mitchell2019). By varying the impinging distance  $H$ or the ideally expanded jet Mach number
 $M_j$, the tonal frequency exhibits a staging phenomenon (Umeda, Maeda & Ishii Reference Umeda, Maeda and Ishii1987). It is widely accepted that discrete tones are generated due to a feedback mechanism between the large-scale coherent structures travelling downstream from the jet nozzle to the impinging plate and some forms of disturbances propagating upstream from the impinging plate to the nozzle (Tam & Ahuja Reference Tam and Ahuja1990; Panickar & Raman Reference Panickar and Raman2007). The stability features of high-speed jets not only play a role in the transition of jet flows to turbulence but also are an important component in understanding noise radiation by high-speed jets (Morris Reference Morris2010). The downstream-travelling component in the aeroacoustic feedback loop for impinging tones is generally thought to be the Kelvin–Helmholtz (K–H) wavepacket (Jordan & Colonius Reference Jordan and Colonius2013) and extracts energy from the mean flow to maintain the feedback loop (Tam & Ahuja Reference Tam and Ahuja1990). The upstream-propagating waves that close the feedback loop of impinging jets have also been investigated in previous studies. Wagner (Reference Wagner1971) and Neuwerth (Reference Neuwerth1974) carried out experimental studies on the flow field inside and outside the impinging jets and observed that feedback waves can propagate upstream inside the jet column. In the experimental investigations of Ho & Nosseir (Reference Ho and Nosseir1981) and Nosseir & Ho (Reference Nosseir and Ho1982), the large-scale coherent structures generate noise only when they impinge on the plate and the upstream-propagating free-stream acoustic waves outside of the jets are assumed to close the aeroacoustic feedback loop. The upstream-propagating guided jet mode was first identified by Tam & Hu (Reference Tam and Hu1989). These guided jet waves are defined by the dispersion relation of the vortex-sheet jet model (Lessen, Fox & Zien Reference Lessen, Fox and Zien1965) and classified into different modes depending on their radial and azimuthal wavenumbers. Tam & Ahuja (Reference Tam and Ahuja1990) and Tam & Norum (Reference Tam and Norum1992) respectively proposed that the upstream-propagating guided jet modes are related to the impingement tones of subsonic circular jets and supersonic rectangular jets. Furthermore, the numerical and experimental results of Panickar & Raman (Reference Panickar and Raman2007), Gojon, Bogey & Marsden (Reference Gojon, Bogey and Marsden2016), Bogey & Gojon (Reference Bogey and Gojon2017) and Jaunet et al. (Reference Jaunet, Mancinelli, Jordan, Towne, Edgington-Mitchell, Lehnasch and Girard2019) suggested that the frequencies and the axisymmetric or helical nature of the impingement tones can be explained by the properties of the guided jet modes.
The guided jet modes are proposed to play important roles in other kinds of acoustic resonance, such as the screech tones of underexpanded free jets (Edgington-Mitchell et al. Reference Edgington-Mitchell, Jaunet, Jordan, Towne, Soria and Honnery2018; Gojon, Bogey & Mihaescu Reference Gojon, Bogey and Mihaescu2018; Mancinelli et al. Reference Mancinelli, Jaunet, Jordan and Towne2019; Edgington-Mitchell et al. Reference Edgington-Mitchell, Wang, Nogueira, Schmidt, Jaunet, Duke, Jordan and Towne2021a, Reference Edgington-Mitchell, Li, Liu, He, Wong, Mackenzie and Nogueira2022) and the acoustic resonance near the nozzle of subsonic free jets (Schmidt et al. Reference Schmidt, Towne, Colonius, Cavalieri, Jordan and Brès2017; Towne et al. Reference Towne, Cavalieri, Jordan, Colonius, Schmidt, Jaunet and Brès2017). Via a high-fidelity large-eddy simulation and linear stability analyses, three types of jet modes are identified. The upstream- and downstream-propagating duct-like acoustic modes experience the shear layer as a pressure-release surface and are confined in the jet potential core. Another upstream-propagating acoustic mode represents a weak coupling between the jet core and free stream (Towne et al. Reference Towne, Cavalieri, Jordan, Colonius, Schmidt, Jaunet and Brès2017). Within restricted frequency bands, both downstream- and upstream-propagating guided jet waves can exist in  $0.82< M_j<1$ jets, and can interact with each other. These jet modes provide additional ways for energy transfer and resonance possibilities in subsonic jets are more numerous. The cut-on and cut-off frequencies of the guided jet modes accurately predict the tonal frequencies detected outside of the jet. Thus, the guided jet modes might be important to the dynamic and acoustic properties of subsonic free jets (Towne et al. Reference Towne, Cavalieri, Jordan, Colonius, Schmidt, Jaunet and Brès2017). In a recent study, Bogey (Reference Bogey2021) investigated the generation of tones in free jets at
 $0.5< M_j<2$ via a series of numerical simulations. Over this whole
 $M_j$ range, the peak frequencies lie within the frequency bands of the free-stream upstream-propagating guided jet modes. Recently, Varé & Bogey (Reference Varé and Bogey2022) showed that the upstream-propagating free-stream modes are also active in the aeroacoustic feedback loops of an
 $M_j=0.9$ jet that impinge on a plate with and without a hole. Moreover, Jordan et al. (Reference Jordan, Jaunet, Towne, Cavalieri, Colonius, Schmidt and Agarwal2018) experimentally studied the problem of jet–flap interaction noise. They suggested that the strongest tones are due to the coupling between the K–H waves and two kinds of upstream-travelling guided jet modes.
In the preceding studies, it is indicated that the upstream-propagating free-stream guided jet mode plays an important role in the aeroacoustic feedback loops of subsonic and supersonic impinging jets. However, to the best of the authors’ knowledge, the effect of duct-like guided jet modes in acoustic resonance has not been confirmed yet, especially in the  $M_j$ range of
 $[0.82, 1.00]$ where both downstream- and upstream-propagating duct-like guided jet modes are propagable. With an increase of nozzle pressure ratio (NPR), subsonic jets transform into underexpanded jets. Shock-cell structures appear in the core regions of jets and screech tones might be produced. It is interesting to study whether slightly underexpanded impinging jets can generate both impingement tones and screech tones simultaneously and the similarity and difference between the feedback loops of these two kinds of acoustic resonance. The interaction between the K–H wavepacket and shock-cell structures would redistribute energy to other modulation wavenumbers (Tam & Tanna Reference Tam and Tanna1982; Edgington-Mitchell et al. Reference Edgington-Mitchell, Wang, Nogueira, Schmidt, Jaunet, Duke, Jordan and Towne2021a; Nogueira et al. Reference Nogueira, Self, Towne and Edgington-Mitchell2022b). It is also unclear whether the guided jet modes that are involved in the acoustic feedback loops of impingement tones are modulated by shock-cell structures.
In the present paper, the acoustic resonance mechanism of subsonic and slightly underexpanded impinging jets is investigated by performing acoustic measurements and schlieren visualizations. The focus of the present study is to identify the roles that different kinds of guided jet modes play in the acoustic resonance of subsonic impinging jets and the characteristics of acoustic resonance loops of screech and impinging tones when subsonic jets transform into underexpanded jets. The jets issue from a convergent nozzle with an exit diameter  $D=10$ mm and the
 $M_j$ range of jets is [0.70, 1.12]. The distances between the nozzle exit and the impinging plate are from 4
 $D$ to 6
 $D$, where
 $D$ is the nozzle diameter. The experimental results of cases with an impinging distance of 5
 $D$ are investigated in detail and conclusions are examined and generalized by other experimental results. The paper is organized as follows. In § 2, we present the experimental set-up and the post-processing methods of schlieren imaging. Different kinds of guided jet modes supported in subsonic and underexpanded jets are introduced briefly. In § 3, the results of acoustic measurements and schlieren visualizations are presented. Direct experimental evidence is provided to identify the different types of jet modes and acoustic feedback loops in subsonic impinging jets. Then, the mechanism of different kinds of acoustic resonance in slightly underexpanded impinging jets is analysed. Finally, concluding remarks are given in § 4.
2. Experimental set-up, post-processing methods and guided jet modes in subsonic jets
2.1. Experimental set-up
The experimental facility and instruments used in the present study are shown in figure 1 and introduced in detail in prior literature (Li et al. Reference Li, Liu, Hao, Zhang and He2021). Thus, only some important parameters are presented here. These facilities are optimized for schlieren visualizations and not anechoic. The cases considered here are cold jets issuing from a converging nozzle which possesses an exit diameter  $D$ of 10 mm and a contraction ratio of 6.25 : 1. The external lip thickness of the nozzle is 5 mm. The inner wall of the nozzle is smooth and the jets are not tripped. The impingement plate downstream of the nozzle exit is a circular aluminium plate with a diameter of 50.0
 $D$. In the present experiments, the nozzle-to-plate distance (
 $H$) is set from 4.0
 $D$ to 6.0
 $D$. The NPR is defined as the ratio between the plenum and the ambient pressures
 $p_0/p_\infty$ and ranges from 1.39 to 2.20. The plenum pressure
 $p_0$ is measured by a pressure transducer which is located 5
 $D$ upstream of the nozzle exit. The fully expanded jet Mach number
 $M_j$ is calculated via the classical isentropic relation and the range of
 $M_j$ is from 0.70 to 1.12. The Reynolds number
 $Re_D = \rho _j U_j D / \mu _j$ ranges from
 $1.57\times 10^5$ to
 $2.25\times 10^5$, where
 $\rho _j$,
 $U_j$ and
 $\mu _j$ are respectively ideally expanded jet density, velocity and dynamic viscosity.
Schematics of (a) the test facility and (b) the nozzle and impinging plate.

A 1/4-inch diameter microphone (Ono Sokki MI-1531) and a preamplifier (Ono Sokki MI-3140) are used to conduct acoustic measurements. The microphone is located at an angle of 150 $^{\circ }$ (measured from the downstream axis) and a distance of
 $40D$ from the jet impinging point. The microphone is calibrated by a sound calibrator (Ono Sokki SC-3120) prior to experiments. The acoustic signals are analysed by using a Fast Fourier transform analyser (Ono Sokki CF-9400). Fast Fourier transform analysis provides the noise spectra with the highest frequency of 100 kHz. A Hanning window function with
 $50\,\%$ overlap is used. These noise spectra are averages of 625 samples. The frequency resolution of noise spectra is 62.5 Hz. Time-resolved schlieren images are obtained using a Photron Fastcam SA-Z high-speed camera. The frame rate of the camera is set as 80 000 frames per second. At this frame rate, the schlieren images are recorded with an array size of
 $640\times 360$ pixels. About 45 pixels are contained in the range of the nozzle diameter. By considering the frame rate and the light intensity, the exposure time is set as 6.25
 $\mathrm {\mu }$s. The knife edge is set perpendicular to the jet axis. Variations of axial density gradients integrated along the optical path are observed in the current schlieren images.
2.2. Decomposition of schlieren data
The time-resolved schlieren image sequences contain a wealth of information about the flow dynamics (Edgington-Mitchell et al. Reference Edgington-Mitchell, Weightman, Lock, Kirby, Nair, Soria and Honnery2021b). Spectral proper orthogonal decomposition (SPOD) introduced by Aaron, Schmidt & Tim (Reference Aaron, Schmidt and Tim2017) is a model analysis method to extract coherent structures or modes from experimental and computational flow data. Each SPOD mode oscillates at a single frequency. The SPOD method combines the advantages of dynamic mode decomposition (Schmid Reference Schmid2010) in terms of the temporal correlation among the resulting modes with the optimality and orthogonality of standard POD (Schmidt & Colonius Reference Schmidt and Colonius2020). Here, in order to extract the information in schlieren images that are associated with the acoustic resonance of impinging jets, SPOD is applied on the greyscales of schlieren sequences  $\boldsymbol{\mathsf{G}}$. The specific algorithm for computing SPOD modes from flow snapshots can be found in Aaron et al. (Reference Aaron, Schmidt and Tim2017) and Schmidt & Colonius (Reference Schmidt and Colonius2020). For the sake of completeness, the algorithm is outlined here briefly. The vector
 $\boldsymbol {g}_i \in \mathbb {R}^N$ represents the greyscales of a schlieren image at time
 $t_i$, which we call a snapshot of the flow. The length
 $N$ of the vector is the number of pixels in a schlieren image. Now,
 $M$ flow snapshots with an equal time spacing are recorded by the high-speed camera. These data set can be represented by the data matrix
 \begin{equation} \boldsymbol{\mathsf{G}} = [\boldsymbol{g}_1, \boldsymbol{g}_2, \ldots, \boldsymbol{g}_M] \in \mathbb{R}^{N\times M}. \end{equation}
Subsequently,  $\boldsymbol{\mathsf{G}}$ is divided into a set of smaller and overlapping blocks as follows:
 \begin{equation} \boldsymbol{\mathsf{G}}^{(n)} = [\boldsymbol{g}^{(n)}_1, \boldsymbol{g}^{(n)}_2, \ldots, \boldsymbol{g}^{(n)}_{N_f}] \in \mathbb{R}^{N\times N_f}, \end{equation}
where  $\boldsymbol{\mathsf{G}}^{(n)}$ is the
 $n$th block consisting of
 $N_f$ flow snapshots. The
 $i$th entry in
 $\boldsymbol{\mathsf{G}}^{(n)}$ is
 $\boldsymbol {g}_{i+(n-1)(N_f-N_o)}$, where
 $N_o$ is the number of snapshots by which the blocks overlap. The total number of blocks
 $N_b$ can be calculated as
 $\lfloor (M-N_o)/(N_f-N_o)\rfloor$, where
 $\lfloor \cdot \rfloor$ denotes the floor operator. The discrete Fourier transform is computed for each block in the temporal direction. To reduce spectral leakage, a Hanning window is used in the present analyses. Here
 $\boldsymbol {\hat {g}}^{(n)}_j$ is the Fourier component at a frequency
 $f_j$ in the
 $n$th block. All realizations at a given frequency
 $f_j$ are collected into the new data matrix
 \begin{equation} \hat{\boldsymbol{\mathsf{G}}}_{f_j} = [\boldsymbol{\hat{g}}^{(1)}_j, \boldsymbol{\hat{g}}^{(2)}_j, \ldots, \boldsymbol{\hat{g}}^{(N_b)}_j]. \end{equation}
The SPOD eigenvectors and eigenvalues are obtained by solving the following eigenvalue problem:
 \begin{equation} \hat{\boldsymbol{\mathsf{G}}}_{f_j}^* \boldsymbol{\mathsf{W}} \hat{\boldsymbol{\mathsf{G}}}_{f_j} \boldsymbol{\varTheta}_{f_j}= \boldsymbol{\varTheta}_{f_j} \boldsymbol{\varLambda} _{f_j}, \end{equation}
where  $\boldsymbol{\mathsf{W}}$ is the weight matrix. Then, the SPOD modes for a given
 $f_j$ can be obtained from the eigenvectors
 $\boldsymbol {\varTheta }_{f_j}$ as
 $\boldsymbol {\hat {\varPsi }}_{f_j} = \hat {\boldsymbol{\mathsf{G}}}_{f_j} \boldsymbol {\varTheta }_{f_j} \boldsymbol {\varLambda }_{f_j}^{-1/2}$ and the diagonal matrix of eigenvalues
 $\boldsymbol {\varLambda }_{f_j}$ contains the energy of the SPOD modes.
Coherent structures at a specific frequency  $f_j$ are contained in the SPOD modes
 $\boldsymbol {\hat {\varPsi }}_{f_j}$. These structures can be associated with a broad range of wavenumbers. The discrete Fourier transform in the jet axial direction is conducted on a chosen SPOD mode
 $\boldsymbol {\hat {\psi }}_{f_j}(x,y)$. Within the axial domain defined as
 $[x_1,x_2]$, the spatial Fourier coefficients
 $\boldsymbol {I}_{f_j,k}(\kern0.7pt y)$ are obtained by
 \begin{equation} \boldsymbol{I}_{f_j,k}(\kern0.7pt y)= \sum_{x=x_1}^{x_2} \boldsymbol{\hat{\psi}}_{f_j}(x,y)\, \mathrm{e}^{-{\rm i}kx}, \end{equation}
where  $k$ is the axial wavenumber and
 ${\rm i}=\sqrt {-1}$. In the present study, the axial domain for the streamwise Fourier decomposition is from the nozzle exit (
 $X/D=0$) to the impinging plate.
Bispectral mode decomposition (BMD) (Schmidt Reference Schmidt2020) is a direct means of educing flow structures that are associated with triadic interactions from experimental or numerical data. In the present study, the interaction between the flow structures at different frequencies of acoustic resonance is analysed by BMD. The dataset used in BMD is similar to that applied in SPOD. Here, the complex mode spectrum  $\lambda _1 (f_k,f_l)$, the bispectral mode
 $\boldsymbol {\phi }_{f_k + f_l}(x,y)$, the cross-frequency field
 $\boldsymbol {\phi }_{f_k \circ f_l}(x,y)$ and the interaction map
 $\boldsymbol {\varpi }_{f_k + f_l}(x,y)$ are obtained based on the algorithm introduced in Schmidt (Reference Schmidt2020). Here
 $\lambda _1 (f_k,f_l)$ quantifies the triadic interaction of the frequency triplet
 $(f_k, f_l, f_k+f_l)$,
 $\boldsymbol {\phi }_{f_k + f_l}(x,y)$ represents the spatial structure of the triadic interaction,
 $\boldsymbol {\phi }_{f_k \circ f_l}(x,y)$ is a map of the phase alignment between
 $f_k$ and
 $f_l$ components that may not directly be observed and
 $\boldsymbol {\varpi }_{f_k + f_l}(x,y)$ indicates regions of activity of the triadic interaction (Schmidt Reference Schmidt2020; Schmidt & Oberleithner Reference Schmidt and Oberleithner2023).
2.3. Overview of guided jet modes in high-speed jets
The resonance mechanism of impinging jets is accomplished by upstream- and downstream-propagating waves. Besides the well-known K–H instability wave that is referred to as the  $k^+_{KH}$ wave hereafter, several kinds of guided jet modes investigated by Towne et al. (Reference Towne, Cavalieri, Jordan, Colonius, Schmidt, Jaunet and Brès2017) and Schmidt et al. (Reference Schmidt, Towne, Colonius, Cavalieri, Jordan and Brès2017) are supported in subsonic and supersonic jets. These guided jet modes are introduced briefly here based on the vortex-sheet model (Lessen et al. Reference Lessen, Fox and Zien1965; Tam & Hu Reference Tam and Hu1989) and referring to Jordan et al. (Reference Jordan, Jaunet, Towne, Cavalieri, Colonius, Schmidt and Agarwal2018). The dispersion relation of the vortex-sheet model is written as
 \begin{equation} \frac{1}{\left(1-\dfrac{kM_a}{\omega } \right)^2} + \frac{1}{T_a} \frac{I_m \left(\dfrac{\gamma_i}{2}\right) \left[\dfrac{\gamma_o}{2}K_{m-1}\left(\dfrac{\gamma_o}{2}\right) +mK_m\left(\dfrac{\gamma_o}{2}\right)\right]}{K_m \left(\dfrac{\gamma_o}{2}\right)\left[\dfrac{\gamma_i}{2} I_{m-1}\left(\dfrac{\gamma_i}{2}\right) +mI_m \left(\dfrac{\gamma_i}{2}\right)\right]} = 0\end{equation}
and
 $$\begin{gather} \gamma_i = \sqrt{k^2 - \frac{1}{T_a} (\omega - M_ak)^2}, \end{gather}$$
 $$\begin{gather}\gamma_o = \sqrt{k^2 - \omega^2}. \end{gather}$$
Here, all quantities have been normalized by the nozzle diameter  $D$ and the ambient sound velocity
 $a_ \infty$. Functions
 $I_m$ and
 $K_m$ are modified Bessel functions of the first kind and the second kind, respectively. Parameter
 $M_a = U_j / a_\infty$ is the acoustic Mach number and
 $T_a = T_j /T_\infty$ is the temperature ratio. The relation between
 $M_j$ and
 $M_a$ is
 $M_j = M_a /\sqrt {T_a}$. For given values of wavenumber
 $k$ and azimuthal wavenumber
 $m$, the dispersion relation has many real roots or eigenvalues. These eigenvalues can be classified by
 $m$ and the radial wavenumber
 $n$ (Tam & Ahuja Reference Tam and Ahuja1990). For convenience, the jet mode which corresponds to the
 $m$th azimuthal mode and the
 $n$th radial mode is designated by
 $(m,n)$, where
 $m = 0, 1, 2, \ldots$ and
 $n = 1, 2, 3, \ldots\,$. The pressure eigenfunctions of guided jet modes are given by
 \begin{equation} p_i = I_0(\gamma_i r)\ (0\leq r/D \leq 0.5) , \quad p_o = AK_0(\gamma_o r) \ ( r/D > 0.5).\end{equation}
These two functions are matched at  $r/D=0.5$ by the coefficient
 $A$.
The dispersion relations of the ( $0,1$) guided jet modes are obtained from the vortex-sheet jet model and displayed in figure 2(a). The guided jet mode that is coloured green in figure 2 is a kind of downstream-propagating wave and is mainly trapped in the potential core of the jet (Towne et al. Reference Towne, Cavalieri, Jordan, Colonius, Schmidt, Jaunet and Brès2017). This wave only exists in the Mach number range of
 $M_j \geq 0.82$ and over a restricted range of frequencies. For
 $0.82 \leq M_j\leq 1.00$, this wave is propagable in the frequency range between the red and black circles in figure 2(a). And for
 $M_j > 1.00$, this wave is supported below the frequencies of the black circles. This guided jet mode is referred to as the
 $k^+_{T}$ wave hereafter. There are three kinds of upstream-propagating guided jet modes. The guided jet mode coloured purple in figure 2 was first discussed by Tam & Hu (Reference Tam and Hu1989) and is denoted as the
 $k^-_{TH}$ wave in the present paper. This wave exists over the Mach number range of
 $M_j< 0.82$ (Towne et al. Reference Towne, Cavalieri, Jordan, Colonius, Schmidt, Jaunet and Brès2017). The second upstream-propagating wave (coloured black in figure 2) exists over the Mach number range of
 $0.82 \leq M_j\leq 1.00$ and is mainly trapped in the potential core of the jet like the
 $k^+_{T}$ wave. This wave is distinguished from the
 $k^-_{TH}$ wave because it becomes evanescent below a well-defined frequency (the red circles in figure 2a). This wave is denoted as the
 $k^-_{d}$ wave. The red circle in figure 2(a) is the saddle point where the eigenvalues of the
 $k^+_{T}$ wave and the
 $k^-_{d}$ wave coalesce. This kind of saddle point is denoted as S1 and defines the ‘cut-on’ frequencies of the
 $k^+_{T}$ wave and the
 $k^-_{d}$ wave. The third upstream-travelling wave (coloured blue in figure 2) is the discrete free-stream mode which presents a weak coupling between the jet core and the free stream (Towne et al. Reference Towne, Cavalieri, Jordan, Colonius, Schmidt, Jaunet and Brès2017). This wave is distinguished from the
 $k^-_{TH}$ wave because it becomes evanescent above a well-defined frequency (the black circles in figure 2) and is denoted as the
 $k^-_{p}$ wave in the present paper. The black circle in figure 2(a) is denoted as saddle point S2, at which the eigenvalues of the
 $k^+_{T}$ wave and the
 $k^-_{p}$ wave coalesce. Saddle point S2 defines the ‘cut-off’ frequencies of the
 $k^+_{T}$ wave and the
 $k^-_{p}$ wave.
(a) Vortex-sheet dispersion relations of ( $0,1$) guided jet modes in the range of
 $0.70\leq M_j\leq 1.12$. Here
 $St_D = f\kern 0.06em D / U_j$,
 $f$ is the frequency,
 $D$ is the nozzle diameter,
 $U_j$ is the ideally expanded jet velocity and
 $k$ is the axial wavenumber. (b) Schematic depiction of guided jet modes supported by cylindrical vortex sheet; colours correspond to those of (a).

3. Results and discussion
3.1. Frequency spectra of acoustic measurements and SPOD eigenvalues of schlieren images
The acoustic experiments in the present study are not conducted in an anechoic environment. The purpose of these measurements is to obtain the frequencies and relative intensities of discrete tones. The results of the acoustic measurements are shown in figure 3. The tonal frequencies obtained from the present experiments have good agreement with the experimental and numerical results of prior literature, which indicates that the current experimental environment has no significant influence on the acoustic resonance of impinging jets. With an increase of  $M_j$, the frequencies of discrete tones exhibit several stages. For subsonic impinging jets, along a single frequency stage, the tones are more intense in the limited frequency band for which the duct-like (
 $0,1$)
 $k^+_{T}$ wave is supported in the potential core of the jets (between the red and black lines in figure 3). Near the cut-off frequencies of the (
 $0,1$)
 $k^-_{p}$ wave (the black lines in figure 3), tones become weaker and finally disappear. This implies that the
 $k^+_{T}$ and
 $k^-_{p}$ waves should play important roles in the acoustic resonance loops at these tonal frequencies. Except for the second harmonic of the strongest tones, only weak tones exist above the cut-off frequencies of the (
 $0,1$)
 $k^-_{p}$ wave. When
 $M_j$ is around 1.10, besides the tones belonging to the frequency stages extended from subsonic jets, the jets produce some tones whose frequencies are close to those of the screech tones of the underexpanded free jets at the same
 $M_j$. These tones are more distinct when
 $H/D\geq 5$. The similarity and difference between the acoustic resonance of the impingement tones and screech tones, and the interaction between the flow structures at the frequencies of these two kinds of tones are studied in detail in the following content.
Contours of the sound pressure level (SPL) as a function of  $M_j$ for impinging jets of (a)
 $H/D=4.0$, (b)
 $H/D=4.5$, (c)
 $H/D=5.0$, (d)
 $H/D=5.5$ and (e)
 $H/D=6.0$. The black circles indicate the screech frequencies of underexpanded free jets in the experiments of Li et al. (Reference Li, Liu, Hao, Zhang and He2021). The grey crosses and white squares indicate the tonal frequencies of subsonic impinging jets in the experiments of Ho & Nosseir (Reference Ho and Nosseir1981) and Panickar & Raman (Reference Panickar and Raman2007), respectively. The magenta triangles indicate the tonal frequencies of subsonic impinging jets from the numerical simulations of Varé & Bogey (Reference Varé and Bogey2023). The black and red solid lines respectively correspond to the black and red circles in figure 2.

The flow snapshots of the impinging jets with  $H/D=5.0$ and different
 $M_j$ are shown in figure 4. These snapshots are not strict ‘instantaneous’ flow fields because of the exposure time of 6.25
 $\mathrm {\mu }$s. As shown in figure 4(a–c), the bright and dark regions are mainly associated with the
 $k^+_{KH}$ waves. For the three subsonic impinging jets that are shown in figure 4, the
 $k^+_{KH}$ waves are nearly symmetric with respect to the jet axis. The analyses in the following sections show that the axisymmetric flow structures are dominant at the frequencies of impinging tones for these three jets. As shown in figure 4(d), several shock cells appear in the core of underexpanded impinging jets.
Flow snapshots for the  $H/D=5$ jets at (a)
 $Mj = 0.85$, (b)
 $Mj = 0.90$, (c)
 $Mj = 0.95$ and (d)
 $Mj = 1.11$.

In order to obtain the coherent flow structures that are associated with the acoustic resonance of impinging jets, SPOD is applied to the schlieren image sequences. In the present analysis,  $M=2560$ snapshots are used in each case. In the present range of
 $M_j$, the non-dimensional time step between consecutive snapshots
 $\Delta t U_j/ D$ ranges from 0.29 to 0.43. The range of the corresponding maximum resolvable non-dimensional frequency is from 1.72 to 1.16. Parameters
 $N_f$ (size of each data block) and
 $N_o$ (overlap between two consecutive blocks) are respectively set as 512 and 384 (
 $0.75N_f$), resulting in a total of
 $N_b = 17$ SPOD modes at each frequency. The
 $St_D$ of the acoustic resonances that are investigated specifically in the following content are in the range from 0.25 to 0.65. The non-dimensional time span of one block is more than 100, which includes dozens of periods of acoustic resonance.
In the present study, different types of acoustic feedback loops are investigated by combining the results of acoustic measurements and time-resolved schlieren image sequences. The roles that different kinds of guided jet modes play in acoustic feedback loops are identified. For the sake of simplicity, the cases of  $H/D=5.0$ are studied in detail and the experimental results of other nozzle-to-plate distances are used to examine and generalize the conclusions. The noise spectra and the SPOD eigenvalue spectra of some cases of
 $H/D=5$ are shown in figure 5. The peak tones in the noise spectra all correspond to the peaks in the distributions of the eigenvalues of the first SPOD modes. And at tonal frequencies, the first SPOD modes are obviously more energetic than the second and third SPOD modes. These results indicate that the flow structures at tonal frequencies possess more energy and show a low-rank dynamic feature. Therefore, in the following sections, the structures of acoustic feedback loops are investigated mainly based on the first SPOD modes at tonal frequencies. A complete comparison between the noise spectra and the spectra of the first SPOD eigenvalues for the
 $H/D=5$ jets is shown in figure 6. The spectra of SPOD eigenvalues are normalized by the maximum eigenvalue at each
 $M_j$. The circles in figure 6(a) locate some peaks identified in the SPOD spectra, and are overlaid on the acoustic data to demonstrate the close correspondence between these two kinds of spectra. Some typical cases are selected to investigate the acoustic resonance of impinging jets. As shown in figure 2, when
 $M_j<0.82$, only the upstream-propagating
 $k^-_{TH}$ wave is supported in jets (Towne et al. Reference Towne, Cavalieri, Jordan, Colonius, Schmidt, Jaunet and Brès2017). The case of the
 $M_j=0.80$ jet is chosen to study the features of the
 $k^-_{TH}$ wave and the acoustic feedback loops in this condition. The resonance frequencies of the
 $M_j=0.80$ jet are indicated by the white circles in figure 6. The
 $M_j=0.85$,
 $0.90$ and
 $0.95$ jets produce the impinging tones at a single frequency stage, as shown by the grey circles in figure 6. These three tones are also marked by the blue circles in figure 5. The tones of the
 $M_j=0.85$ and
 $0.95$ jets are obviously weaker than that of the
 $M_j=0.90$ jet. By combining the cases of the
 $M_j=0.85$,
 $0.90$ and
 $0.95$ jets, the evolutionary process of acoustic resonance loops with an increase of
 $M_j$ in a single frequency stage is investigated. The
 $M_j=1.11$ jet generates an impingement tone at
 $St_D=0.26$ and a screech tone at
 $St_D=0.65$. Furthermore, a tone is also produced at
 $St_D=0.39$, which is the difference between the above two tonal frequencies. These three resonance frequencies of the
 $M_j=1.11$ jet are indicated by the black circles in figure 6. The resonance mechanism of these three tones is investigated in the following sections. The tonal frequencies of the above-mentioned cases are listed in table 1.
Some examples of the SPOD energy spectra and acoustic spectra for the  $H/D=5$ jets: (a)
 $M_j = 0.85$, (b)
 $M_j = 0.90$ and (c)
 $M_j = 0.95$. The black, grey and light-grey lines respectively indicate the SPOD eigenvalues of the first three SPOD modes. The red lines indicate the noise spectra. The blue circles indicate the resonance frequencies that are studied in the following sections.

Frequency spectra as a function of  $M_j$ from (a) acoustic measurements and (b) SPOD of schlieren measurements. The circles indicate the resonance frequencies that are studied in the following sections. The black and red solid lines respectively correspond to the black and red circles in figure 2.

Frequencies of acoustic resonance in the selected cases.

3.2. Acoustic feedback loops and guided jet modes for  $M_j<0.82$ jets

In this section, the characteristics of the acoustic feedback loops of  $M_j<0.82$ jets are analysed. Firstly, discrete Fourier transforms in temporal and streamwise directions are applied to the fluctuating greyscales at the jet axis. And the normalized frequency–wavenumber spectra for the
 $M_j = 0.70$, 0.75 and 0.80 jets are displayed in figure 7. As shown in figure 7, in negative wavenumber domains, the empirical dispersion relations extracted from the schlieren data have good agreement with the dispersion relations of the (
 $0,1$)
 $k_{TH}^-$ wave from the vortex-sheet model (2.6). And in positive wavenumber domains, the averaged convection velocities of the
 $k_{KH}^+$ waves are all around 0.65
 $U_j$ for these three cases. Due to the acoustic resonance mechanism, the flow structures that constitute acoustic feedback loops are enhanced. As displayed in figure 7(c), the amplitudes of the
 $k_{TH}^-$ and
 $k_{KH}^+$ waves at the tonal frequencies (the red squares) are obviously higher than those at neighbouring frequencies.
Frequency–wavenumber spectra of the fluctuating greyscales along  $Y/D=0$ for the (a)
 $M_j = 0.70$, (b)
 $M_j = 0.75$ and (c)
 $M_j = 0.80$ jets. The colour contours provide the empirical dispersion relations for the waves supported by the jets. The dispersion relations of the (
 $0,1$) guided jet modes obtained from the vortex-sheet model are plotted in the same way as in figure 2. The dashed lines represent the waves with constant group and phase velocities equal to the labelled values. Some resonance frequencies of the
 $M_j=0.80$ jet are shown by the red squares in (c).

The structures of acoustic resonance loops at tonal frequencies are investigated based on the SPOD results of the  $M_j=0.80$ jet. The first SPOD modes at four resonance frequencies of the
 $M_j=0.80$ jet are displayed in figure 8. As presented by the real parts of these four SPOD modes, the coherent flow structures are nearly symmetric with respect to the jet axis at these frequencies of acoustic resonance, which corresponds to the azimuthal feature of the (
 $0,1$)
 $k_{TH}^-$ wave. The normalized amplitude fields of these modes exhibit axial modulations of greyscales. These spatial modulations are due to the presence of the standing-wave pattern (Bogey & Gojon Reference Bogey and Gojon2017; Edgington-Mitchell Reference Edgington-Mitchell2019) at the tonal frequencies. The standing-wave pattern contains integral numbers of anti-nodes between the nozzle exit and the impinging plate which is also the number of concurrent waves in the acoustic feedback loop (Gojon et al. Reference Gojon, Bogey and Marsden2016; Bogey & Gojon Reference Bogey and Gojon2017). As shown in figure 8(a), four anti-nodes of the standing-wave pattern can be observed inside the jet column and along the jet shear layer. The radial amplitude distributions of standing-wave patterns change with an increase of frequencies. In figure 8(d), the high-amplitude region of the standing-wave pattern is mainly confined to the potential core of the jet. This evolution process of the standing-wave patterns might be associated with the radial features of the waves that constitute the acoustic feedback loops.
The first SPOD modes of the  $M_j=0.80$ jet at (a)
 $St_D=0.38$, (b)
 $St_D=0.44$, (c)
 $St_D=0.50$ and (d)
 $St_D=0.53$. The left-hand panel of each pair is the real part of the SPOD mode. Blue scales indicate negative values and yellow scales indicate positive values. The right-hand panel of each pair is the normalized amplitude field of the SPOD mode. The colour scales range from 0 (blue) to 1 (yellow).

All the flow structures presented in a chosen SPOD mode oscillate at a single frequency. These flow structures are associated with a broad range of wavenumbers (Edgington-Mitchell et al. Reference Edgington-Mitchell, Wang, Nogueira, Schmidt, Jaunet, Duke, Jordan and Towne2021a). In order to study the wavenumbers and radial features of the waves that constitute the acoustic feedback loops, the SPOD modes shown in figure 8 are decomposed in the streamwise direction at each radial position via discrete Fourier transforms. The normalized wavenumber spectra at the resonance frequencies are displayed in figure 9. The most energetic parts are located in the positive wavenumber domain which is related to the  $k^+_{KH}$ waves. In the present paper, the wavenumber of the
 $k^+_{KH}$ wave is defined as the wavenumber corresponding to the maximum amplitude in the positive wavenumber domain. Based on the vortex-sheet model, the
 $k^-_{TH}$ wave is the only kind of the guide jet mode that is supported by the
 $M_j=0.80$ jet. The wavenumbers of the
 $k^-_{TH}$ waves obtained from the vortex-sheet model are displayed as the solid purple lines in figure 9. In the negative wavenumber domains of figure 9, the high-amplitude regions gradually depart from
 $-k_a$ with increasing frequencies, which agrees with the evolution process of the wavenumber of the
 $k^-_{TH}$ wave. Here, the experimental wavenumber of the
 $k^-_{TH}$ wave is defined as the wavenumber corresponding to the maximum amplitude in the negative wavenumber domain. The specific wavenumbers of different waves are listed in table 2.
Normalized wavenumber spectra for the first SPOD modes of the  $M_j=0.80$ jet at (a)
 $St_D=0.38$, (b)
 $St_D=0.44$, (c)
 $St_D=0.50$ and (d)
 $St_D=0.53$. The solid purple lines indicate the wavenumbers of the
 $k^-_{TH}$ waves obtained from the vortex-sheet model. The dashed red lines indicate the wavenumbers of the
 $k^+_{KH}$ waves based on the schlieren data. The dashed yellow lines indicate the wavenumbers of
 $k_a=-\omega /a_\infty$.

Wavenumbers of the  $k^+_{KH}$ and
 $k^-_{TH}$ waves obtained from the SPOD modes at
 $St_D=0.38$, 0.44, 0.50 and 0.53 of the
 $M_j=0.80$ jet. The wavenumbers of the
 $k^-_{TH}$ waves from the vortex-sheet model are listed in parentheses.

The vortex-sheet eigenfunctions  $|p|$ of the
 $k^-_{TH}$ waves are obtained by (2.9a,b) based on the eigenvalues of the vortex-sheet model listed in table 2. The amplitudes at the experimental wavenumbers of
 $k^-_{TH}$ in figure 9 are considered as the experimentally educed radial distributions of the
 $k^-_{TH}$ waves. In figure 10, the experimentally educed
 $k^-_{TH}$ waves are compared with the vortex-sheet eigenfunctions
 $|p|$. The good agreement between the experimental and the theoretical results indicates that the radial features of the (
 $0,1$)
 $k^-_{TH}$ waves can be extracted by processing the data of time-resolved schlieren images. Note that variations of axial density gradients integrated along the optical path are displayed in the current schlieren images. The comparison between the vortex-sheet eigenfunctions
 $|p|$ and the radial distributions of amplitudes in wavenumber spectra should be qualitative. Nevertheless, the radial features of guided jet modes (trapped in the jet core or supported outside the jet shear layer) can still be reflected by the present experimental results. With increasing frequency, the
 $k^-_{TH}$ wave becomes progressively trapped. These results explain the variations in the radial features of the standing-wave patterns which are displayed in figure 8 and provide the first direct visual evidence for the results of theoretical analyses in Jordan et al. (Reference Jordan, Jaunet, Towne, Cavalieri, Colonius, Schmidt and Agarwal2018).
Comparison of experimentally educed  $k^-_{TH}$ waves (red lines) with the vortex-sheet eigenfunctions
 $|p|$ (black lines) for the
 $M_j=0.80$ jet at (a)
 $St_D=0.38$, (b)
 $St_D=0.44$, (c)
 $St_D=0.50$ and (d)
 $St_D=0.53$.

3.3. Evolution of acoustic resonance with increasing $M_j$ for subsonic impinging jets

There are five anti-nodes in the standing-wave pattern at  $St_D=0.44$ for the
 $M_j=0.80$ jet in figure 8(b). As shown in figure 6, the jets with higher
 $M_j$ also generate impinging tones along this frequency stage. The changes in SPLs of tones along this frequency stage can be found in figure 6(a). With an increase of
 $M_j$, the SPLs of impinging tones are higher when the tonal frequencies fall in the frequency range where the
 $k^+_T$ wave is supported. Then, the impinging tones gradually become weaker and finally disappear at the cut-off frequencies of the
 $k^+_T$ and
 $k^-_p$ waves. The present results of acoustic measurements agree with the conclusions of Jaunet et al. (Reference Jaunet, Mancinelli, Jordan, Towne, Edgington-Mitchell, Lehnasch and Girard2019) indicating that guided jet modes are involved in the acoustic feedback process of impinging jets. The discussion of the acoustic feedback loop in Jaunet et al. (Reference Jaunet, Mancinelli, Jordan, Towne, Edgington-Mitchell, Lehnasch and Girard2019) is based on the prediction of resonance frequencies. In this section, the evolution of the acoustic resonance in subsonic impinging jets with increasing
 $M_j$ is analysed by combining the time-resolved schlieren data and the vortex-sheet model.
As shown in figure 6, the impinging tones at  $St_D=0.42$ of the
 $M_j=0.85$ jet, at
 $St_D=0.40$ of the
 $M_j=0.90$ jet and at
 $St_D=0.38$ of the
 $M_j=0.95$ jet fall on the same frequency stage. These three resonance frequencies are selected to analyse the evolution of acoustic resonance at tonal frequencies. For the
 $M_j=0.85$, 0.90 and 0.95 jets, the frequency–wavenumber spectra of the fluctuating greyscales at the jet axis are shown in figure 11 and compared with the dispersion relations of different kinds of guided jet modes obtained from the vortex-sheet model. The resonance frequencies discussed in this section are indicated by the red squares. In the negative wavenumber domains of spectra, the high-amplitude regions approximate the dispersion relations of (
 $0,1$) guided jet modes with good accuracy, and in the positive wavenumber domains, the convection velocities of the
 $k^+_{KH}$ wave are around
 $0.65U_j$. The amplitudes of the
 $k^+_{KH}$ wave and guided jet modes at resonance frequencies are higher than those at neighbouring frequencies. As shown in figure 11(a), at the resonance frequency
 $St_D=0.42$ of the
 $M_j=0.85$ jet, the
 $k^+_{T}$ wave is not supported by the jet. The high-amplitude region in the negative domain is around the wavenumber of the
 $k^-_p$ wave. As displayed in figure 11(b), the
 $k^+_T$ wave is supported by the
 $M_j=0.90$ jet at
 $St_D=0.40$. At this resonance frequency, the high-amplitude regions in the negative wavenumber domain are around the wavenumbers of the
 $k^-_p$ and
 $k^+_T$ waves, respectively. As shown in figure 11(c), the high-amplitude region in the negative wavenumber domain is distributed over a broad wavenumber range at the tonal frequency
 $St_D=0.38$ of the
 $M_j=0.95$ jet. The above results give a preliminary indication that, along a single frequency stage, different kinds of guided jet modes are involved in the acoustic resonance at tonal frequencies with an increase of
 $M_j$.
Frequency–wavenumber spectra of the fluctuating greyscales along  $Y/D=0$ for the (a)
 $M_j = 0.85$, (b)
 $M_j = 0.90$ and (c)
 $M_j = 0.95$ jets. The colour contours provide the empirical dispersion relations for the waves supported by the jets. The dispersion relations of the (
 $0,1$) guided jet modes obtained from the vortex-sheet model are plotted in the same way as in figure 2. The dashed lines represent the waves with constant group and phase velocities equal to the labelled values. Some resonance frequencies are shown by the red squares.

Spectral proper orthogonal decomposition is conducted on the schlieren data of the  $M_j=0.85$, 0.90 and 0.95 jets to extract the flow structures that are associated with acoustic resonance. The first SPOD modes at the chosen three resonance frequencies are shown in figure 12. The real parts of the SPOD modes in figure 12 illustrate that axisymmetric coherent structures are dominant at resonance frequencies. These three tones are located in the same frequency stage, and near the jet shear layer, five anti-nodes in the standing-wave patterns are observed in the normalized amplitude fields of figures 12(a) and 12(b). However, there are nearly no standing-wave patterns in figure 12(c). This indicates that the acoustic resonance at
 $St_D=0.38$ of the
 $M_j=0.95$ jet is weaker, corresponding to the weaker tone at this condition. For the
 $M_j=0.85$ jet, as shown in figure 12(a), the scales of axial modulations are similar in the jet shear layer and in the jet core region. As displayed in figure 12(b), the scales of axial modulations in the jet shear layer are obviously different from those in the jet core region at the tonal frequency of the
 $M_j=0.90$ jet, which means different waves are involved in the acoustic resonance of the
 $M_j=0.85$ and 0.90 jets, especially in the jet core.
The first SPOD modes at (a)  $St_D=0.42$ of the
 $M_j=0.85$ jet, at (b)
 $St_D=0.40$ of the
 $M_j=0.90$ jet and at (c)
 $St_D=0.38$ of the
 $M_j=0.95$ jet. The left-hand panel of each pair is the real part of the SPOD mode. Blue scales indicate negative values and yellow scales indicate positive values. The right-hand panel of each pair is the normalized amplitude field of the SPOD mode. The colour scales range from 0 (blue) to 1 (yellow).

To obtain the specific wavenumbers and radial amplitude distributions of the waves that are involved in the acoustic feedback loops, one-dimensional spatial Fourier transforms are applied to the SPOD modes that are shown in figure 12 along the axial direction at each radial position. The resultant wavenumber spectra are shown in figure 13. The wavenumbers of the  $k^+_T$ and
 $k^-_p$ waves obtained from the vortex-sheet model are also displayed in figure 13. At the present three resonance frequencies, the wavenumbers of the
 $k^-_p$ waves are very close to the wavenumbers of the upstream-propagating free-stream acoustic waves. Thus, the solid blue lines and the dashed yellow lines in figure 13 are nearly overlapped. As shown in figure 13(a), only one high-amplitude region is located in the negative wavenumber domain around the wavenumber of the
 $k^-_p$ wave and has amplitudes both inside and outside of the jet core. Nevertheless, at the resonance frequency of the
 $M_j=0.90$ jet, besides the high-amplitude region corresponding to the
 $k^-_p$ wave, there is another high-amplitude region around the wavenumber of the
 $k^+_T$ wave in figure 12(b). Here, the experimental wavenumbers of the
 $k^-_p$ and
 $k^+_T$ waves are the wavenumbers corresponding to the local extremums in figure 13 closest to the wavenumbers of the
 $k^-_p$ and
 $k^+_T$ waves from the vortex-sheet model, respectively. The specific wavenumbers of the
 $k^+_{KH}$,
 $k^-_p$ and
 $k^+_T$ waves are listed in table 3. The experimental wavenumbers of the
 $k^-_p$ and
 $k^+_T$ waves approximate to the corresponding theoretical results with good accuracy. For the
 $M_j=0.95$ jet, no specific waves with negative wavenumbers are energized by the acoustic resonance, as shown in figure 13(c). Thus, the experimental wavenumbers of guided jet modes are not obtained from figure 13(c).
Normalized wavenumber spectra for the first SPOD modes at (a)  $St_D=0.42$ of the
 $M_j=0.85$ jet, at (b)
 $St_D=0.40$ of the
 $M_j=0.90$ jet and at (c)
 $St_D=0.38$ of the
 $M_j=0.95$ jet. The solid blue lines indicate the wavenumbers of the
 $k^-_{p}$ waves obtained from the vortex-sheet model. The dashed green lines indicate the wavenumbers of the
 $k^+_{T}$ waves obtained from the vortex-sheet model. The dashed red lines indicate the wavenumbers of the
 $k^+_{KH}$ waves based on the schlieren data. The dashed yellow lines indicate the wavenumbers of
 $k_a=-\omega /a_\infty$.

Wavenumbers of the  $k^+_{KH}$,
 $k^-_{p}$ and
 $k^+_{T}$ waves obtained from the SPOD modes at
 $St_D=0.42$ of the
 $M_j=0.80$ jet, at
 $St_D=0.40$ of the
 $M_j=0.90$ jet and at
 $St_D=0.38$ of the
 $M_j=0.95$ jet. The wavenumbers of the
 $k^-_{p}$ and
 $k^+_{T}$ waves from the vortex-sheet model are listed in parentheses.

The radial amplitude distributions are extracted at the experimental wavenumbers of the  $k^-_p$ and
 $k^+_T$ waves in figure 13 and compared with the eigenfunctions of the
 $k^-_p$ and
 $k^+_T$ waves that are obtained by (2.9a,b). As shown in figure 14, the experimental and theoretical radial features of the
 $k^-_p$ and
 $k^+_T$ waves are coincident. The
 $k^+_T$ wave is radially confined to the potential core, and the
 $k^-_p$ wave represents a weak coupling between the jet core and the free stream (Towne et al. Reference Towne, Cavalieri, Jordan, Colonius, Schmidt, Jaunet and Brès2017). Moreover, in figure 11(b), the
 $k^+_T$ wave at
 $St_D=0.40$ is significantly more energized than those at neighbouring frequencies. The above results further indicate that the
 $k^+_T$ wave is involved in the acoustic resonance of subsonic impinging jets. As a kind of downstream-propagating guided jet mode, the
 $k^+_T$ wave constitutes an acoustic resonance loop with the upstream-propagating
 $k^-_p$ wave (Towne et al. Reference Towne, Cavalieri, Jordan, Colonius, Schmidt, Jaunet and Brès2017).
Comparison of experimentally educed guided jet modes (red lines) with the vortex-sheet eigenfunctions  $|p|$ (black lines) for (a) the
 $k^-_{p}$ wave at
 $St_D=0.42$ of the
 $M_j=0.85$ jet, (b) the
 $k^-_{p}$ wave at
 $St_D=0.40$ of the
 $M_j=0.90$ jet and (c) the
 $k^+_{T}$ wave at
 $St_D=0.40$ of the
 $M_j=0.90$ jet.

According to the above analyses, at the frequencies of impinging tones in a single frequency stage, a type of acoustic resonance is formed between the  $k^+_{KH}$ wave and the
 $k^-_p$ wave (Jaunet et al. Reference Jaunet, Mancinelli, Jordan, Towne, Edgington-Mitchell, Lehnasch and Girard2019; Varé & Bogey Reference Varé and Bogey2023). The features of acoustic resonance change with an increase of
 $M_j$. When the tonal frequency falls in the frequency range in which the
 $k^+_T$ wave is supported by jets, the
 $k^+_T$ wave and the
 $k^-_p$ wave can constitute another kind of acoustic resonance, and the
 $k^+_T$ wave is stimulated by this resonance loop. Furthermore, when the tonal frequencies approach the cut-off frequencies of the
 $k^+_T$ and
 $k^-_p$ waves, the acoustic resonance becomes weaker and the waves that constitute the acoustic resonance cannot be identified from the present experimental results.
As mentioned above, different types of acoustic resonance are formed at the frequencies of impinging tones. The connections between the impinging tones and different types of acoustic resonance are analysed in terms of the phase criteria of acoustic feedback loops. Here, the phase criterion of the acoustic resonance between the  $k^+_{KH}$ and
 $k^-_p$ waves (Jaunet et al. Reference Jaunet, Mancinelli, Jordan, Towne, Edgington-Mitchell, Lehnasch and Girard2019) is written as
 \begin{equation} \Delta k_{KHp} = k^+_{KH} - k^-_p = \frac{2N_{KHp}{\rm \pi}}{L} - \phi_{KHp}.\end{equation}
Similarly, the phase criterion of the acoustic resonance between the  $k^+_{T}$ and
 $k^-_p$ waves is expressed as
 \begin{equation} \Delta k_{Tp} = k^-_p - k^+_{T} = \frac{2N_{Tp}{\rm \pi}}{L} - \phi_{Tp}.\end{equation}
Terms  $\phi _{KHp}$ and
 $\phi _{Tp}$ account for additional delay associated with different components in acoustic feedback loops. Length
 $L$ is the axial length of the acoustic feedback loop and is assumed to be equal to the nozzle-to-plate distance
 $H$ here. Parameters
 $N_{KHp}$ and
 $N_{Tp}$ are integers, which are the numbers of concurrent disturbances in acoustic feedback loops at any moment (including both upstream- and downstream-propagating waves) (Edgington-Mitchell Reference Edgington-Mitchell2019). For the sake of simplicity, the K–H wave is considered to be non-dispersive. Based on the results listed in table 3, the wavenumber of the
 $k^+_{KH}$ wave is calculated using
 $U_c=0.6U_j$. The wavenumbers of the
 $k^-_p$ and
 $k^+_{T}$ waves are obtained from the vortex-sheet model. Terms
 $\phi _{KHp}$ and
 $\phi _{Tp}$ are assumed to be 0, i.e. the in-phase resonance criterion (Jordan et al. Reference Jordan, Jaunet, Towne, Cavalieri, Colonius, Schmidt and Agarwal2018) is considered. The method of determination of
 $\Delta k_{KHp}$ and
 $\Delta k_{Tp}$ is depicted in figure 15.
The dispersion relation obtained from the vortex-sheet model for the  $M_j = 0.90$ jet. The dispersion relations are plotted in the same way as in figure 2.

The predicted tonal frequencies are compared with the results of acoustic measurements for different  $H/D$ in figure 16. The frequencies that are predicted by using (3.1) with different
 $N_{KHp}$ (the dash-dotted lines in figure 16) follow well the changes of resonance frequencies with an increase of
 $M_j$, even though there are some differences between the predicted frequencies and experimental results. More accurate predictions would be obtained if the reflection coefficients at the nozzle exit plane and the impinging plate are taken into consideration (Jordan et al. Reference Jordan, Jaunet, Towne, Cavalieri, Colonius, Schmidt and Agarwal2018; Mancinelli et al. Reference Mancinelli, Jaunet, Jordan and Towne2021). Thus, the generation of impinging tones is due to the acoustic resonance between the
 $k^+_{KH}$ and
 $k^-_p$ waves.
Contours of the SPL as a function of  $M_j$ for impinging jets of (a)
 $H/D=4.0$, (b)
 $H/D=4.5$, (c)
 $H/D=5.0$, (d)
 $H/D=5.5$ and (e)
 $H/D=6.0$. The black and red solid lines respectively correspond to the black and red circles in figure 2. The black dotted lines indicate the tonal frequencies predicted by (3.2) with
 $N_{Tp}=1$. The dash-dotted lines indicate the tonal frequencies predicted by (3.1) with different
 $N_{KHp}$.

For the impinging distances considered in the present paper, the impinging tones are intenser when the tonal frequencies fall in the frequency range in which the  $k^+_T$ wave is supported by jets. As shown in figure 16, impinging tones become weaker when the tonal frequencies approach the cut-off frequencies of the
 $k^+_T$ and the
 $k^-_p$ waves. The phase criteria of the acoustic feedback loop of the
 $k^+_{KH}$ and
 $k^-_p$ waves predict well the frequencies of impinging tones (Jaunet et al. Reference Jaunet, Mancinelli, Jordan, Towne, Edgington-Mitchell, Lehnasch and Girard2019), but cannot explain the changes in the intensities of impinging tones. In the above analyses, the impinging tone of the
 $M_j=0.90$ jet is intenser, and the
 $k^+_T$ and the
 $k^-_p$ waves constitute an acoustic feedback loop at the tonal frequency. It can be inferred that the acoustic resonance between the
 $k^+_T$ and the
 $k^-_p$ waves has an influence on the intensities of impinging tones. As shown in figure 15, in the frequency range where the
 $k^+_T$ wave exists in jets,
 $\Delta k_{Tp}$ is reduced with an increase of the frequency. Here
 $N_{Tp}=1$ is viewed as an extreme condition in which the resonance of the
 $k^-_p$ and
 $k^+_{T}$ waves can occur. The frequencies calculated by (3.2) with
 $N_{Tp}=1$ are shown by the black dotted lines in figure 16. Impinging tones become significantly weak at the black dotted lines. Above the black dotted lines in figure 16,
 $N_{Tp}<1$, the resonance between the
 $k^-_p$ and
 $k^+_T$ waves cannot be established. The above results indicate that impinging tones are generated by a feedback loop involving the
 $k^+_{KH}$ and
 $k^-_p$ waves. When the acoustic resonance between the
 $k^+_T$ and the
 $k^-_p$ waves is formed at tonal frequencies, impinging tones are intenser.
3.4. Impingement tones and screech tones for slightly underexpanded impinging jets
With an increase of NPR, impinging jets gradually get into underexpanded states. It is well known that underexpanded free jets generate a screech tone due to the appearance of shock cells in the jet core (Edgington-Mitchell Reference Edgington-Mitchell2019). Figure 17 shows the noise spectra of the  $M_j=1.11$ jets (
 ${\rm NPR}=2.15$) with different nozzle-to-plate distances
 $H$. The frequencies of screech tones are associated with the NPR (
 $M_j$) of jets. Thus, as shown by the white circles in figure 17, the screech frequencies of the
 $M_j=1.11$ jets are almost identical at different
 $H/D$. The frequencies of impinging tones (the black circles in figure 17) exhibit some frequency stages with the increase of
 $H$. Moreover, there is another kind of tone at the frequency difference of screech and impinging tones, as shown by the grey circles in figure 17. In this section, the mechanisms of the above-mentioned three kinds of tones are discussed based on the case of the
 $M_j=1.11$ jet at
 $H/D=5$.
Contours of the SPL as a function of  $H/D$ for the
 $M_j=1.11$ impinging jets. The cut-off frequency of the (
 $0,1$)
 $k^-_p$ and
 $k^+_T$ waves is indicated by the black line. The white circles indicate the frequencies of screech tones. The black circles indicate the frequencies of impinging tones in axisymmetric modes. The differences between the frequencies of impinging tones and screech tones are indicated by the greycircles.

Figure 18 shows the frequency–wavenumber spectrum of the fluctuating greyscales at the jet axis of the  $M_j=1.11$ jet. The red squares in figure 18 indicate three tonal frequencies. As displayed in figure 6, the tonal frequency at
 $St_D=0.26$ falls on a frequency stage of impinging tones, and the resonance frequency at
 $St_D=0.65$ is consistent with the screech frequency of the free jet at the same
 $M_j$, as shown in figure 3(c). Here
 $St_D=0.39$ is the frequency difference between the above-mentioned two kinds of tones. In the positive wavenumber domain, the convection velocities of the
 $k^+_{KH}$ waves at different frequencies are about 0.65
 $U_j$. At the selected three resonance frequencies in figure 18, the
 $k^+_{KH}$ waves are stronger. The interaction between the K–H wave and shock cells will transfer energy to the wavenumbers
 $k^+_{KH} \pm k_s$, where
 $k_s$ is the wavenumber of shock cells (Tam & Tanna Reference Tam and Tanna1982; Edgington-Mitchell et al. Reference Edgington-Mitchell, Wang, Nogueira, Schmidt, Jaunet, Duke, Jordan and Towne2021a). Spatial Fourier transforms are performed on the greyscales at
 $Y/D=0$ of the time-averaged schlieren image to obtain the wavenumber spectrum of shock cells. In the following content, the screech mechanism of the free and impinging jets at NPR of 2.15 is compared. Thus, the time-averaged schlieren images and the shock-cell wavenumber spectra of the free and impinging jets are shown in figure 19. The impinging plate is located at
 $X/D=5$, which is downstream of the primary shock cells of the free jet as shown in figure 19(a). The influence of the impinging plate on the time-averaged shock-cell structures is limited. In figure 19(c), the leading wavenumber peaks of free and impinging jets are close to each other, and the wavenumber of the leading peak is insensitive to the axial range for the spatial Fourier transforms. At
 $M_j = 1.11$ (
 ${\rm NPR}=2.15$), the dominant screech tone of the free jet is at the axisymmetric A1 mode (Li et al. Reference Li, Liu, Hao, Zhang and He2021). As discussed in Nogueira et al. (Reference Nogueira, Jaunet, Mancinelli, Jordan and Edgington-Mitchell2022a), the A1 mode resonance is closed by the
 $k^-_p$ wave energized by the interaction of the K–H wave and the leading wavenumber of the shock cells. Thus, in the present section,
 $k_s$ is the leading wavenumber of the shock cells and is obtained from figure 19(c). In figure 18, the lines of
 $k^+_{KH} \pm k_s$ are indicated by the magenta dashed lines. As shown in figure 18, there are high-amplitude regions along the lines of
 $k^+_{KH} \pm k_s$, especially at the frequencies of acoustic resonance. At resonance frequencies, the
 $k^+_{KH}$ wave is enhanced by the resonance mechanism. The interaction between the
 $k^+_{KH}$ wave and shock cells is intenser. Furthermore, there are also high-amplitude regions around the dispersion relation of the (
 $0,1$) guided jet mode and near the intersection of the line of
 $k^+_{KH} - k_s$ and the dispersion relation of the (
 $0,2$) guided jet mode. The above results indicate that the guided jet modes and the interaction between the K–H wave and shock cells play important roles in the acoustic resonance of the
 $M_j=1.11$ impinging jet.
Frequency–wavenumber spectrum of the fluctuating greyscales along  $Y/D=0$ for the
 $M_j = 1.11$ jet. The colour contours provide the empirical dispersion relations for the waves supported by the jets. The dispersion relations of (
 $0,1$) and (
 $0,2$) guided jet modes obtained from the vortex-sheet model are plotted in the same way as in figure 2. The dashed lines represent the waves with constant group and phase velocities equal to the labelled values. The tonal frequencies are indicated by red squares.

The time-averaged schlieren images of the free (a) and impinging (b)  $M_j=1.11$ jets. (c) The wavenumber spectra of the greyscales along the jet centreline.

In previous studies, the screech mechanism of underexpanded free jets was widely discussed in Nogueira et al. (Reference Nogueira, Jaunet, Mancinelli, Jordan and Edgington-Mitchell2022a) and Edgington-Mitchell et al. (Reference Edgington-Mitchell, Li, Liu, He, Wong, Mackenzie and Nogueira2022). Thus, the acoustic resonance for screech tones of underexpanded impinging jets is compared with that of underexpanded free jets. The first SPOD modes at screech frequencies of the  $M_j=1.11$ free and impinging jet are shown in figure 20(a,c). The real parts of these two SPOD modes show that axisymmetric coherent structures are dominant at screech frequencies, which corresponds to the azimuthal feature of the A1 screech mode (Powell, Umeda & Ishii Reference Powell, Umeda and Ishii1992). Standing-wave patterns, which are the signs of the formation of acoustic feedback loops, are displayed by the normalized amplitude fields of the SPOD modes. As shown in figure 20(c), the high-amplitude region of the standing-wave pattern in the impinging jet is mainly around the third and the fourth shock cells, which is similar to the case of the free jet. The axial wavenumber spectra of figures 20(a) and 20(c) are displayed in figures 20(b) and 20(d), respectively. The spectra of the free and impinging jets also exhibit similar features. The interaction between
 $k^+_{KH}$ and shock cells redistributes the energy to the wavenumbers of
 $k^+_{KH} \pm k_s$, and the wavenumber of the
 $k^-_p$ wave is close to that of
 $k^+_{KH} - k_s$. Based on the above results, for the present
 $M_j$, the screech mechanism of the free jet is also suitable for the impinging jet with
 $H/D=5.0$. The screech feedback loop is closed by the
 $k^-_p$ wave which is energized via the interaction between the
 $k^+_{KH}$ wave and the primary wavenumber of shock-cell structures (Nogueira et al. Reference Nogueira, Jaunet, Mancinelli, Jordan and Edgington-Mitchell2022a). For the present ranges of
 $M_j$ and
 $H/D$, the effect of the impinging plate on the shock-cell structures in underexpanded jets is limited, as shown in figure 19. Thus, underexpanded impinging jets generate screech tones via a mechanism similar to that of underexpanded free jets.
The first SPOD modes at the screech frequencies of the  $M_j=1.11$ free (a) and impinging (c) jets. The left-hand panel of each pair is the real part of the SPOD mode. Blue scales indicate negative values and yellow scales indicate positive values. The right-hand panel of each pair is the normalized amplitude field of the SPOD mode. The colour scales range from 0 (blue) to 1 (yellow). Normalized wavenumber spectra of (a,c) are shown in (b,d), respectively.

Figure 21(a) shows the first SPOD mode at  $St_D=0.26$ of the
 $M_j=1.11$ impinging jet. In figure 21(a), there are three anti-nodes in the standing-wave pattern between the nozzle exit and the impinging plate, and the high-amplitude regions of the SPOD mode are mainly concentrated in the near-wall area (
 $4.0 \leq X/D\leq 4.5$). However, at the frequency of the screech tone, the standing-wave pattern is only obvious in the axial region (
 $0 \leq X/D\leq 3.0$), as displayed in figure 20(c). The above results indicate the differences in the axial ranges of acoustic feedback loops of the impinging tone and the screech tone. For the impinging tone, the acoustic feedback loop is established between the nozzle exit and the impinging plate. The axial range of the screech feedback loop mainly contains the first several shock cells of the jet.
(a) The first SPOD modes at  $St_D=0.26$ of the
 $M_j=1.11$ impinging jet. The left-hand panel is the real part of the SPOD mode. Blue scales indicate negative values and yellow scales indicate positive values. The right-hand panel is the normalized amplitude field of the SPOD mode. The colour scales range from 0 (blue) to 1 (yellow). (b) The normalized wavenumber spectrum of (a).

Spatial Fourier transforms are applied to the SPOD modes displayed in figure 21(a) to analyse the different kinds of disturbances that are active at the tonal frequency. As shown in figure 21(b), there are multiple high-amplitude regions in the wavenumber spectrum at the frequency of the impinging tone. The wavenumbers of the  $k^+_T$ wave, the
 $k^-_p$ wave and the
 $k^+_{KH}$ wave are indicated in figure 21(b). The amplitudes at the wavenumber of the
 $k^+_T$ wave are mainly concentrated in the jet core. At the wavenumber of the
 $k^-_p$ wave, the amplitudes distribute both in the jet core and outside the shear layer. For the present underexpanded jets, quasiperiodic shock cells appear in the jet plume. The wavenumbers of
 $k^+_{KH} \pm k_s$,
 $k^+_T \pm k_s$ and
 $k^-_p \pm k_s$ are also indicated in figure 21(b). Higher amplitudes are distributed at all these interaction wavenumbers. This implies that not only the
 $k^+_{KH}$ wave, but also the
 $k^+_T$ and
 $k^-_p$ waves can interact with the quasiperiodic shock cells to redistribute energy on the specific wavenumbers.
Finally, the mechanism of the tone at  $St_D=0.39$ is analysed. Based on the frequency relation of
 $0.65-0.26=0.39$, it can be inferred that the tone at
 $St_D=0.39$ arises via the interaction between the frequencies of the screech and impinging tones. A BMD is performed on the schlieren data of the
 $M_j=1.11$ jet and the obtained magnitude mode bispectrum
 $\vert \lambda _1 (St_{D1}, St_{D2})\vert$ is shown in figure 22. The modulus
 $\vert \lambda _1 (St_{D1}, St_{D2})\vert$ quantifies the interaction of the frequency doublet
 $(St_{D1}, St_{D2})$ and the dashed white diagonal lines denote doublets generating the same frequency (Schmidt Reference Schmidt2020; Schmidt & Oberleithner Reference Schmidt and Oberleithner2023). The most energetic contribution to the screech frequency
 $St_D=0.65$ is the triad (0.65, 0, 0.65), which means the interaction with the mean flow. The present screech tone is at the A1 mode. The screech feedback loop is closed by the
 $k^-_p$ wave that arises owing to the interaction between the
 $k^+_{KH}$ wave and the leading wavenumber of the shock-cell structure. The leading shock-cell wavenumber reflects the feature of the mean field. The result of BMD further indicates the close connection between the generation of screech tones and the mean flow field. Along the line of
 $St_D=0.39$, the interaction of the triad
 $(0.65, -0.26, 0.39)$ is the most energetic, which is indicated by the black circle. This triad interaction is investigated in more detail in figure 23. As shown in figure 23(a), the real part of the bispectral mode indicates that the flow structures energized by the interaction between
 $St_D=0.65$ and 0.26 are symmetric with respect to the jet axis, which means that the tone at
 $St_D=0.39$ belongs to an axisymmetric mode. Figure 23(b) shows the phase alignment between the components of
 $St_D=0.65$ and 0.26, which exhibits similar spatial features to the bispectral mode. In figure 23(c), the interaction is the strongest at the shock cells around
 $X/D=3$. Shock-cell structures play an important role in the energy transfer between different frequencies in underexpanded impinging jets.
The mode bispectrum of the greyscales for the  $M_j=1.11$ impinging jet. The dashed white lines denote triadic interactions forming the same frequency, as annotated at the respective lines. The triadic interaction mentioned in the text is marked by the black circle.

The triadic interaction of the flow structures at the frequencies of the screech ( $St_D=0.65$) and impinging (
 $St_D=0.26$) tones for the
 $M_j=1.11$ jet with
 $H/D=5.0$: (a) the real parts of the bispectral mode and (b) the cross-frequency field. Blue scales indicate negative values and yellow scales indicate positive values. (c) The normalized amplitude field of the interaction map. The colour scales range from 0 (blue) to 1 (yellow).

The first SPOD mode at  $St_D=0.39$ of the
 $M_j=1.11$ jet is shown in figure 24(a). The real parts of the SPOD mode and the bispectral mode in figure 23(a) share similar features. For the
 $M_j=1.11$ jet, the screech tone at
 $St_D=0.65$ and the impinging tone at
 $St_D=0.26$ are all in axisymmetric modes, and the acoustic resonance loops of these two tones are all related to the
 $k^-_p$ waves. The interaction between the flow structures at these two tonal frequencies can generate an axisymmetric tone outside the frequency ranges where the (
 $0,1$) or (
 $0,2$)
 $k^-_p$ wave exists, as shown in figure 18. To further confirm the above conclusion, the first SPOD modes at the frequency differences between the screech and impinging tones of the
 $M_j=1.11$ jets with
 $H/D=4.5$ and 5.5 are displayed in figures 24(b) and 24(c), respectively. The coherent flow structures shown in these two SPOD modes are symmetric with respect to the jet axis, and the frequencies of these two tones are above the cut-off frequency of the (
 $0,1$)
 $k^-_p$ wave (
 $St_D=0.31$) and below the cut-on frequency of the (
 $0,2$)
 $k^-_p$ wave (
 $St_D=0.61$).
The first SPOD modes at the frequency differences between the screech and impinging tones of the  $M_j=1.11$ jets: (a)
 $H/D=5.0$ (
 $St_D=0.39$), (b)
 $H/D=4.5$ (
 $St_D=0.37$) and (c)
 $H/D=5.5$ (
 $St_D=0.36$). The left-hand panel of each pair is the real part of the SPOD mode. Blue scales indicate negative values and yellow scales indicate positive values. The right-hand panel of each pair is the normalized amplitude field of the SPOD mode. The colour scales range from 0 (blue) to 1 (yellow).

4. Conclusions
In the present study, structures of the acoustic feedback loops that produce the discrete tones of axisymmetric modes in subsonic and slightly underexpanded impinging jets are investigated experimentally. The jet Mach number ranges from 0.70 to 1.12 and the impinging distance is from 4.0 $D$ to 6.0
 $D$. The results of acoustic measurements show that the most intense tones are mainly generated in the limited frequency band for which the downstream-propagating duct-like jet mode is supported in the jets, and slightly underexpanded impinging jets also produce screech tones like underexpanded free jets.
Based on the time-resolved schlieren image sequences recorded by a high-speed camera, several cases of  $H/D=5$ are selected to study the different forms of acoustic resonance loops in impinging jets. For the
 $M_j<0.82$ jets, the empirical dispersion relations obtained from the fluctuating greyscales at the jet axis of schlieren images have good agreement with the dispersion relations of the axisymmetric guided jet modes obtained from the vortex-sheet model. At a fixed Mach number, with an increase of tonal frequencies, the upstream-propagating guided jet mode is gradually confined to the potential core of jets. These results provide the first direct experimental evidence for previous theoretical research. When
 $M_j$ is larger than 0.82, the downstream-propagating duct-like jet mode is supported by jets in limited frequency ranges. When the tonal frequencies fall in these frequency ranges, the upstream-propagating discrete free-stream mode can constitute acoustic resonance loops with the downstream-propagating K–H wave and the downstream-propagating duct-like mode, respectively. By analysing the phase criteria of different types of acoustic resonance loops, it is indicated that the generation of impinging tones is due to the acoustic resonance between the downstream-propagating K–H wave and the upstream-propagating discrete free-stream mode. The intensities of impinging tones are influenced by the acoustic resonance between the downstream-propagating duct-like mode and the upstream-propagating discrete free-stream mode. Thus, the most intense impinging tones are generated in the frequency range for which the downstream-propagating duct-like jet mode is supported in the jets. When the tonal frequencies approach the cut-off frequencies of the upstream-propagating discrete free-stream mode, impinging tones become weaker gradually and disappear finally.
With a further increase of  $M_j$, impinging jets progressively get into underexpanded states. The first SPOD modes at the frequencies of impinging tones and screech tones indicate that the acoustic feedback loop of an impinging tone is formed between the nozzle exit and the impinging plate, and the axial range of the acoustic feedback loop of a screech tone only includes the first several shock cells. The screech mechanism of underexpanded impinging jets is similar to that of underexpanded free jets. At the frequency of an impinging tone, shock-cell structures can modulate the downstream-propagating K–H wave, and the upstream- and downstream-propagating guided jet modes. Moreover, the interaction between the flow structures at the frequencies of screech and impinging tones can generate axisymmetric tones outside the frequency ranges in which the axisymmetric upstream-propagating discrete free-stream modes are supported by jets.
Funding
This work was supported by the National Natural Science Foundation of China (grant nos. 12202245, 11972215, 12072174), the National Key R&D Program of China (grant no. 2022YFC2402600) and the National Basic Research Program of China (the 973 Program) through grant no. 2012CB720100.
Declaration of interests
The authors report no conflict of interest.



