Since a wave of democratization swept the world in the 1990s, elections have become a global norm (Levitsky and Way Reference Levitsky and Way2010). However, many new democracies struggle with consolidation and holding elections that meet international standards (Hyde Reference Hyde2011; von Borzyskowski Reference von Borzyskowski2016). Elections have been marred by irregularities and repression. Most notably, violence has become a prominent feature of elections in many developing countries (Beaulieu Reference Beaulieu2014, 138; Collier Reference Collier2009). When elections turn violent, it threatens their integrity, it tilts the electoral playing field towards actors with repressive capacity, and it limits participation, particularly among those unable to protect themselves from violence (Bratton Reference Bratton2008).
Election violence is a type of political violence that is aimed at influencing the election's process or outcome and occurs temporally close to elections.Footnote 1 A burgeoning literature in comparative politics and international relations examines the causes and consequences of election violence.Footnote 2 Some of the quantitative work in this area has been cross-national (for example, Birch and Muchlinski Reference Birch and Muchlinski2018; Daxecker Reference Daxecker2014; Fjelde and Höglund Reference Fjelde and Höglund2016a; Hafner-Burton, Hyde and Jablonski Reference Hafner-Burton, Hyde and Jablonski2014 and Reference Hafner-Burton, Hyde and Jablonski2018; Kuhn Reference Kuhn, Frank, Martinez, Coma and Norris2015; Taylor, Pevehouse and Straus Reference Taylor, Pevehouse and Straus2017; von Borzyskowski Reference von Borzyskowski2019a, Reference von Borzyskowski2019b), while other work has been sub-national (for example, Burchard Reference Burchard2015; Dercon and Guitérrez-Romero Reference Dercon and Gutiérrez-Romero2012; Goldring and Wahman Reference Goldring and Wahman2018; Ishiyama, Pulido Gomez and Stewart Reference Ishiyama, Pulido Gomez and Stewart2016; Linke Reference Linke2013; Reeder and Bech Seeberg Reference Reeder and Bech Seeberg2018; Weidmann and Callen Reference Weidmann and Callen2013; Wilkinson Reference Wilkinson2004). Prior studies tend to assume that underlying data on election violence are free of systematic measurement error and reflect dynamics on the ground reasonably well; or more formally, that there is no systematic measurement error, and that the variables used are a valid measure of the underlying concept of election violence. We argue that this assumption is incorrect for some widely used datasets.
Most sub-national (and some cross-national) work on election violence has relied on media-based conflict event data.Footnote 3 A number of newer social conflict datasets, like the Armed Conflict Location and Event Data Project (Raleigh et al. Reference Raleigh2010) and the Social Conflict Analysis Database (SCAD) (Salehyan et al. Reference Salehyan2012), have enabled researchers to place violent events geographically and study variation both within and across countries. Such conflict event data have opened up a wealth of new opportunities for researchers interested in the causes and consequences of election violence. But how valid are such media-based conflict event data to measure election violence? Even more importantly, do these measures of violence have errors that may systematically skew empirical results? Indeed, some earlier work has argued that this may well be the case (Eck Reference Eck2012; Weidmann Reference Weidmann2016). Media logics inherent in domestic and international reporting are likely to create serious under-reporting and potential systematic measurement error. Several studies have acknowledged the limitations of media-based event data in their ability to capture violence or political mobilization (Davenport and Ball Reference Davenport and Ball2002; Earl et al. Reference Earl2004; Mueller Reference Mueller1997; Weidmann Reference Weidmann2016). Yet, we are the first to measure the extent of such systematic measurement error in relation to elections and at a low level of aggregation (constituencies). We document how serious this underestimate is, as well as its causes and consequences.
To deal with under-reporting and misclassification, researchers have proposed two main solutions. The first is to triangulate between multiple measures (Hendrix and Salehyan Reference Hendrix and Salehyan2015; Weidmann Reference Weidmann2016), for example with capture–recapture methods or merging. This solution is only possible when multiple sources exist and assumes that the measures do not suffer from similar systematic measurement error. A second solution is to fix the issue with statistical remedies, trying to assess the severity and direction of systematic measurement error through sensitivity analyses (Gallop and Weschle Reference Gallop and Weschle2017) and trying to correct for it (Cook et al. Reference Cook2017). However, as Weidmann (Reference Weidmann2016, 208) notes, ‘there have been no tests on a real case of selectively reported data where the true values are known’. While we do not claim to have revealed the absolute ‘truth’, we provide two cases for which more accurate values are known, as data are systematically collected from domestic election monitors evenly spread across the country, regardless of remoteness and communication technology. The difference between the more accurate monitor measure of where violence happened and the media-based event measure is what we call under-reporting.
Measurement error concerns the relationship between an observed variable and a specific concept it is intended to capture, and can be random or systematic. Both our own data and event data may have some random measurement error. However, event data suffer from systematic measurement error due to the logic of reporting. Media-based incident data (such as ACLED and SCAD) are not clean measures of violence but measures of reported violence. This threatens measurement validity (Adcock and Collier Reference Adcock and Collier2001). Our method guarantees equal coverage across space and provides a baseline against which we can estimate the sources and effects of systematic measurement error in event data. Scholars wishing to use event data in their own research may use these results to account for systematic measurement error in modeling sub-national variation in election violence.
We make both methodological and substantive contributions to research on measurement error concerning media-based event data. Methodologically, we contribute to research on under-reporting by comparing two frequently used media-based event datasets (SCAD and ACLED) to new datasets on constituency-level election violence. Our novel approach, captured in the Malawi Election Monitor Survey (MEMS) and Zambia Election Monitor Survey (ZEMS), uses systematic expert surveys with domestic election observers to map election violence. This new approach is designed to ensure consistent national coverage at the constituency level. Using two recent African elections, Malawi (2014) and Zambia (2016), we compare these constituency-level expert survey data to SCAD and ACLED. Based on these comparisons, we then sign the direction of the systematic measurement error that is likely to result from using media-based event data to capture election violence.
Substantively, we document under-reporting not only in rural areas but also outside expected violence hotspots and disproportionately in the pre-election period. We show that the consequences of systematic measurement error are severe, generating significant relationships where none exist and also different effect magnitudes. Our findings have important implications for scholars conducting empirical research on election violence, but also for those using other media-based event data on issues such as social mobilization or civil conflict.
To be clear, our argument is not that event data are entirely unsuitable for research on election violence. For large-N cross-national analyses, such data often remain the only easily accessible data source. However, scholars should be aware of systematic measurement error in these data, should be careful when interpreting results and use appropriate models to analyze the possible consequences of such error. Our substantive results cast doubt on some of the most important empirical work on the frequency, location and timing of election violence. Taken together, our findings raise a larger issue, as they suggest that the current state of knowledge on election violence may well be affected by systematic biases when using violence measures from media-based event data.
Potential Systematic Measurement Error when using Media-Based Event Data
Geo-coded data on social conflict creates new opportunities to conduct cross-national (for example, Burchard Reference Burchard2015; Daxecker Reference Daxecker2014; Goldsmith Reference Goldsmith2015) as well as sub-national election violence research (e.g. Burchard Reference Burchard2015; Ishiyama, Pulido Gomez and Stewart Reference Ishiyama, Pulido Gomez and Stewart2016; Linke Reference Linke2013; Reeder and Bech Seeberg Reference Reeder and Bech Seeberg2018). We focus on two such datasets, ACLED (Raleigh et al. Reference Raleigh2010) and SCAD (Salehyan et al. Reference Salehyan2012), and concentrate particularly on their ability to capture sub-national variation in election violence.Footnote 4 In this article we compare these datasets to our own collected expert survey data (M/ZEMS).
Neither ACLED nor SCAD was designed with the primary purpose of capturing election violence, but both have been used for this purpose (for example, Burchard Reference Burchard2015; Daxecker Reference Daxecker2014; Ishiyama, Pulido Gomez and Stewart Reference Ishiyama, Pulido Gomez and Stewart2016; Linke Reference Linke2013; Reeder and Bech Seeberg Reference Reeder and Bech Seeberg2018). We focus on ACLED and SCAD because of their popularity and their comparability to M/ZEMS data. ACLED, SCAD and M/ZEMS all aim to capture conflict events in African countries sub-nationally, include lethal and non-lethal incidents, and events inside as well as outside of civil wars.Footnote 5
ACLED and SCAD are also similar to each other in that they both document conflict events in Africa based on media sources, and offer a geographic location indicator. They also differ in a number of ways. In terms of news sources, ACLED uses a variety of local, regional and national newspapers, and non-governmental organization reports to locate violent events. SCAD's data collection is limited to two international news agencies: the Associated Press and Agence France-Presse.Footnote 6 Importantly, SCAD excludes all local newspapers. For the two countries included in this article, it means that SCAD excludes local newspapers such as Malawi's Malawi Nation and Malawi Times and Zambia's The Post, Times of Zambia and Zambia Daily Mail.
There are at least two preconditions for mapping constituency-level election violence: geo-precision and election specificity. The former requires being able to place each violent incident within the boundaries of an electoral constituency. One limitation of both ACLED and SCAD is that neither was designed to map incidents into electoral constituencies, and the precision of the geographic coordinates is often limited. For instance, a newspaper article may name the district of an election violence event, but a district (as in the case of Malawi and Zambia) may have several constituencies.Footnote 7 The second precondition for mapping election violence is the ability to distinguish election violence from other forms of social conflict that are not directly related to the electoral process. Although neither dataset is particularly focused on election violence, they provide ways to filter election-specific violence – with more or less objectivity and replicability. An election ‘issue’ filter exists in SCAD but not in ACLED; single-sentence incident narratives must be used for ACLED, which can be ambiguous in terms of electoral relevance, raising issues of replicability.
The fundamental problem associated with media-based event data is that they are likely to under-report violence, especially lower-scale violence that is overshadowed by other, more dramatic events. Some violent events are unlikely to be picked up by newspapers. For an event to appear in the media, a journalist needs to know and write about it, and an editor needs to decide to publish it. Yet both actors face constraints. Journalists face physical and economic constraints; they routinely make decisions about where to go and trade off one location over another. In deciding where to go, journalists consider where (more important) events are likely to happen, how to reach these places and how to publish stories from there. If notable events are likely to happen in both places A and B, but A is within easier reach or offers other conveniences, then journalists choose A over B. Such patterns are reinforced if journalists are mainly freelancers, paid per published story. Thus journalists tend to privilege towns over villages, central areas over more remote ones and places with access to better communication tools.Footnote 8 However, even if journalists see/hear and write about an event, it does not guarantee publicity. Editors also face constraints on what to publish; these can be space constraints due to paper/column space, or political constraints as to what is fit to print given the outlet's preferences and government policies. As a result of these constraints, many events do not make it into the media, and thus do not appear in event datasets based on media outlets.
This fundamental problem of media-based event data also applies to the case of election violence. Based on these reporting dynamics inherent in the media, we argue that under-reporting varies by election cycle, by connectivity and by expectations of violence. As for electoral cycles, general under-reporting should be especially noteworthy in the longer pre-election period, during which journalists are likely to be less alert to possible violence. After elections, however, journalists pay closer attention to reactions to the election results and process, and any contestation or unrest. We hence formulate the following hypotheses:
Hypothesis 1 (Under-reporting Hypothesis)
Media-based conflict event data tend to under-report incidents of election violence.
Hypothesis 2 (Pre-Election Hypothesis)
Media-based conflict event data tend to under-report incidents of election violence more in the pre-electoral than the post-electoral period.
These conjectures are important because under-reporting of election violence in media-based event data can paint a misleading picture of security concerns in relation to elections. A misrepresentation of the relative frequency of pre- and post-election violence can also distort research on the timing of election violence. For instance, using Reuters news database, Bhasin and Gandhi (Reference Bhasin and Gandhi2013) show that most government electoral repression happens after rather than before elections, but this result could have been affected by an increased propensity for the media to report on post-election violence. In addition to distorting studies on the timing of violence, under-reporting can also generate inference problems for violence studies more broadly if the under-reporting is systematically related to the independent variable (Weidmann Reference Weidmann2016; Wooldridge Reference Wooldridge2006). Below we outline two different sources of possible under-reporting: (1) constituency connectivity and (2) expectations of violence. We argue that both of these sources may create media under-reporting, systematic measurement error, and thus biased estimates and inaccurate inference from (election) violence studies using media-based event data.
Constituency Connectivity
Sub-national units vary vastly in their level of connectivity. This is especially true in the developing world, where infrastructure is poor, mobility limited, and access to electricity, the internet and mobile networks is restricted. Journalists and editorial offices are based in cities and organizational life is much denser in major urban areas. We should hence see a significant urban bias in the reporting of election violence. Similar arguments have been made about the measurement of social conflict more generally (Weidmann Reference Weidmann2016) and state terror (Davenport and Ball Reference Davenport and Ball2002). We formulate the following hypothesis:
Hypothesis 3 (Connectivity Hypothesis)
Media-based conflict event data tend to under-report incidents of election violence in less connected areas.
Connectivity driving under-reporting is important because much literature on election violence argues that it is a predominantly urban phenomenon (Burchard Reference Burchard2015; Wilkinson Reference Wilkinson2004). Possible systematic measurement error in relation to constituency connectivity could have significant ramifications, as the level of violence in less urban, more remote places is likely underestimated. Even more troubling, urban–rural contrasts in Africa are stark, and local political dynamics differ significantly between cosmopolitan African cities, regional commercial centers, densely populated commercial agricultural zones and semi-arid pastoral regions.
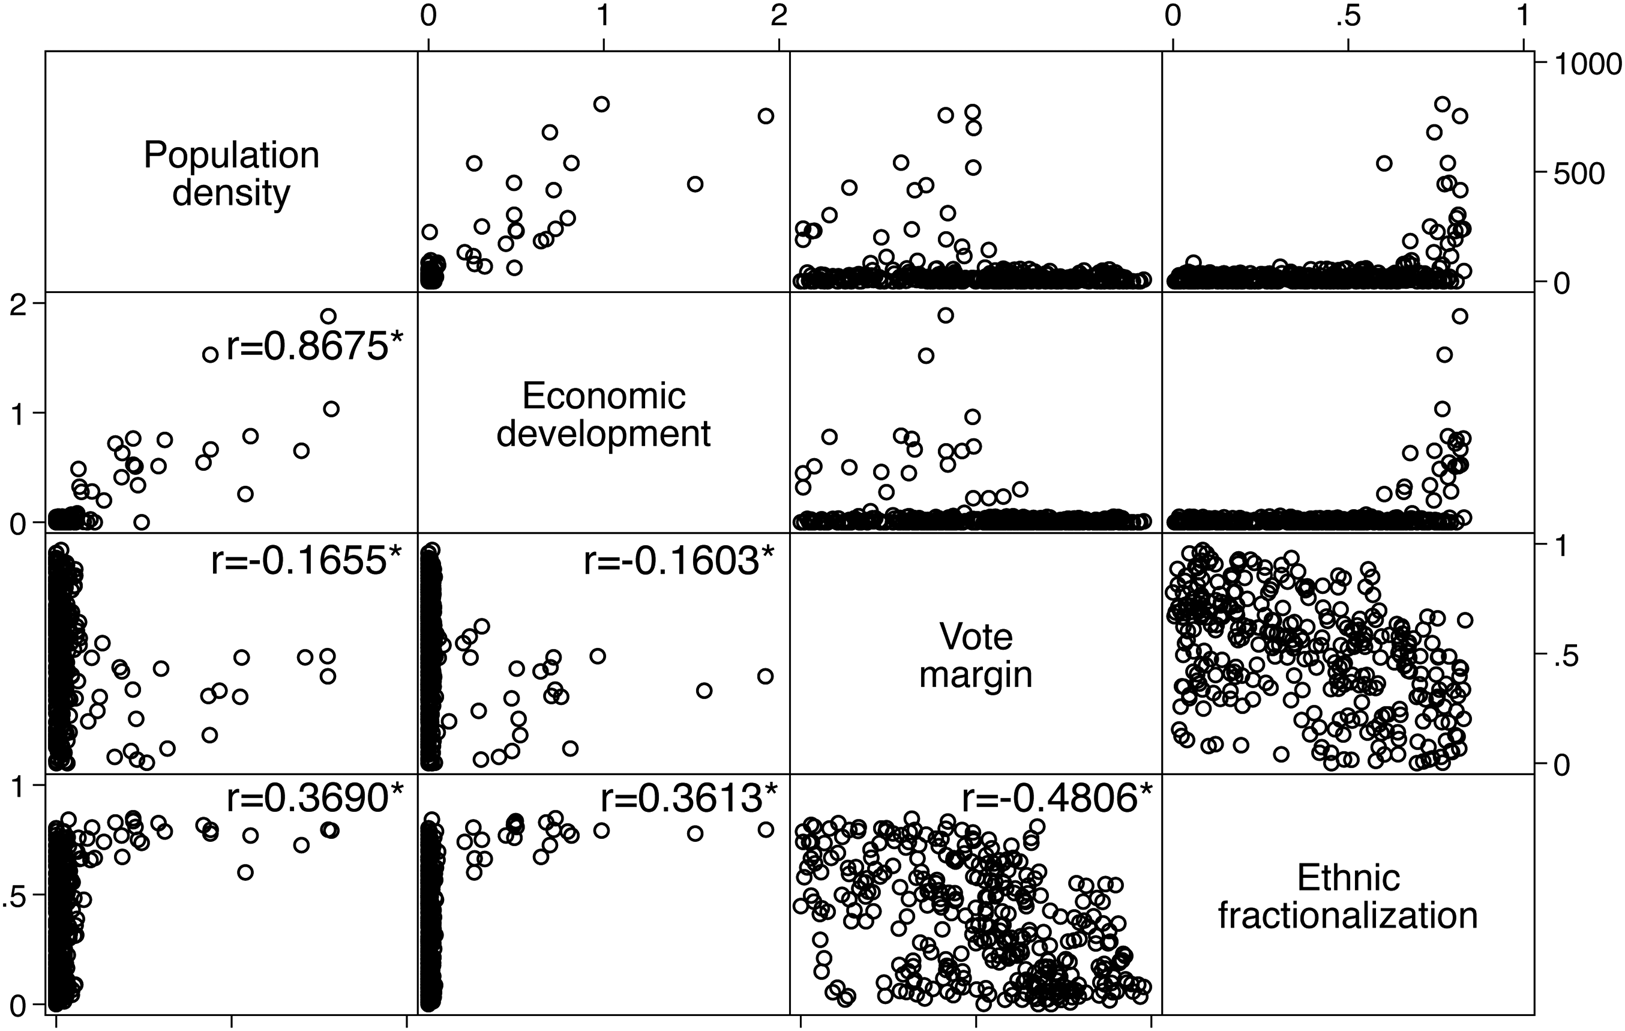
Many locations that have been predicted to be high-risk areas for election violence, including ethnically diverse cities (Straus Reference Straus2011), agricultural settlement schemes (Boone Reference Boone2011; Kanyinga Reference Kanyinga2009) and resource extraction sites (Bratton Reference Bratton2008), also have high population densities. Population density and electoral competition are highly correlated, with cities and highly populated rural areas showing significantly higher levels of political competition than low-density rural locations dominated by subsistence farming and pastoral areas (Wahman and Boone Reference Wahman and Boone2018). Population density also serves as a strong proxy for modernization and economic development. Figure 1 shows the relationship between constituency-level population density, political competition, ethnic fractionalization and economic developmentFootnote 9 in our sample. Population density is significantly correlated with political competition, ethnic fractionalization and economic development (night light density). This is important for studies on sub-national election violence because relationships between socio-economic conditions, population density, political competition and election violence are difficult to disentangle if underlying data fail to record election violence equally in high and low population density areas. We return to this issue in the robustness section.
Correlation matrix (Malawi and Zambia)
Note: correlation statistics in individual plots. *p < 0.05

Expectations of Violence
In the run-up to elections, journalists and other country specialists often have expectations about where in the country violence is more likely to occur. These locations may be politically contested (high competition) or have a history of election violence. Election observers often invest more effort into monitoring such election hotspots. Civil society also tends to increase efforts to prevent violence, and representatives of international organizations tend to be more present in such locations. The increased attention devoted to hotspots should increase the probability of incidents being captured and reported. Hence we formulate the following hypothesis:
Hypothesis 4 (Hotspot Hypothesis)
Media-based conflict event data tend to under-report incidents of election violence outside expected violence hotspots.
Such potential systematic measurement error from using media-based conflict event data is problematic because it reinforces our preconceptions of the causes of election violence. Wilkinson (Reference Wilkinson2004), using data from Indian newspapers, finds that election-related ethnic riotsFootnote 10 tend to recur in the same locations. However, the logic presented above suggests that there may be a tendency for media to increase reporting from areas with a violent history.
AN ALTERNATIVE MEASURE: EXPERT SURVEYS FOR MAPPING CONSTITUENCY-LEVEL ELECTION VIOLENCE
As an alternative to media-based event data, we propose a new technique of mapping election violence based on systematic surveys of domestic election monitors. The advantage of this method is that it ensures consistent national coverage by systematically collecting data on a constituency-to-constituency basis regardless of the constituency's salience, connectivity or expected levels of election violence. This study builds on two original constituency-level surveys, the MEMS carried out in relation to Malawi's 2014 general election and the ZEMS carried out in relation to Zambia's 2016 general election. Descriptive statistics in the appendix document that Malawi and Zambia are representative of African countries in terms of election violence levels and drivers, and thus allow generalization.
We use our Malawi and Zambia surveys as our benchmark for empirical comparison with data from ACLED and SCAD. Both surveys were conducted in collaboration with leading, non-partisan domestic election observer organizations, following the same general principles. We carried out our Malawi survey with the assistance of the country's leading domestic election observation organization, the National Initiative for Civic Education (NICE). NICE engaged its full-time district civic education officers, regional civic education officers, and community volunteers in long-term monitoring and party mediation, and engaged a total of 4,500 stationary monitors in short-term observation on election day in every polling center. In Zambia, we collaborated with two leading domestic election observation organizations, the Foundation for Democratic Process (FODEP) and the Southern African Centre for Constructive Resolution of Disputes (SACCORD). They jointly covered all constituencies in the country, deploying a combined 9,000 election monitors throughout the election cycle. NICE, FODEP and SACCORD are all non-partisan organizations with international funding. They all have a clear organizational structure and provide their monitors with extensive training. In both Malawi and Zambia, we carried out phone interviews with three selected observers in each constituency.
Importantly, respondents were not a random sample but instead deliberately a sample of experts, as in other prominent expert surveys on election integrity.Footnote 11 The survey respondents for MEMS and ZEMS were recruited from the NICE, FODEP and SACCORD networks. The executive directors of all three organizations commissioned their regional and district coordinators to collaborate in identifying three suitable respondents in every constituency (193 constituencies in Malawi and 156 in Zambia). In particular, we asked for individuals who had appropriate monitor training, a thorough understanding of the entire electoral cycle for a particular constituency and no known partisan affiliation. The surveyed monitors include the constituency coordinators for each constituency as well as two additional suitable monitors.
In total, we conducted 579 interviews in Malawi and 464 interviews in Zambia. Overall inter-coder reliability scores are reasonable: they are high for Malawi but a bit lower for Zambia pre-election violence.Footnote 12 We would not expect perfect scores since constituency coordinators (coder 1) are higher in the hierarchy and thus receive more information than coders 2 and 3. Indeed, constituency coordinators (coder 1) generally report more violence than other coders.Footnote 13 To err on the side of caution given a lower score in inter-coder reliability for pre-election violence in Zambia, we conduct analyses of under-reporting for the two countries separately; we show pooled results in the appendix. Generally, similar patterns of under-reporting emerge in Malawi where inter-coder reliability is higher and in Zambia where inter-coder reliability is lower.
The original MEMS survey in June 2014 asked respondents whether any pre-election or election-day violence had occurred in their constituency.Footnote 14 To validate our findings and ensure consistency across respondents and consistency with our definition of election violence, we also asked respondents who indicated violence for a narrative of the event.Footnote 15 The narratives provide more precise information on the location, severity and actors involved in the violence. In some cases, the respondents' violence narratives did not meet our definition of election violence (such as tense rhetoric); here, we changed the coding to no violence for that respondent. Overall, our datasets represent a wealth of material at the constituency level with several monitor reports per unit and qualitative descriptions.
Our analysis hinges on the assumption that our indicator of election violence based on experts' evaluations is measured without systematic error. One line of criticism of this assumption would be that the roles our experts hold may give them an interest in either downplaying or exaggerating the extent of violence. While we cannot rule this out completely, several aspects – including the non-partisanship of the monitor organizations and monitors, the timeline and detail of the surveys – make this unlikely. The first potential concern is individual partisan biases among monitors. Although we would not expect any institutional bias within our non-partisan monitoring organizations, we cannot exclude the possibility of individual biases. However, asking for detailed event narratives makes it less likely that respondents fabricate incidents and also allows the reported events to be assessed for validity. A second concern is that monitors may themselves be affected by the media sources included in ACLED and SCAD.Footnote 16 However, our data would mitigate these systematic measurement errors because – in contrast to journalists – domestic monitors provide coverage across all constituencies, regardless of connectivity, violence history or electoral period. Lastly, there could be recall error if monitors forget about incidents that were less serious or happened earlier in the election cycle. However, the empirical results – showing a significantly higher number of election violence observations in our monitor data than in the media-based event data – give us confidence that recall error is not a serious issue.
RESEARCH DESIGN
To test the hypotheses about systematic measurement error that results from using media-based conflict event data to capture election violence across space, we use expert surveys as a benchmark and then compare them to media-based event data in bivariate graphs and multivariate regressions. That is, we measure election violence before/after elections in each constituency in each of the four datasets (ACLED, SCAD, MEMS/ZEMS), and then generate three sets of outcome measures: (1) consistency between media and monitor datasets to test the under-reporting and pre-election hypotheses (Hypotheses 1 and 2) in bivariate graphs; (2) under-reporting in media as compared to monitor datasets to test the connectivity and hotspot hypotheses (Hypotheses 3 and 4), using measures for our hypothesized drivers of under-reporting; and (3) ‘raw’ violence measures from each dataset to investigate the consequences of under-reporting for inference, by emulating a canonical study of election violence in Africa.
Empirical Strategy To Assess the Consequences of Under-reporting
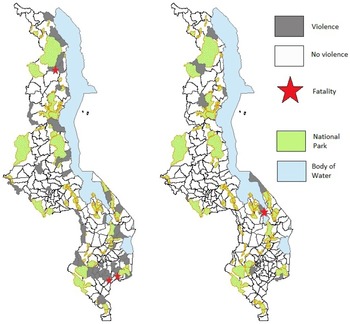
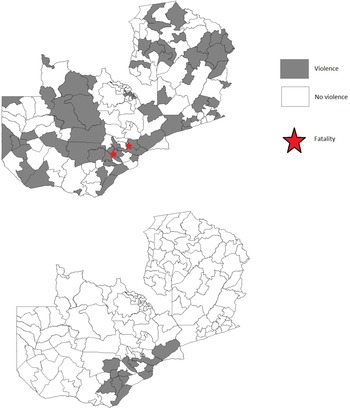
To assess the consequences of under-reporting for inference, we run identical model specifications on different dependent variables, that is, violence measures drawn from the monitor surveys and media event data. From each of the expert surveys (MEMS, ZEMS) we code two variables capturing election violence at two different stages of the electoral cycle. For example, the variable MEMS Pre-election Violence is a binary variable based on the Malawi expert survey that is coded 1 for any electoral violence before or on election day, and 0 otherwise. We code violence if one or more of the constituency's observer respondents reported election violence. Similarly, the variable MEMS Post-election Violence is coded 1 for electoral violence after election day and 0 otherwise in Malawi. Pre-election violence occurred in 22 per cent of constituencies in Malawi and 51 per cent of constituencies in Zambia. Post-election violence occurred in 4 per cent in Malawi and 9 per cent in Zambia. Figures 2 and 3 illustrate the spatial distribution and frequency of violence in the pre- and post-election periods in the two countries.
Constituencies with election violence in Malawi 2014
Source: MEMS data
Note: pre-election violence (left) and post-election violence (right)

Constituencies with election violence in Zambia 2016
Source: ZEMS Data
Note: pre-election violence (top) and post-election violence (bottom)

We source media-based event data from SCAD and ACLED, using their geocoded information to map these events to constituencies. To filter out electoral violence from other violence that happens to occur during the election period, we use dataset-specific strategies. For SCAD, we filter electoral violence by using their issue variable, which categorizes events as election related or not (issue = 1). For ACLED, we filter by narrative because no objective filter is provided. These strategies follow previous studies using these datasets for information on electoral violence (Daxecker Reference Daxecker2014). We have also tried, as much as possible, to match the time frames of pre- and post-election violence in the three sources. The MEMS/ZEMS surveys asked for ‘pre-election violence during the general election campaign’. To approximate this time period, we follow the convention in the literature (for example, Birch and Muchlinski Reference Birch and Muchlinski2018; Daxecker Reference Daxecker2014; von Borzyskowski Reference von Borzyskowski2019a) and collect all events in ACLED and SCAD that occurred within six months before the election. While the official campaigning periods are only 2–3 months in Zambia and Malawi, the longer 6-month cut-off effectively gives ACLED/SCAD more chances to report an event, thus reducing the risk of documenting under-reporting in media sources.Footnote 17 For post-election violence we include the period from election day until 2 weeks after the final results are announced (which is about 3 weeks after the election). This is the time when we start conducting the monitor surveys. In both Malawi and Zambia post-election violence had settled at this point.Footnote 18
We create the ‘raw’ violence variables ACLED Pre-election Violence, ACLED Post-election Violence, SCAD Pre-election Violence, and SCAD Post-election Violence. According to ACLED (SCAD) data, pre-election violence affected 4 (1) per cent of constituencies in Malawi and 17 (0.6) per cent of constituencies in Zambia. Also, according to ACLED (SCAD) data, post-election violence affected 2 (0.5) per cent of constituencies in Malawi and 9 (0.6) per cent of constituencies in Zambia. Note that both media-based event datasets record significantly lower rates of violence than our expert surveys. We also combine information from ACLED and SCAD to emulate what an analyst of electoral violence might do, that is, combining all available media-based event data. Thus, we generate variables called ACLED/SCAD Combined Pre-election Violence and ACLED/SCAD Combined Post-election Violence. They are coded 1 when either or both media datasets indicate violence and 0 when none does. These are our dependent variables when analyzing the consequences of systematic measurement error.
For model specification, we emulate a recent study on constituency-level election violence in Africa by Reeder and Bech Seeberg (Reference Reeder and Bech Seeberg2018).Footnote 19 Like Reeder and Bech Seeberg, we control for urbanization,Footnote 20 night lights (economic development),Footnote 21 competitivenessFootnote 22 and democracy.Footnote 23 Further, we use multiple model specifications (logit/OLS, country fixed effects, region clustered standard errors) to ensure that it is indeed the varying data source (monitor vs. media) rather than varying model specification that drives the differences in results.
Empirical Strategy To Test Hypotheses 1 and 2
Using the raw violence variables from both the expert surveys and the media event datasets (as detailed in the previous section), we then generate consistency variables to test hypotheses about the existence of under-reporting generally and particularly during the pre-election period (Hypotheses 1 and 2). Consistency measures agreement between the two types of datasets about violence reporting for any given constituency and electoral period. For example, the variable Consistency SCAD Pre-election Violence for Malawi is coded 1 when both MEMS and SCAD reported pre-election violence, or when neither dataset reported pre-electoral violence for a given constituency. It is coded 0 when MEMS reported violence but SCAD did not; and when SCAD reported violence but MEMS did not. We code equivalently the variables Consistency SCAD Post-election Violence, Consistency ACLED Pre-election Violence and Consistency ACLED Post-election Violence for both countries. Similar to the violence measures, we also combine the media datasets and generate Consistency ACLED/SCAD Combined Pre-election Violence and Consistency ACLED/SCAD Combined Post-election Violence. These are coded 1 when monitor reports are consistent with either ACLED or SCAD, and 0 otherwise. We test hypotheses about the existence of under-reporting generally and particularly in the pre-election period (Hypotheses 1 and 2) using bivariate graphs of distributions and paired t-tests.
Empirical Strategy To Test Hypotheses 3 and 4
We next test Hypotheses 3 and 4 on connectivity and hotspots as driving under-reporting. We code under-reporting when monitor data indicate violence but media data do not. For example, Under-reporting in Pre-election ACLED Data for Malawi is coded 1 when MEMS indicates pre-election violence but ACLED does not, and 0 otherwise. We code equivalent variables for Under-reporting in Post-election ACLED Data, Under-reporting in Pre-election SCAD Data, Under-reporting in Post-election SCAD Data, Under-reporting in Pre-election ACLED/SCAD Combined Data, and Under-reporting in Post-election ACLED/SCAD Combined Data. We generate the same six under-reporting variables for Zambia.
To capture connectivity, we measure population density (number of people per km2) using the most recent census data.Footnote 24 To capture anticipated hotspots, we measure History of Election Violence and Vote Margin from the presidential election. The variable History of Election Violence is sourced from the two media-based event datasets (ACLED and SCAD) for all prior elections. While media-based event data have significant blindspots (as documented above), we use these data to capture history because it is precisely the widely reported violence that might drive journalists' expectations of more violence and thus reporting dynamics. This variable is categorical and coded 0 when no violence was widely reported for a constituency in previous elections, 1 for widely reported violence in one previous election, and 2 for widely reported violence in multiple previous elections. In line with the Hotspot Hypothesis (Hypothesis 4), we expect a negative coefficient: hotspot constituencies – those with a history of election violence – should be less subject to under-reporting in the current election.
As another indicator of anticipated hotspots, we also use vote margin from the presidential election (from the Malawi Electoral Commission and Electoral Commission of Zambia, respectively). That is, we use presidential vote margin results from the current election in the models of post-election outcomes in both countries. We use vote margin results from the previous election (the 2015 presidential by-election) for pre-election outcomes in Zambia. However, in the case of Malawi we also use current results for pre-election outcomes. We do so because these dynamics (competitive vs. non-competitive constituencies) were widely anticipated and major realignment in the Malawian party system (the government party had split into two parties) made 2009 electoral results a poor approximation of 2014 competitiveness. Note that this could introduce post-treatment bias in the models of pre-election consistency for Malawi, since this variable is observed only after election day. However, the results are robust to dropping that variable in the pre-election period.
We include several control variables to capture other potential causes of systematic measurement error. Since poorer locations may be less likely to attract media attention, we include economic development in terms of electrification (that is, the percentage of households with electricity in a constituency, from census 2008 and 2010)Footnote 25 and human development in terms of literacy (the percentage of literate citizens over the age of 15 in a constituency, from census 2008 and 2010). Descriptive statistics of all variables are available in Appendix Tables A1 and A2.
To test the Connectivity and Hotspot Hypotheses (Hypotheses 3 and 4), we estimate the following statistical model:
 $$DV_{cr} = \beta _0 + {\bi C}^{\prime}_{\bi cr} \beta_{1} + {\bi H}^\prime_{\bi cr} \beta_{2} + {\bi X}^\prime_{\bi cr} \beta + {{\epsilon}_{cr}}, $$
where β1 and β2 are the parameters of interest on the key explanatory vectors Ccr and Hcr, which capture connectivity and hotspot variables and thus test Hypotheses 3 and 4. DV are the respective dependent variables: under-reporting between survey and media data for analyses of the causes of systematic measurement error, and violence measures for analyses of the consequences of systematic measurement error. Further, the vector X′cr represents a set of control variables, εcr is the idiosyncratic error, and the subscript c stands for constituency, and r for region. The model is estimated using logit with region-clustered standard errors to account for the lack of independence between constituencies within the same regions.Footnote 26 Also, constituencies within one region might differ from those in another region because regions differ somewhat in remoteness/distance to the capital as well as language, which might influence reporting. Our estimates represent the average constituency-level variation within the same country and conditional on the included controls. We estimate models on each country – Malawi and Zambia – separately. We also provide pooled models in the appendix.
RESULTS
Reporting of Constituency-Level Violence
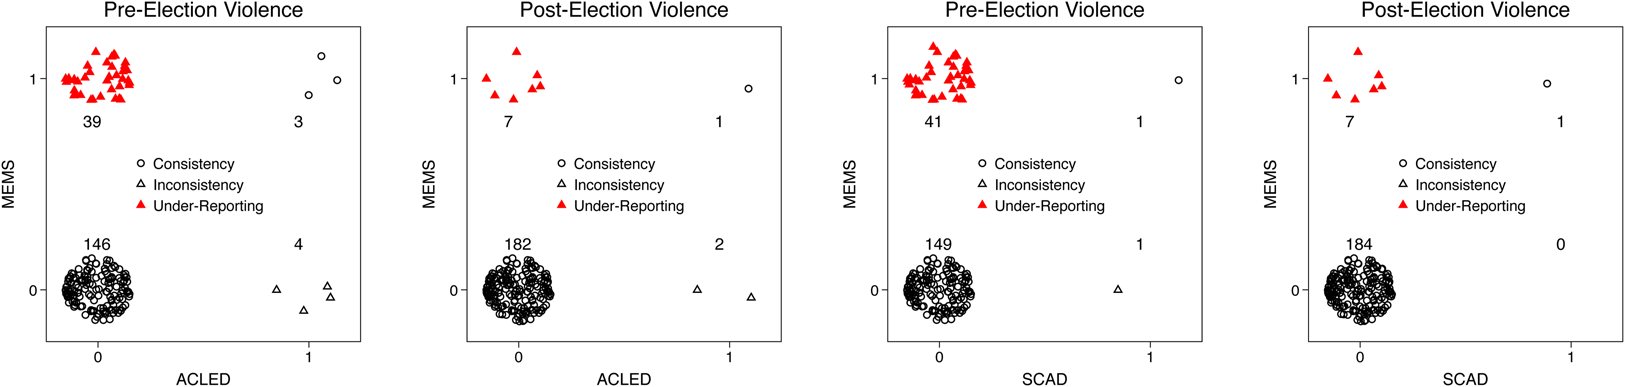
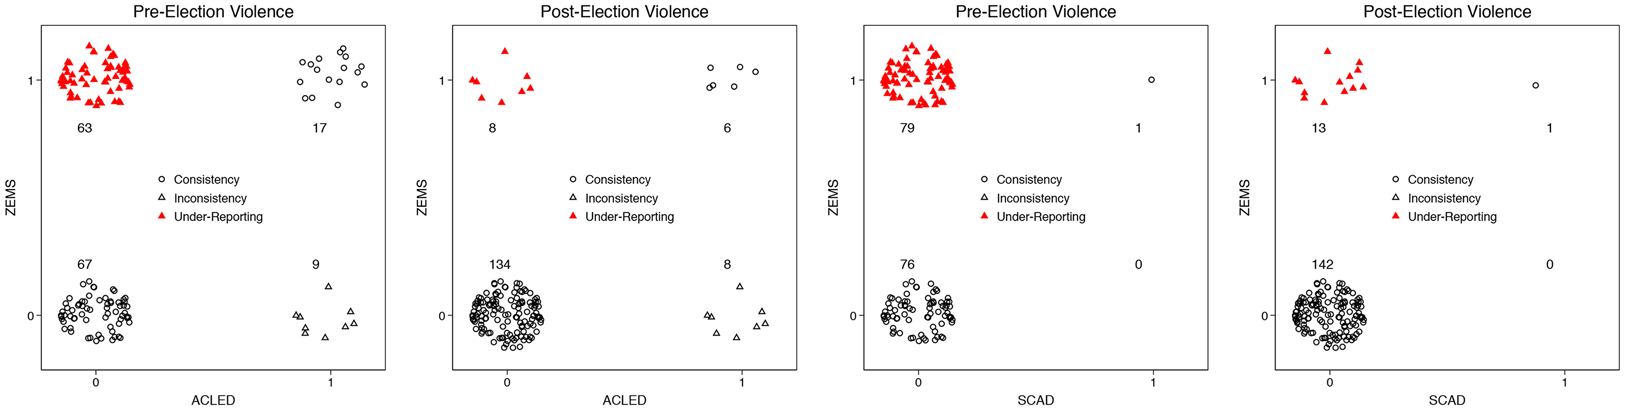
To assess the first two hypotheses, Figures 4 and 5 document consistency between the expert surveys and media-based event data in Malawi and Zambia, respectively. In each of these figures, we show four graphs (from left to right): monitor vs. ACLED pre-election, monitor vs. ACLED post-election, monitor vs. SCAD pre-election, and monitor vs. SCAD post-election. Each marker represents a constituency; we add random noise around the markers to visualize the relative frequency. The location of each data point on the graph denotes whether a constituency was coded consistently in the media-based event data and expert survey. Consistently coded constituencies are located in the upper right (1,1) if both types of datasets coded a constituency as violent, or the lower left (0,0) if both datasets coded it as non-violent. Inconsistently coded constituencies are located in the lower right (1,0) if media-based datasets coded violence but the expert survey did not, and in the upper left (0,1) if the expert survey reported violence but the media event data did not. Numbers indicate the number of constituencies in each group.
Consistency between ACLED/SCAD and Malawi survey (MEMS)

Consistency between ACLED/SCAD and Zambia survey (ZEMS)

Figures 4–5 provide empirical support for the existence of general under-reporting and particularly in the pre-election periods (Hypotheses 1 and 2). Figures 4–5 show several constituency observations located off the diagonal, indicating disagreement between the datasets. In most cases, this disagreement involves constituencies in which the media-based event data reported no violence but the expert survey reported violence. Those cases are clustered in the upper left corner of each graph where ACLED/SCAD = 0 and MEMS/ZEMS = 1 (marked by solid red triangles). In a minority of the inconsistencies, the relationship is reversed: there are a handful of cases where media data reported violence but the expert surveys did not (lower right corner of Figures 4–5). However, overall media data tend to under-report incidents of election violence compared to expert survey data.
The under-reporting of violence in media data compared to survey data is statistically significant. For example, for the pre-election period in Malawi, the survey data indicate that 22 per cent of constituencies experienced violence, while ACLED indicates 4 per cent and SCAD 1 per cent. Paired t-tests indicate that the difference between the survey measure and each of the media measures is highly statistically significant (p < 0.001).Footnote 27 For the post-election period, these differences are somewhat less severe (4 per cent vs. 2 and 1 per cent) but still statistically significant (p < 0.09, 0.01). From the eight comparisons, all but oneFootnote 28 result in statistically significant differences between survey and media measures. This supports Hypothesis 1 about the existence of under-reporting in violence measures drawn from media-based event data.
Moreover, the under-reporting is significantly stronger before elections than afterwards, which supports Hypothesis 2. Figures 4–5 and paired t-tests indicate that media-based event data under-report violence more in the pre- than in the post-electoral period. Appendix Tables A1 and A2 show descriptive statistics: in the pre-election period, consistency between the media data and expert survey data ranges between 49 and 77 per cent, while it ranges between 90 and 96 per cent in the post-election period. Importantly, paired t-tests indicate that these differences between consistency before and after elections are highly statistically significant (p < 0.001). That is, consistency between survey and media data is significantly higher after elections than before elections.
The general trend shows that ZEMS/MEMS are more capable of picking up events than SCAD/ACLED. Nevertheless, in a handful of constituencies ACLED/SCAD found violence but MEMS/ZEMS did not. Looking at these cases we find a number of explanations as to why monitors may not have reported these incidents. In the case of Zambian pre-electoral violence, three of ten cases concern the burning of billboards. These may be examples of recall bias where monitors failed to remember this relatively mild form of violence. There are also cases for which we have reason to question the authenticity of the newspaper reports. The ACLED data include both heavily biased government newspapers and online publications (such as the Zambian Watchdog) without editorial control.
Causes of Systematic Measurement Error
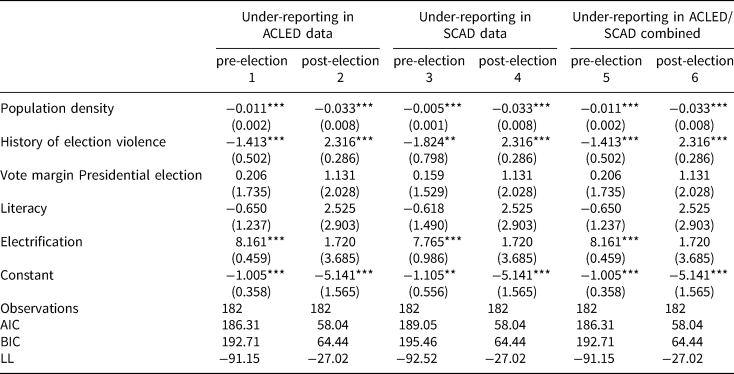
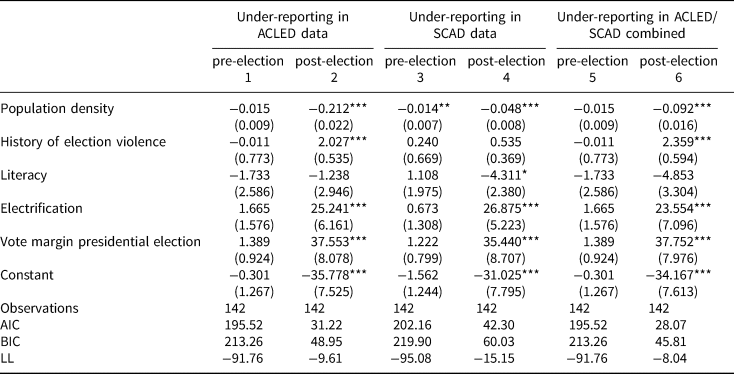
What drives these substantial differences in violence reporting between media and expert survey data? We argue that under-reporting is contingent on constituencies' connectivity and expected violence hotspots, as stipulated in Hypotheses 3 and 4. We test these hypotheses through multivariate analyses. Tables 1 and 2 show estimated logit coefficients for the determinants of under-reporting (whether monitors reported violence but media sources did not) for Malawi and Zambia, respectively. Columns 1 and 2 show the determinants of under-reporting between MEMS and ACLED; Columns 3 and 4 show under-reporting for MEMS and SCAD; Columns 5 and 6 show under-reporting for MEMS with the combined ACLED/SCAD measure. Table 2 is structured the same way but for ZEMS data in Zambia. We remove the capital, Lusaka, from the sample;Footnote 29 we show results with Lusaka included in Appendix Table A3. We also provide results pooling both countries in the appendix (Table A4); the results are robust. An important caveat is needed here: there are fewer post-election violence events than pre-election violence events and also more consistency in the post-election period. The low number of inconsistencies in the post-election period makes the post-election results more unstable.
Determinants of under-reporting between ACLED/SCAD and surveys – Malawi

Note: logit models with robust standard errors clustered on region in parentheses; two-tailed tests. *p < 0.10, **p < 0.05, ***p < 0.01.
Determinants of under-reporting between ACLED/SCAD and surveys – Zambia

Note: logit models with robust standard errors clustered on region in parentheses; two-tailed tests. *p < 0.10, **p < 0.05, ***p < 0.01.
The results in Tables 1 and 2 provide support for the argument that connectivity drives under-reporting (Hypothesis 3) as well as some – concededly weaker – support for the argument that anticipated hotspots drive under-reporting (Hypothesis 4). The estimated coefficients on Population Density are negative and significant in almost all models of Tables 1 and 2. This suggests that higher population density (higher connectivity) is associated with less under-reporting. This supports the Connectivity Hypothesis (Hypothesis 3). While the coefficients on Population Density are highly statistically significant for Malawi (p < 0.01), for Zambia two of these coefficients are insignificant. All coefficients point in the hypothesized direction. As noted above, population density in the African context is highly correlated with political competition (a variable that has been associated with election violence in the literature). In Appendix Tables A5 and A6 we re-run the models without controlling for vote margin in the presidential election. This modified specification strongly reinforces the results related to population density. Without controlling for vote margin, the coefficient for population density is negative and significant for all post- and pre-models for both Malawi and Zambia.Footnote 30
Surprisingly, SCAD and ACLED even missed some fatal cases of pre-election violence in rural areas. For example, lethal election violence in Malawi occurred in both Mulanje (where supporters of the incumbent party killed a Democratic Progressive Party (DPP) supporter for wearing DPP regalia) and Rumphi (where a person interrupting an AFORD meeting was killed). In Zambia, one person was stabbed to death in clashes between the Patriotic Front and the United Party for National Development in Magoye, Southern Province, again without the story reaching the news media. These events clearly show the problem of under-reporting violence outside major urban centers.
Among the control variables, the positive coefficient on Electrification was unexpected. However, Electrification is strongly correlated with Population Density (the correlation coefficient is r = 0.79 in Malawi and r = 0.52 in Zambia). When Electrification and Population Density are interacted (tables not shown), the coefficient on the interaction term is negative and significant in all models. In line with the argument, this indicates that more populated and developed places have less under-reporting in the media-based event data.
In addition to finding evidence that connectivity generates under-reporting, we also find some evidence that expected hotpots receive differential attention. However, these results are weaker and not consistent. Recall that we use two variables to capture potential hotpots: competitiveness (Vote Margin) and History of Election Violence. History of Election Violence is negatively and significantly associated with under-reporting pre-election violence in Malawi (Table 1 Columns 1, 3, 5). This is evidence in favor of the Hotspot Hypothesis (Hypothesis 4). However, coefficients on History of Violence point in the opposite direction in Columns 2, 4, 6 of Tables 1 and 2, indicating that previous violence hotspots are more subject to under-reporting. This is surprising and counter to our expectation. However, as noted earlier, the small number of constituencies with post-election violence and the low under-reporting in the post-election period should caution strong inference from these post-election models.
For the second measure of anticipated hotspots, Vote Margins, the coefficients are consistently in the hypothesized direction (positive), indicating that larger vote margins (less competitive constituencies) tend to have more under-reporting. While the coefficients are consistently in the expected direction, the relationship only reaches statistical significance in the models for post-election violence in Zambia (Table 2, Columns 2, 4, 6). We thus conclude that while there are some signs that under-reporting is more pronounced in anticipated hotspots, that evidence is weaker and limited to particular cases.
These analyses provide support for the argument that election violence measures drawn from media-based event data have systematic measurement error. Both media-based event sources under-report violence; this under-reporting is more pronounced before than after elections; the systematic measurement error is driven by connectivity, with more densely populated areas receiving better coverage; measurement error also seems to be generated by journalists going to and reporting from highly competitive areas within the country, but this seems limited to post-election violence (recent competition) and the case of Zambia.
We now turn to the consequences of these measurement errors. Given that media-based event measures of violence are affected by systematic measurement error, how do they affect our inference? Do our substantive conclusions about the drivers of violence change when using different datasets?
Consequences of Systematic Measurement Error
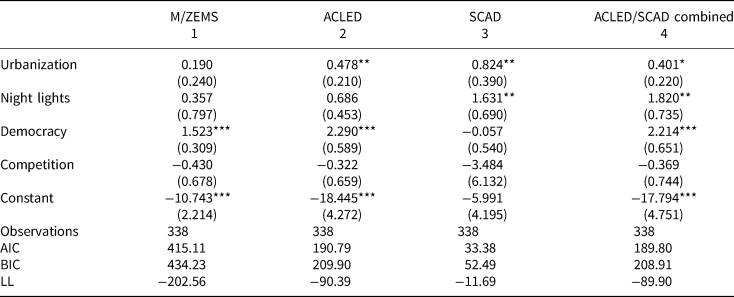
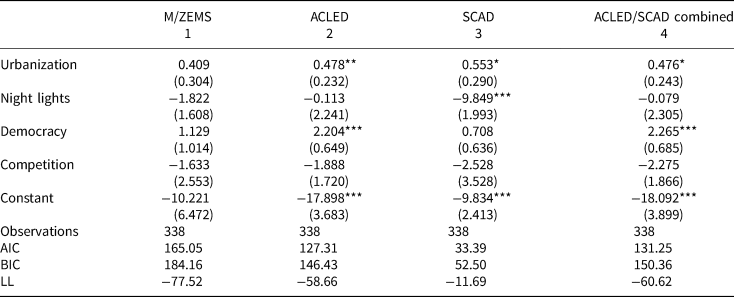
To investigate these questions, we change the dependent variable from Under-reporting to the raw measure of Violence reported in each dataset and period. As outlined in the research design and shown in the descriptive statistics (Appendix Tables A1, A2), these variables include MEMS Pre-election Violence and MEMS Post-election Violence as well as the equivalents for ZEMS, ACLED, SCAD and ACLED/SCAD combined per country and electoral period. Recall that our model specification here emulates a recent constituency-level study on election violence in Africa by Reeder and Bech Seeberg (Reference Reeder and Bech Seeberg2018). Following the analysis of Reeder and Bech Seeberg, the models include measures of urbanization, night lights, competition and democracy. As in the prior analyses, we use logit and robust standard errors clustered by region.Footnote 31 The results for the pre- and post-election period are in Tables 3 and 4, respectively. In each of these tables, Column 1 shows the results for using the dependent variable from the monitor surveys, Column 2 is for ACLED, 3 for SCAD, and 4 for the combined ACLED/SCAD measure of election violence.
Determinants of pre-election violence using different outcome measures

Note: logit models with robust standard errors clustered on region in parentheses; two-tailed tests. *p < 0.10, **p < 0.05, ***p < 0.01.
Determinants of post-election violence using different outcome measures

Note: logit models with robust standard errors clustered on region in parentheses; two-tailed tests. *p < 0.10, **p < 0.05, ***p < 0.01.
The results point to important differences for inference. Differences in measuring the dependent variable can generate significant relationships where none may exist. The coefficients on Urbanization and Night Lights suggest significant relationships with violence in media event datasets, but not in the expert survey datasets. The estimated coefficient on Urbanization is not significant in the monitor data but is significant for ACLED, SCAD and the combined media data (Columns 2–4 in Tables 3 and 4). Using ACLED data, Reeder and Bech Seeberg (Reference Reeder and Bech Seeberg2018) find urbanization to be significantly correlated with election violence at the constituency level in their analysis of Kenya and Zimbabwe. Although this is not their main finding, our results here suggest that this particular positive association between urbanization and election violence in Reeder and Bech Seeberg may be, at least partially, an artifact of the event data.
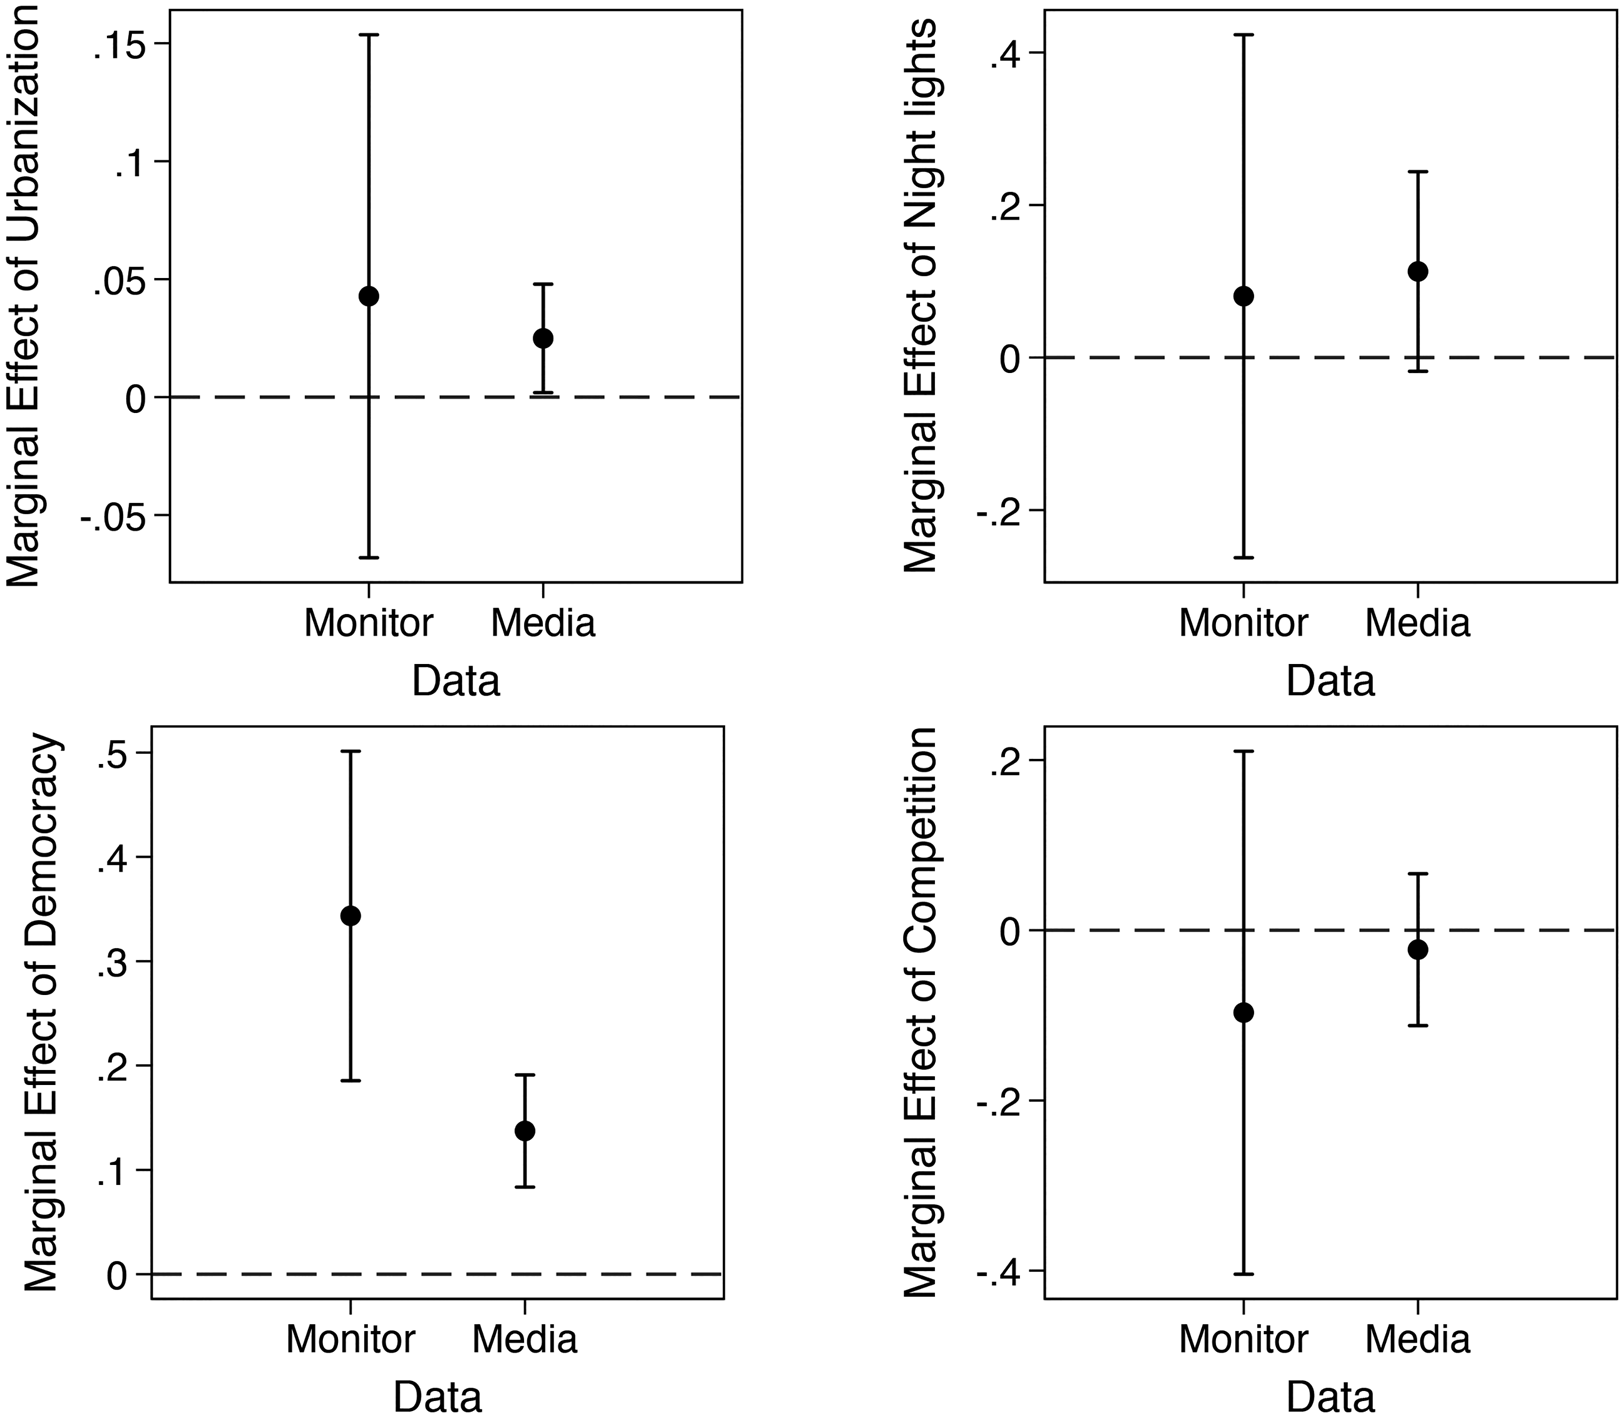
Similar to urbanization, the coefficient on Night Lights (a proxy for development) is not significant for the monitor data but is significant for SCAD and the combined media data (Columns 3–4 in Table 3 and Column 3 in Table 4). The expert survey data suggest that there is no relationship between election violence and urbanization and development. In contrast, the media event data suggest significant relationships for these variables. Researchers might also come to different conclusions about the substantive magnitude of the effect. For example, the marginal effect of democracy on election violence is smaller in media event data than in monitor data, which is illustrated in Figure 6 (estimated from Table 3 columns 1 and 4).
Consequences of reporting bias: different predictions depending on monitor or media event data

As an additional robustness test, we ran all our models again including all violent events in SCAD and ACLED (independent of whether they were directly related to the election or not) for the period under investigation. The results are shown in the appendix (Tables A9–A11). Including non-election-related violent events does not change our substantive results and adds surprisingly few additional events; in the case of Zambia and Malawi, most political violence in this time period was related to the election.Footnote 32
Based on these results for Malawi and Zambia, we propose some ways in which election violence studies using media-based event data may over- and under-estimate relationships. Studies using geocoded media-based event data tend to skew the effects of population density and development, showing relationships where none may exist. These over-estimates seem largely driven by the selection of journalists into urban areas: they are more likely to reside and report from urban, more densely populated, economically vibrant centers as opposed to more remote areas with worse communication technology. Further, studies using media-based event data might find smaller effects for some variables (such as democracy) than they would find using higher-quality data.
CONCLUSION
In this article, we have examined the prevalence, causes and consequences of systematic measurement error in violence measures drawn from media-based event data. From qualitative work on election violence we know that violence varies significantly across space (Boone Reference Boone2011), but in this article we have discussed the potential limitations of existing conflict data for mapping such election violence systematically across space. As a way to assess and correct for under-reporting, we have introduced a new expert survey-based approach for measuring election violence at the constituency level. We have argued that the new approach is better designed to systematically measure election violence at the constituency level. Although restricted to two countries in this study, Malawi and Zambia, the method could be replicated in other places.Footnote 33 Finally, we used these new data to document the causes and consequences of under-reporting and systematic measurement error in the media-based civil conflict literature, pointing to problems in achieving consistency and geocoding accuracy.
So what should researchers interested in sub-national variation in election violence do with this information? Most research on sub-national variation in election violence is based on single-election studies (for example, Dercon and Guitérrez-Romero Reference Dercon and Gutiérrez-Romero2012; Ishiyama, Pulido Gomez and Stewart Reference Ishiyama, Pulido Gomez and Stewart2016; Linke Reference Linke2013; Wilkinson Reference Wilkinson2004). When the country sample is small, our survey-based approach offers a realistic and preferable alternative to existing media-based event data. Other research on sub-national variation includes several countries. Here, the most radical solution would be to altogether abandon media-based event data as a source. This would, however, not be our recommendation. For multi-country studies, media-based event data are more cost effective and enable comparisons across time and space. Thus researchers may still wish to use event data but should be aware of their systematic measurement error, explicitly discuss them as weaknesses and try to remedy them.
As we demonstrate, violence measures from monitor and media data cannot be used interchangeably, so it is important for researchers to choose violence measures carefully and to demonstrate robustness across measures where possible. The results obtained in this study should help researchers account for measurement error in event data. This article has helped to identify some variables that may introduce systematic measurement error. It has also provided insights about the direction of such error. This information may be used to run sensitivity tests with simulated data (Gallop and Weschle Reference Gallop and Weschle2017). Moreover, we have also shown that under-reporting is not equal across event data sources, but is higher in SCAD than ACLED. Researchers interested particularly in more low-scale incidents of election violence would do well to analyze data sources that do not solely rely on two or three international news outlets but a range of domestic and non-media sources as well. For sub-national studies, researchers should also investigate the accuracy of geocoded information in these datasets.
The results in this article also have important implications for prominent findings in existing work on election-related violence. Using data from Indian newspapers, Wilkinson (Reference Wilkinson2004) shows, among other things, that ethnic riots are more common in large cities and in places with a history of violence. However, our results suggest that newspapers are better at picking up violent events in urban areas and in historic hotspots. Bhasin and Gandhi (Reference Bhasin and Gandhi2013), using reports extracted from the Reuters news database, show that government electoral repression is more common after than before elections. However, our results suggest that media-based data record events in the post-electoral period to a higher extent than events in the pre-electoral period.
This article focuses on systematic measurement error in sub-national data, but many of these measurement errors also have consequences for cross-national work. Media freedom and journalistic capacity vary significantly between countries, implying that countries with a better infrastructure and a more independent flow of information have more reports than otherwise similar countries where information is more restricted for political and/or capacity reasons. For instance, it seems likely that a higher share of incidents would be captured in a country like South Africa than in the Democratic Republic of Congo or Ethiopia, even if the same events happened.
Our discussions have focused specifically on violence related to elections. However, we contend that our findings have implications for violence event data more generally. There is no reason to believe that under-reporting of violence or systematic measurement error, particularly stemming from uneven reporting from urban and rural areas as well as geocoding problems, would be more pronounced in and around elections than during time periods disconnected from the electoral campaign. In fact, the opposite is likely true. Elections signify a focal event, as local and international media attention is high. The systematic measurement error and under-reporting we find on violence in media-based event data around elections is likely to be as high, or probably even higher, when studying violence unrelated to elections. Thus researchers have to take systematic measurement error seriously when studying violence at the sub-national level.
Supplementary material
The supplementary material for this article can be found at https://doi.org/10.1017/S0007123418000509
Acknowledgements
We are indebted to the National Initiative for Civic Education, the Southern African Centre for Constructive Resolution of Disputes, the Institute for Policy Interaction, the Southern African Institute for Policy and Research, Boniface Chembe, Marja Hinfenlaar, Ollen Mwalubunju, Chimfwembe Mweenge and Nandini Patel for support in organizing our surveys. Invaluable research assistance was provided by Josephine Chanda, Felix Chauluka and Edward Goldring. We are grateful for comments and support provided by Catherine Boone, Johan Broché, Kristine Höglund, Holger Kern, Jonathan Krieckhaus, Patrick Kuhn, Bryce Reeder, Christopher Reenock, Nils Weidmann and Laron Williams. The study was supported by grants from the Swedish Research Council (VR DNR 2012-6653), the Magnus Bergvall Foundation (2015-00698) and the Economic and Social Research Council (ES/R005753/1). IRB#2004569, approved by University of Missouri Institutional Review Board Office. The two authors contributed equally to this article.