Introduction
While nearly 98% of the Antarctic continent is glaciated, the remaining ice-free areas harbour terrestrial ecosystems in hyper-arid polar desert environments such as the McMurdo Dry Valleys and volcanic islands of McMurdo Sound. The absence of vegetative cover and human settlement in these environments simplifies their hydrologic systems, which provides a natural laboratory to study streamflow, hyporheic exchange, and watershed connectivity (Gooseff et al. Reference Gooseff, Barrett, Adams, Doran, Fountain and Lyons2017). Most of the year, air temperatures remain below freezing with low annual precipitation as snowfall. However, three to six weeks during the summer, temperatures are warm enough to produce meltwater stream flow from local glaciers, feeding into closed basin, ice-covered lakes (Gooseff et al. Reference Gooseff, McKnight, Carr, Baeseman, Gooseff, Lyons and McKnight2010).
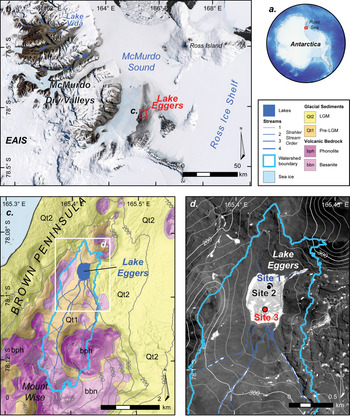
Most of these lakes are highly saline and covered with 3 to 5 m of ice that seasonally fluctuates in thickness (Doran et al. Reference Doran, Fritsen, McKay, Prsicu and Adams2003, Gooseff et al. Reference Gooseff, Wlostowski, McKnight and Jaros2017). Several rare ‘ice-sealed’ lakes retain thicker perennial ice cover and are nearly frozen to their base year-round, potentially preserving millennia of past hydroclimate variability (Murray et al. Reference Murray, Kenig, Fritsen, McKay, Cawley and Edwards2012, Dugan et al. Reference Dugan, Doran, Wagner, Kenig, Fritsen and Arcone2015) (Fig. 1). Additionally, the hydrologic processes influencing such polar desert environments hold implications for biological adaptation to extreme environments on Earth, and possibly on other planets such as Mars (Gooseff et al. Reference Gooseff, McKnight, Carr, Baeseman, Gooseff, Lyons and McKnight2010).
a. Antarctic continent showing the location of b. lakes in the McMurdo Dry Valleys. c. Overview map of the Lake Eggers watershed and tributary ephemeral streams, and the surficial and bedrock geology of Brown Peninsula (Christ & Bierman Reference Christ and Bierman2020, Kyle Reference Kyle1990). d. Panchromatic satellite image showing Lake Eggers, ice core sites, and tributary streams. Imagery: © 2013 DigitalGlobe, Inc., DEM data: Howat et al. Reference Howat, Porter, Smith, Noh and Morin2019; GIS lake shapefiles: McMurdo LTER)

Whereas many studies of Antarctic lakes focus on those in the colder, drier, and more stable ancient landscape of the McMurdo Dry Valleys (Murray et al. Reference Murray, Kenig, Fritsen, McKay, Cawley and Edwards2012, Dugan et al. Reference Dugan, Doran, Wagner, Kenig, Fritsen and Arcone2015, Gooseff et al. Reference Gooseff, Barrett, Adams, Doran, Fountain and Lyons2017), here we focus on Lake Eggers, a small ice-sealed lake on Brown Peninsula in the mild coastal climate of McMurdo Sound (78°5.4'S, 165°4.6'E, 212 m elevation; Fig. 1). Brown Peninsula is composed of several north–south aligned basaltic volcanoes, with Lake Eggers situated in a closed basin among eroded cinder cones (Kyle Reference Kyle1990). Late Pleistocene glacial sediments mantle the landscape surrounding Lake Eggers, with unweathered, hummocky glacial drift deposited during the Last Glacial Maximum along its eastern shore and older, more weathered Pleistocene glacial drift and basanite bedrock along the northern, western, and southern shores (Christ & Bierman Reference Christ and Bierman2020). Two small snow-filled gullies originating below Mount Wise, the tallest peak on Brown Peninsula, terminate into deltas feeding the southern end of Lake Eggers. To the north, a smaller delta also feeds into the lake from Frame Ridge, a small cinder cone volcano (Fig. 1).
The climate of McMurdo Sound is milder than the McMurdo Dry Valleys, and more strongly related to climate variability in the Ross Sea. Mean summer air temperature along the coast (-5°C) is warmer than the Dry Valleys (-7°C) and average relative humidity (~64%), is greater than at similar elevations in the McMurdo Dry Valleys (~41%) due to moisture-bearing south-easterly winds from the Ross Sea (Marchant & Head Reference Marchant and Head2007). This milder coastal climate extends to the entire western Ross Sea due to its unique relationship to the regional modes of climate variability such as the Ross Sea Dipole.
The Ross Sea Dipole is driven by fluctuations of the Southern Annular Mode (SAM) and impacted by other Pacific climate oscillations like the El Nino Southern Oscillation and Interdecadal Pacific Oscillation (Bertler et al. Reference Bertler, Conway, Dahl-Jensen, Emanuelsson, Winstrup and Vallelonga2018). A positive SAM generally causes equatorward heat flux; however, two regions of Antarctica, the western Ross Sea and Weddell Sea, instead experience a poleward shift in heat flux, increasing heat and moisture transport across the Ross Ice Shelf and driving the Ross Sea Dipole (Marshall & Thompson Reference Marshall and Thompson2016, Bertler et al. Reference Bertler, Conway, Dahl-Jensen, Emanuelsson, Winstrup and Vallelonga2018). This regional fluctuation strongly affects weather patterns in McMurdo Sound, shaping the development of the surrounding ice ecosystems and providing a potential paleoclimate archive for the last millennium of Ross Sea Dipole and SAM variability.
Given these geologic and climatic distinctions, Lake Eggers offers a unique setting to study the hydroclimate variability of an ice-block lake located in an under-sampled, dynamic landscape. The regional microclimate provides the potential to study an Antarctic ecosystem directly linked to a dynamic landscape history and a greater hydrologic connectivity that McMurdo Dry Valley records do not typically assess. Here we analyse the geophysical and geochemical properties of Lake Eggers ice to address two core questions: 1) when did Lake Eggers form and what are its source waters? And 2) how did regional climate history influence the hydrology of this lake?
Methods
Ground penetrating radar (GPR)
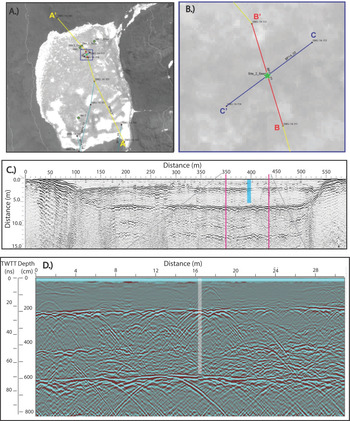
During the summer 2014–15 field season, three GPR profiles were collected across Lake Eggers to examine its ice on a basin scale. Profiles were collected using a GSSI SIR 3000 controller and GSSI antennas (200 MHz and 400 MHz). All profiles were collected in distance mode with a terrain-calibrated survey wheel, a 20 scan/m scan density 2048 sample window depth, 100 kHz transmission rate, and vertical infinite response filter windows of 50–600 MHz and 100–800 MHz for the 200 MHz and 400 MHz antennas, respectively (Mackay et al. Reference Mackay, Marchant, Lamp and Head2014). Three GPR profiles crossed the deepest and most continuous core at Site 2 (Fig. 2). Data was processed using Radan 7.0 software for: 1) static position correction, 2) distance normalization using GPS and/or survey wheel data, 3) application of a finite infinite response filter with a 120/220 MHz, or 340/480 MHz bandpass boxcar filter for the 200 MHz and 400 MHz survey data, respectively, 5) gain adjustment, and 6) migration. A constant travel velocity of 0.168 m/ns (dielectric of 3.18) was used to estimate depth from radar wave travel time (Mackay et al. Reference Mackay, Marchant, Lamp and Head2014).
Ground penetrating radar (GPR) transects across Lake Eggers: a. Overview map showing core sites and profiles (yellow, blue, and red lines). Inset box indicates the extent of panel B. b. GPR profiles collected near Site 2. c. 200 MHz GPR profile across Lake Eggers. The blue vertical line indicates the approximate location and depth of the core at Site 2. d. 400 MHz GPR profile CE–CE' across Site 2. Grey bar approximates the location and depth of the borehole. Vertical scales in c. and d. as two-way travel time (TWTT) and depth, assumed average radar travel velocity of 0.168 m/ns.

Ice core recovery & sampling
During the same field season, we recovered ice cores from three sites on Lake Eggers to examine ice structure and geochemistry (Table I). Ice cores were recovered to the maximum depth of lake ice at three locations using a Kovacs Mark II hand coring system (1 m x 0.09 m diameter core barrel). Cores were described in the field and only core fragments that contained sediment, algae, or other distinctive qualities were kept and stored for analysis (Table I). Core sections were transported and stored frozen from the field to McMurdo Station to Boston University (BU). At BU, core sections were cut in half lengthwise using an isopropanol-sterilized steel blade to create an archive which was then frozen for long-term storage. The sample halves were then sliced into 50–100 mm subsets, using the same blade DI and isopropanol-rinsed between each core, and melted at room temperature in plastic Whirl-Pak bags. Following melting, samples were decanted and 25 ml of meltwater was stored refrigerated in glass scintillation vials for isotopic analysis. Samples containing visibly high concentrations of sediment and/or algae were fully decanted, sediment and algae were dried in a low–temperature oven (50°C) for 24 hours. The remaining ice melt samples were stored in DI rinsed, sealed plastic containers for additional analyses.
Ice core location and recovery from Lake Eggers.

Notes: Above mean sea level - (amsl). Saved fragments represent the portions of the core shipped to Boston University, Boston MA and available for analyses.
Lake ice chemical and physical analyses
Following drying, subsamples of sediment were cleaned for grain size analysis. Large algal fragments were removed with sterilized tweezers under a light microscope and total biomass was weighed. Remaining sediment subsamples were placed into beakers with 100 ml deionized water, sonicated for 10 min, and decanted. The supernatant was dried at 50°C to isolate fine-grained sediments. Rinsing, sonication, and decanting procedures were repeated until the supernatant was clean of fine sediment. Dried sediment samples were massed, inspected under a light microscope, and classified for grain size according to the Udden-Wentworth Scale (Wentworth Reference Wentworth1922).
Algae fragments were cleaned by removing sediment grains with steel tweezers, and then stored in glass scintillation vials. Three samples were submitted to the National Ocean Sciences Accelerator Mass Spectrometer Facility at the Woods Hole Oceanographic Institution, where they were treated with acid-base-acid leaches and analysed for δ13C, Δ14C, and radiocarbon dated. Sample results were delivered in terms of 14C years. To account for temporally and spatially variable atmospheric 14C production rates, results were calibrated using the CALIB 7.1 program using the IntCal13 Southern Hemisphere atmospheric radiocarbon calibration curve (shcal13.14c) (Hogg et al. Reference Hogg, Hua, Blackwell, Niu, Buck, Guilderson, Heaton, Palmer, Reimer, Reimer, Turney and Zimmerman2013, Reimer et al. Reference Reimer, Bard, Bayliss, Beck, Blackwell and Ramsey2013).
Decanted ice melt samples were analysed for stable isotopic ratios of δ18O and δD. Site 1 and 3 samples were analysed at the Iowa State Stable Isotopes Laboratory on a Picarro L2130-I Isotopic Liquid Water Analyzer. Site 2 ice samples were analysed at the BU Stable Isotope Laboratory utilizing a GVI Multiflow isotope ratio mass spectrometer. δ18O and δD analyses were completed through CO2 equilibration and pyrolysis in a ChromeHD system, respectively. At least two replicate analyses were performed for quality assurance and values were averaged for each depth interval. Sample results were normalized to the Vienna Standard Mean Ocean Water and Standard Light Antarctic Precipitation scale using International Atomic Energy Agency (IAEA) and USGS 47 and USGS 49 reference standards. Excess deuterium (D-excess) was calculated using the equation from (Craig Reference Craig1963):
 $${\rm D}_{{\rm excess}} = {\rm \delta D} - \lpar {8\,\ast \,{\rm \delta }^{18}{\rm O}} \rpar + 10$$
Excess ice melt samples were measured for salinity and pH at room temperature using a CDC401 and PHC301 Hach Probe. Site 1 & 3 melt samples were measured directly after melting. Due to instrument constraints, Site 2 melt samples were refrigerated for two weeks before measurements were taken.
Refrozen ice melt samples (stored in new, DI rinsed, sterile plastic sealed containers) were melted in a ~ 40°C water bath. Once melted, samples were shaken and filtered into separate acid washed collection bottles, ~ 10 ml liquid through nitrocellulose filters for dissolved silica (DSi) testing and the remaining liquid through pre-combusted 25 mm Glass Microfiber Filters (GFF) for dissolved inorganic phosphorus (DIP) and dissolved inorganic nitrogen (DIN: nitrite, nitrate, ammonia) analyses. GFF filters retaining particulate organic material were dried in an oven at 60 °C for ~24 hr and sent to the BU Stable Isotopes Lab to analyse the natural abundance of δ15N and δ13C in each sample. Samples were weighed, then flash combusted at 1800°C in a Eurovector CN analyzer. Chromatographically separated combustion products (CO2, N2, and H2O) of interest (CO2, N2) were then run through a mass spectrometer for isotope analysis. Ratios were compared to a secondary gas standard calibrated to international standards (NBS 20, NBS 21, and NBS 22 for 13C and atmospheric N2 and IAEA standards N-1, N-2, and N-3 for 15N). Nine of the sample filters were reanalysed multiple times as values were near the detection limit. These low-level measurements were averaged across the replicate samples for each depth interval. Two samples required multiple filters to filter all available meltwater. In this case the average value was taken across all filters corresponding to the same depth interval.
Filtered meltwater was subsampled and analysed for DIP, DIN, and DSi. Analyses were performed using micro-colorimetric assays based on a 96-well micro-plate format and read on a SpectraMax geminiXS Plate Reader at the Boston University Chemical Instrumentation Center. DIP was measured using the molybdenum blue method, nitrite using sulfanilamide and NEDD, ammonium using indophenol blue, and DSi using ammonium molybdate, all following the protocols outlined by Ringuet et al. (Reference Ringuet, Sassano and Johnson2011). The average mean detection limits for DIP, nitrite, ammonium, and DSi were 0.55 ± 0.12 μM, 0.45 ± 0.27 μM, 0.96 ± 0.65 μM, and 0.97 ± 0.45 μM, respectively. These detection limits varied by sample analysis date, and samples below the detection limit of a given run were not included in the final analysis. NOx was also measured using the nitrite colorimetric assay with nitrate reduction via vanadium (III) chloride as outlined by Doane & Horwáth (Reference Doane and Horwáth2003). However, due to methodological issues, final nitrate concentrations were unrealistic and not analysed further in this study.
Statistical analysis: empirical orthogonal function
Geochemical data were run through an Empirical Orthogonal Function (EOF) analysis to examine depth trends across multiple variables. Measurements for 7 input variables (pH, salinity, δD, δ18O, ammonium, DSi, and DIP) were averaged across all three core sites for each depth interval to create “lake average” measurements by depth. δ15N and δ13C values were excluded in the EOF analysis because too few depth intervals contained sufficient particulate matter to resolve trends with depth. Singular value decomposition (svd {base}), creation of the covariance matrix (diag {base}), and ordination of successive eigenvectors manually completed in base R (R Core Team 2017). Data were first run through the EOF raw to see if any principal components contained a background trend that explained a significant (> 2%) proportion of the variance (Mayewski et al. Reference Mayewski, Meeker, Whitlow, Twickler, Morrison, Alley, Bloomfield and Taylor1993). The data were then detrended and run through the EOF function again to identify other underlying depth-related data trends. Using a moving average window, depth trends were calculated using the package forecast v8.2 then subtracted from the raw data (Hyndman & Khandakar Reference Hyndman and Khandar2008).
Results
GPR
Several prominent near-horizontal reflectors span the entire length of GPR profiles AE–AE' and CE–CE' (Fig. 2). Prominent reflectors at ~2 m, ~3 m, ~5 m, and ~6 m depth appear in the high resolution 400 MHz profile CE–CE'. The ~2 m reflector displays a high magnitude of reflected energy and prominence across the entire lake. Both the ~3 m and ~5 m horizons are discontinuous and display a lower reflected energy magnitude compared to the other reflectors. The most prominent reflector occurs at ~6 m depth and possibly marks either the lake bottom, or the base of the ice and beginning of a liquid brine layer (Fig. 2). Reflectors beneath this depth (visible in profile AE–AE' only) may be data artifacts or paleo lakebeds, but without additional data to constrain the interpretation of these deepest layers, they are not considered further in this study.
Ice core morphologic description
Three ice cores were collected from Lake Eggers. The Site 1 core (2.32 m) was collected from the north-central area of Lake Eggers and contained clear ice that did not contain visible air bubbles (Table I; Figs 1 & 3). The Site 2 core (5.26 m) was collected ~130 m from Site 1 in the north central area of Lake Eggers (Table I; Fig. 1). The top 1.69 m of the core was clear ice. Below 1.70 m, the ice contained spherical air bubbles with some isolated sediment and algae. At 2.07 m depth, air bubbles became elongated and the concentration of algal fragments increased. Ice recovered along this interval was slushy. At 3.05 m depth, there was a concentrated horizon of algae and increasing sediment content downcore. Below 3.38 m sediment concentration increased. At 4.42 m depth there was a 30 mm thick sediment horizon with a strong organic odour. The next sediment horizon occurred between 4.61–4.89 m and included a large black sediment band (40 mm) that spanned the entire width of the core. Below 4.89 m there were two additional sediment horizons with a strong organic odour. At ~5.26 m core recovery ceased due to slush in the auger hole and a limited number of auger extension rods (Fig. 3). The Site 3 core (0.795 m) contained all clear ice and was collected close to an active stream delta on the southern shore of Lake Eggers (Table I; Fig. 1). Unlike the other core sites, the surface ice at Site 3 was characterized by regelation ice with an uneven, puckered surface.
Chemical results and photographs of lake ice cores: Site 1 (blue), Site 2 (black), and Site 3 (red). Vertical error-bars for pH, salinity, δD, δ18O, δD-Excess, ammonium (NH4+), phosphate (PO43-), silicate (SiO42-), δ15N, and δ13C represent depth interval. Dashed lines for δD and δ18O represent replicate minimum and maximum values. NH4+, PO43-, and SiO42- mean detection limits were 0.959 ± 0.650 μM, 0.550 ± 0.120 μM, and 0.965 ± 0; absence of concentration indicates results below this limit. Horizontal error-bars represent the standard deviation of replicates for nutrients, and multiple sub samples from a single depth for δ15N and δ13C.

Chronology
Three ice-encased algae fragments were recovered from the Site 2 core and yielded radiocarbon ages that increased with ice core depth: 10 ± 15 14C year before present (14C yr bp) (3.05–3.15 m depth), 465 ± 20 14C yr bp (4.49–4.61 m depth), and 830 ± 20 14C yr bp (4.81–4.89 m depth). To correct for changes in the atmospheric reservoir of 14C through geologic time, a southern hemisphere calibration curve, SH Cal13.14c (Hogg et al. Reference Hogg, Hua, Blackwell, Niu, Buck, Guilderson, Heaton, Palmer, Reimer, Reimer, Turney and Zimmerman2013), was applied to each non-modern (i.e. > 50 yr bp) radiocarbon age. Calibration of these ages yielded 514 ± 15 calibrated (cal.) yr bp (4.49–4.61 m depth), and 735 ± 15 cal. yr bp (4.81–4.89 m) (Fig. 3, Table II).
Radiocarbon chronology

Notes: Radiocarbon analysis conducted at NOSAMS. Radiocarbon results corrected for isotopic fractionation using unreported δ13C values measured using accelerator mass spectrometry. Results calibrated using the CALIB 7.1 program with the IntCal13 Southern Hemisphere atmospheric radiocarbon calibration curve (shcal13.14c) (Hogg et al. Reference Hogg, Hua, Blackwell, Niu, Buck, Guilderson, Heaton, Palmer, Reimer, Reimer, Turney and Zimmerman2013).
Statistical analysis and stratigraphic characterization
The raw and detrended EOF analyses each produced 7 principal components. The first 3 from each analysis explained a significant (> 2%) amount of variability within the lake ice's chemical composition with depth. The second and third principal components from the raw data (Raw-PC2 and Raw-PC3) matched the patterns shown in the first two principal components of the detrended data (Detrended-PC1 and Detrended-PC2) indicating that only the first Raw-PC1 was a background trend. The principal components of de-trended data visually display changes in their chemical patterns around 2.0, 3.0, and ~4.5 m depth (Fig. 4). Raw-PC1 explained 75.03% of the variance in lake ice chemical composition with depth and had a decreasing background trend with depth. This trend was primarily driven by changes in δD (EOF loading = 0.98). Detrended-PC1 explained 56.7% of the variance in lake ice chemical composition with depth, its pattern first displayed increased variability at 3 m, and it was driven primarily by changes in dissolved ammonium concentrations (EOF loading = 0.96). Detrended-PC2 explained 19.7% of the variance, its pattern first displayed an increase in variability at 2 m, and it was driven primarily by changes in dissolved silicate concentrations (EOF loading = 0.95). Detrended-PC3 explained 13.0% of the variance, displayed a large increase in variability around ~4.8 m, and was primarily driven by changes in dissolved phosphate concentrations (EOF loading = 0.97) (Fig. 4).
Multivariate empirical orthogonal (EOF) analysis of pH, salinity, δD, δ18O, ammonia, silicate, and phosphate results. The first raw data principal component (RAW-PC1) shows the background climate trend, and the first three principal components with the background trend removed. Red dashed line shows depths of algae radiocarbon dates. On the right, coloured panels show ice units according to morphology, chemistry and the proposed timing of climate events deduced from the EOF analysis.

Considering the morphologic changes observed in the Site 2 core around 2 m, the prominent GPR reflector at 2 m, and the pattern shift at 2 m seen in Detrended-PC2 of the EOF analysis, we will characterize the geochemical stratigraphy of the lake ice into two units: upper ice (0–2 m) and lower ice (2–5.26 m) ice.
Upper ice: 0–2 m
The upper 2 m of ice in all three ice cores contained clear ice. Meltwater salinity was fresh with a maximum value of 0.34 PSU (Site 2, 1.90–2.07 m). Meltwater pH was variable between depth intervals, with a minimum of 5.41 (Site 1, 0.43–0.50 m) and maximum of 9.71 (Site 2, 1.90–2.07 m). The upper ice did not contain ice-encased sediment or algae (Fig. 3). δ18O ranged between -32.91‰ (Site 1, 1.92–1.99 m) and -25.61‰ (Site 1, 0–0.07 m)., and δD ranged between -253.04‰ (Site 1, 1.92–1.99 m) and -208.41‰ (Site 1, 0–0.07 m) (Fig. 3). Across all cores, both δD and δ18O were strongly, negatively correlated with depth (δD: r 2 = -0.82 P < 0.0001, δ18O: r 2 = -0.86 P < 0.0001). D-excess values were positive for both Site 1 and 3. At Site 2, D-excess values were negative from 0–0.85 m and positive for the rest of the core (Fig. 3). Average δD and δ18O fell within range of other McMurdo Dry Valley lakes (Dowling & Lyons Reference Dowling and Lyons2005) and displayed a strong positive, linear trend with one another (y = 6.09x – 54.56, r 2 = 0.98, P < 0.0001) with a slope (6.09) less than the global meteoric water line (GMWL) slope (8) (Craig Reference Craig1963) (Fig. 5). At 2 m, δ18O ratios increased between adjacent depth intervals. Ratios increase after the 1.92–1.99 m minimum at Site 1 as well, but there were too few points to reliably create a significant trend (Fig. 3).
δ18O vs δD at Lake Eggers and other McMurdo Dry Valley lakes. a. δ18O vs δD at Lake Eggers alongside modern snow from Brown Peninsula (Christ & Bierman Reference Christ and Bierman2020), the local meteoric water lines (LMWL) of glacial ice, snow pits, and fresh snowpack in the McMurdo Dry Valleys (Gooseff et al. Reference Gooseff, Lyons, McKnight, Vaughn, Fountain and Dowling2006), and global meteoric water line (GMWL) (Craig Reference Craig1963). b. δ18O and δD of all Lake Eggers samples (grey) compared to other McMurdo Dry Valley lakes and the GMWL. MDV lake data courtesy of the McMurdo Dry Valleys Long Term Ecological Research Program database (https://mcm.lternet.edu, Dowling & Lyons Reference Dowling and Lyons2005).

The upper ~2 m of ice contained low dissolved nutrient concentrations across all cores. NH4+ concentrations ranged from 0.40 μM (Site 1, 0.28–0.36 m) to 20.22 μM (Site 2, 0.60–0.70 m). DIP concentrations ranged from 0 μM to 1.40 μM (Site 2, 1.90–2.07 m). DSi concentrations ranged from 0 μM to 14.70 μM (Site 2, 1.90–2.07 m) (Fig. 3). Stable isotope ratios for δ13C and δ15N were dependent on the quantity of ice-encased organic matter filtered for each depth interval. Many depth intervals did not contain enough filtrate material to quantify these values and as such the chemical stratigraphy for these measurements is not as robust. Site 1 yielded 8 intervals, Site 2 yielded 4 intervals, and Site 3 yielded 2 intervals with enough filtrate to be measured above 2 m. δ13C ratios ranged from -35.53 ‰ (Site 1, 0.07–0.15 m) to -14.94 ‰ (Site 2, 1.60–1.69 m). δ15N ratios ranged from -24.04 ‰ (Site 2, 0.28–0.40 m) (no outlier = -5.91 (Site 2,1.60–1.69 m)) to 12.13 ‰ (Site 1, 0–0.07 m) (Fig. 3).
Lower ice: ~2–5.29 m
The lower ice (2.00–5.85 m) was described using the longest ice core, Site 2. Meltwater salinity in the lower ice was also fresh ranging from 0.08 PSU (2.07–2.18 m) to 3.38 PSU (4.81–4.89 m) and generally increased with depth. The maximum salinity measurement corresponds with the thickest (40 mm) sediment band observed in the core. Meltwater pH below 2 m continued to be variable, ranging from 7.47 (2.07–2.18 m) to 10.39 (5.24–5.29 m) (Fig. 3). Sediment concentrations were sufficient for grain size analysis below 3 m, with the greatest sediment content near the base of the core and the thickest sediment band (40 mm) between 4.84–4.88 m depth. On average, each sediment horizon was made up of 37% algal material. Of the remaining sediment, the average grain size distribution was 60% sand, 40% silt and clay (Fig. 3).
Below 2 m, δ18O ratios were more variable, but decreased with depth from a maximum of -29.03‰ (2.18–2.27 m) to the core minimum of -32.83‰ (4.49–4.61 m) (Site 2). Below 4.61 m, δ18O ratios increased until the core bottom. δD ratios ranged from -252.61‰ (4.49–4.61 m) to -229.19‰ (2.07–2.18 m). Similar to δ18O, δD ratios decreased with depth between ~ 2m and 4.61 m, after which δD ratios became more enriched until the core bottom. D-excess values were positive below 2 m ranging from 6.67‰ (Site 2, 4.89–5.02 m) to 23.46‰ (Site 2, 4.05–4.10 m). At 4.81–4.89 m, D-excess decreased sharply in comparison to adjacent depth intervals (Site 2), corresponding with a 40 mm-thick sediment band (Fig. 3). Average δD and δ18O ratios of the lower ice were within the range of other McMurdo Dry Valleys lakes (Dowling & Lyons Reference Dowling and Lyons2005) and displayed a strong positive linear relationship with one another (y = 4.77x - 93.50, r2 = 0.78, P < 0.0001). The slope of this line (4.77) fell below the expected GMWL (8) (Fig. 5).
Between ~2 m to ~3 m NH4+ concentrations remained low (minimum: 2.89 μM, Site 1, 2.07–2.18 m) with no significant trends. At 3 m, concentrations increased sharply in comparison to adjacent depth intervals and continued to increase with depth until the maximum of 243.21 μM (Site 2, 4.89–5.02 m). DIP concentrations followed a similar pattern and ranged from 0 μM to 43.98 μM (Site 2, 5.09–5.17 m). At ~2 m DSi concentrations became detectable and increased with depth until the maximum DSi concentration at 4.49–4.61 m (62.54 μM). Below this interval DSi concentrations dropped with no significant trend (Fig. 3).
The downcore increase in ice-encased particulate matter allowed for more measurements for organic δ13C and δ15N in the lower ice. Two of the four sampled intervals below 2 m at Site 1 and 19 of the twenty-two sampled intervals below 2 m at Site 2 contained enough filtrate to be analysed for δ13C and δ15N. δ13C ratios ranged from -26.84‰ (Site 2, 2.18–2.27 m) to -4.67‰ (Site 2, 5.24–5.29 m) and generally increased with depth. δ15N ratios ranged from -9.11 (Site 2, 5.24–5.29 m) to 3.45‰ (Site 1, 2.07–2.18 m) and displayed no trend with depth (Fig. 3). When plotted together, δ13C and δ15N ratios were spread across a wide range of largely depleted values. Due to the nutrient driven pattern shift in Detrended-PC1 of the EOF analysis and distinct timeline shift determined from the radiocarbon analyses (Fig. 4), δ13C and δ15N ratios were delineated by depth/age. Values from ice-encased organic matter found < 3 m (< 10 ± 15 14C yr bp) and ice-encased organic matter found > 3 m (> 10 ± 15 14C yr bp) formed two distinct clusters separated by δ13C and δ15N variations (Fig. 6).
δ15N vs δ13C in particulate organic matter (POM) from Lake Eggers and regional records including: Ross Sea water column POM (Wada et al. Reference Wada, Shibata and Torii1981), POM in McMurdo Dry Valley (MDV) soils (Burkins et al. Reference Burkins, Virginia, Chamberlain and Wall2000), pelagic POM (PPOM) from the water column base in MDV lakes below perennial ice cover (Lawson et al. Reference Lawson, Doran, Kenig, Des Marais and Priscu2004), and PPOM in moat waters adjacent to MDV lakes (Lawson et al. Reference Lawson, Doran, Kenig, Des Marais and Priscu2004). Comparison displayed by a. site and b. interpreted climate events (black: Little Ice Age, grey: since 1950 C.E.) Error bars represent the range of measured values. Encompassing ovals trace around clustered values.

Discussion
Lake ice source water: local snowpack
Lake ice stable isotope data and low salinity suggest Lake Eggers is exclusively derived from snow melt, not glacial melt, similar to some other ice-sealed lakes in the McMurdo Dry Valleys (Dugan et al. Reference Dugan, Doran, Wagner, Kenig, Fritsen and Arcone2015, Doran et al. Reference Doran, Fritsen, McKay, Prsicu and Adams2003). Lake Eggers ice stable isotope data fall within the same range as local snow samples from Brown Peninsula (δ18O: -27.41‰ to -24.96‰, δD: -222.04‰ to -202.32‰) (Christ & Bierman Reference Christ and Bierman2020) (Fig. 5). δ18O and δD ratios are relatively depleted with a shallower slope (5.58) in comparison to the GMWL (8) which indicates freshwater freezing (Horita Reference Horita2009) (Fig. 5). D-excess values are mostly positive, which suggests that the meltwater is composed primarily of local snowmelt that traveled a relatively short distance that prevented atmospheric mixing and evaporative fractionation (Gooseff et al. Reference Gooseff, Lyons, McKnight, Vaughn, Fountain and Dowling2006) (Fig. 3). The Lake Eggers local meteoric water line (LMWL) slope in shallow lake ice from Sites 1 and 3 (5.86 and 6.23) was more similar to the LMWL of fresh snowpack (6.41) than glacier ice (7.75) or snow pits (7.99) in the McMurdo Dry Valleys (Gooseff et al. Reference Gooseff, Lyons, McKnight, Vaughn, Fountain and Dowling2006) (Fig. 5). More depleted δD of modern snow suggests summer snow deposition derived from a local moisture source (Gooseff et al. Reference Gooseff, Lyons, McKnight, Vaughn, Fountain and Dowling2006). Additionally, low salinity values suggest that lake ice accreted primarily from a freshwater source. If the ice accreted from a basal brine salinity values in the bottom of the core would be higher than the observed values. The low salinity in ice may also be due to removal of salts that accumulated in the closed lake basin during previous dry periods that were blown away by wind.
Lake ice formation: accretion and sublimation
We propose that ice cover at Lake Eggers formed and has been retained through alternating periods of ice accretion from snowmelt runoff and ice sublimation during dry periods. During wet periods, when low-salinity snowmelt runoff was sufficiently high, water flowed out across the pre-existing lake ice surface and froze, forming new ice layers. The chemical variability (pH, salinity, NH4+, DSi, and DIP) between depth intervals in each lake ice core could represent snowpack with slightly different chemical properties, similar to observations at Lake Vida (Dugan et al. Reference Dugan, Doran, Wagner, Kenig, Fritsen and Arcone2015). During dry periods lake ice sublimated, causing the accumulation of sediment, salts, and isotopically heavy ice. The 40 mm thick sediment band between 4.84–4.88 m depth in the Site 2 core yielded δD and δ18O ratios enriched relative to adjacent overlying and underlying ice (Fig. 3). Heavy stable isotopic enrichment indicates evaporative water loss, with a stronger signal in δ18O than δD (Dugan et al. Reference Dugan, Doran, Wagner, Kenig, Fritsen and Arcone2015, Lacelle et al. Reference Lacelle, Davila, Fisher, Pollard, DeWitt, Heldmann, Marinova and McKay2013). Although δD is less affected by evaporative fractionation (Gooseff et al. Reference Gooseff, Lyons, McKnight, Vaughn, Fountain and Dowling2006, Horita Reference Horita2009), D-excess also decreases at this depth interval (Fig. 3). This sediment layer also coincides with the maximum salinity value (3.38 PSU) suggesting that prolonged sublimation increased the concentration of ions in the ice (Fig. 3). Furthermore, this sediment band approximately coincides with the reflector at ~5 m depth observed in GPR survey lines, suggesting that this sediment band potentially spans the entirety of Lake Eggers (Fig. 2).
We interpret that increasing radiocarbon ages of ice-encased algae with lake ice depth reflects ice accretion via surface runoff events. If the ice in Lake Eggers did not accrete via frozen surface runoff, this increasing age-depth relationship would not be observed. For example, radiocarbon ages of bulk acid insoluble organic matter did not increase with depth due to a local reservoir effect from basal adfreezing of brine isolated from atmospheric exchange with modern 14C, which led to only one of 14 samples from the upper 13 m of ice in Lake Vida to yield a modern 14C age (Dugan et al. Reference Dugan, Doran, Wagner, Kenig, Fritsen and Arcone2015). We do not observe strong evidence for a local reservoir effect at Lake Eggers because the 10 ± 15 14C yr radiocarbon age of algae at 3.05–3.15 m depth suggests ice-encased algae did not accrete from a basal water source isolated from modern atmospheric 14C. Additionally, living algae collected from the surfaces of nearby seasonally-frozen thermokarst ponds on Brown Peninsula yielded similar modern radiocarbon ages that indicated a negligible local reservoir effect (Christ & Bierman Reference Christ and Bierman2020). Radiocarbon ages of algae in the basal lake ice continue to increase with depth. If basal ice in Lake Eggers formed via basal adfreezing from an atmospherically-isolated water body with old 14C, the resulting algae radiocarbon ages would be invariant with ice depth.
Late Holocene hydroclimate
The ice covering Lake Eggers preserves changes in hydroclimate over the last ~1000 years. The deepest radiocarbon age from Site 2 at 4.81–4.89 m, constrains a minimum age of Lake Eggers to 735 ± 15 cal. yr bp (1215 ± 15 C.E. - Common Era) (Table II). While it is unknown if Lake Eggers persisted before this time, the deepest prominent reflector in GPR transect is located only ~1 m below this layer at ~6 m. We interpret this reflector as either the transition from ice to brine or the lakebed. It is possible that the Lake Eggers basin fully evaporated during a regional McMurdo Dry Valley desiccation event around 1000–1200 cal. yr bp that reduced most of the Taylor Valley lakes into hypersaline ponds (Lyons et al. Reference Lyons, Tyler, Wharton and McKnight1998, Fountain et al. Reference Fountain, Lyons, Burkins, Dana, Doran and Lewis1999). The present lake ice cover reflects the re-formation of Lake Eggers since this time.
The lower ice in Lake Eggers below the sediment band (4.61–4.89 m depth) in Core 2 and GPR profile may have formed during the Medieval Warm Period when warmer air and sea surface temperatures led to reduced sea ice extent and high snow accumulation rates in the western Ross Sea (Bertler et al. Reference Bertler, Mayewski and Carter2011). The basal radiocarbon age at 4.81–4.89 m of 735 ± 15 cal. yr bp (1215 ± 15 C.E.) is consistent with this period (Table II), and Detrended PC-3 displays a distinct pattern of increased chemical variability starting at ~4.5 m that explains 13% of the variance in lake ice chemical composition. Basal ice is also relatively enriched in δD and δ18O potentially reflecting ice ablation or warmer regional temperatures.
Following the Medieval Warm Period, net ice accumulation decreased at Lake Eggers during the colder, drier regional climate conditions of the Little Ice Age. The 221 cal. yr age difference between ice-encased algae within only 300 mm of lake ice (4.81–4.89 m: 735 ± 15 cal. yr bp; 4.49–4.61 m: 514 ± 15 cal. yr bp) suggests a low net ice accumulation rate that requires either decreased ice accretion, increased ice sublimation, or both (Table II, Fig. 3). In the Mt. Erebus Saddle ice core collected from Ross Island, the Little Ice Age is characterized by depleted δD isotopic composition, high D-excess values, and increased lithophile elements, particularly “complex silicate material” deposition between 1470 and 1850 C.E. (Rhodes et al. Reference Rhodes, Bertler, Baker, Steen-Larsen, Sneed, Morgenstern and Johnsen2012). The ~1437 C.E. horizon in the Lake Eggers Site 2 ice core contains the δD minimum (-252.61‰), highly positive D-excess (19.99‰), and the maximum concentration of dissolved silicate (62.54 uM), supporting a similar Little Ice Age climate signature at Lake Eggers (Fig. 3).
We propose that net ice accumulation decreased at Lake Eggers during the Little Ice Age when the western Ross Sea was more arid, average temperatures were 1.6 ± 1.4°C colder, sea ice extent expanded, and katabatic wind intensity increased (Bertler et al. Reference Bertler, Mayewski and Carter2011, Rhodes et al. Reference Rhodes, Bertler, Baker, Steen-Larsen, Sneed, Morgenstern and Johnsen2012). Katabatic winds only produce 10% of Dry Valley snowfall, while Ross Sea air masses produce 90% of regional precipitation and high wind speeds increase rates of lake ice ablation (Hall et al. Reference Hall, Denton, Fountain, Hendy and Henderson2010, Bertler et al. Reference Bertler, Mayewski and Carter2011). In the older ice below 3 m, δ15N values are depleted and more closely resemble terrestrial endolithic community isotopic values (Fig. 6). δ15N is the best indicator of organic matter source material in McMurdo Dry Valley hydrologic and soil systems (Burkins et al. Reference Burkins, Virginia, Chamberlain and Wall2000). Depleted δ15N values have been linked to high terrestrial input, while enriched δ15N values are linked to marine sources (Wharton et al. Reference Wharton, Lyons and Des Marais1993, Burkins et al. Reference Burkins, Virginia, Chamberlain and Wall2000). The depleted δ15N in ice below 3 m may reflect a greater terrestrial influence due to intensified katabatic winds and increased sea ice coverage during the Little Ice Age (Bertler et al. Reference Bertler, Mayewski and Carter2011, Burkins et al. Reference Burkins, Virginia, Chamberlain and Wall2000).
The upper 3 m of ice cover at Lake Eggers formed recently as the western Ross Sea shifted to warmer, wetter climate conditions following the Little Ice Age. The increase in regional temperatures is reflected by the increasing δD upcore to the maximum observed value within the most recent ice layer (Site 1 0–0.07 m depth: -210.92‰). This enrichment pattern also resembles the background trend explaining 75.03% of the variance in ice chemical composition in Raw-PC1 of our EOF analysis (δD EOF loading = 0.98) suggesting that changes in climate strongly influenced ice chemistry at Lake Eggers. The young radiocarbon age of ice-encased algae at 3 m depth (10 ± 15 14C yr bp) indicates increased ice accumulation within the last 50–60 years (Table II). Increased ice accumulation may reflect warmer temperatures, higher humidity, weaker katabatic winds, and reduced sea ice extent in the western Ross Sea following the Little Ice Age (Bertler et al. Reference Bertler, Mayewski and Carter2011, Reference Bertler, Conway, Dahl-Jensen, Emanuelsson, Winstrup and Vallelonga2018). This, combined with a predominantly positive SAM interacting with the regional Ross Sea Dipole have caused anomalous heat and moisture flux (Abram et al. Reference Abram, Mulvaney, Vimeux, Phipps, Turner and England2014) and increased snowfall rates in the western Ross Sea during the modern era (Bertler et al. Reference Bertler, Mayewski and Carter2011, Reference Bertler, Conway, Dahl-Jensen, Emanuelsson, Winstrup and Vallelonga2018). Additionally, enriched δ15N values in the upper 3 m of lake ice more closely resemble marine particulate organic matter, which may reflect reduced sea ice coverage in the Ross Sea following the Little Ice Age. Reduction in sea ice cover may have permitted a stronger marine influence and wind-driven deposition of marine sourced organic matter in snow within the watershed of Lake Eggers (Bertler et al. Reference Bertler, Mayewski and Carter2011).
Conclusions
Lake Eggers is a small ice-sealed lake that preserves a record of Late Holocene climate variability in McMurdo Sound and the western Ross Sea. Lake Eggers is sourced from fresh local snowmelt, recording hydro-climatic variability that affects ice accretion from seasonal snowmelt and ice sublimation. During the Little Ice Age, cold, dry, and windy conditions, along with increased sea ice coverage in the western Ross Sea, and increased ice sublimation rates lead to the accumulation of concentrated sediment bands in the bottom half of the ice. During the 20th century increased snowfall in the western Ross Sea led to 3 m of ice accumulation at Lake Eggers that records reduced sea ice coverage, weaker katabatic winds, and warmer atmospheric temperatures in the western Ross Sea. Ice-sealed lakes in coastal regions of the western Ross Sea can provide a unique record of the impact of recent climate change on a simplified hydrologic system.
Acknowledgements
We thank: Douglas Kowalewski and Austin Canty for assisting with ice core collection; Sean Mackay for collecting and processing GPR transects, Robert Michener (Boston University Stable Isotope Laboratory) and the National Ocean Sciences Accelerator Mass Spectrometer Facility for sample analyses; Joel Sparks and Alia Al-Haj for laboratory assistance; Diane Thompson for advice on statistical analyses; and the reviewers whose comments greatly strengthened this manuscript. This work was supported by an NSF grant (NSF-OPP 1246316) to David Marchant. E.J. Chamberlain was supported by the Boston University Undergraduate Research Opportunities Program, Department of Earth & Environment at Boston University, and the Boston University Research, Education, and Communication of Science Program funded by the Howard Hughes Medical Institute. A.J. Christ was supported by an NSF Graduate Research Fellowship and the Department of Earth & Environment at Boston University.
Author contributions
E.J. Chamberlain designed the research project, performed laboratory procedures, wrote the manuscript, and designed Figs 2–7. A.J. Christ assisted in manuscript editing, collected the ice cores, and designed Fig. 1. R.W. Fulweiler provided mentorship, oversight of laboratory methods, and edited the manuscript.
Details of data deposit
Ice core geochemical data collected during this project can be accessed at the EarthChem Library data repository. URL: https://doi.org/10.1594/IEDA/111409