Introduction
Social class differences in height, weight and body mass index (BMI) have been widely reported in many countries in both children and adults (Mascie-Taylor, Reference Mascie-Taylor and Boyce1984; Lasker & Mascie-Taylor, Reference Lasker and Mascie-Taylor1996; Komlos & Kriwy, Reference Komlos and Kriwy2003; Heineck, Reference Heineck2006; Batty et al., Reference Batty, Shipley, Gunnell, Huxley, Kivimaki, Woodward, Lee and Smith2009; Cardoso & Caninas, Reference Cardoso and Caninas2010; Kues, Reference Kues2010; Singh-Manoux et al., Reference Singh-Manoux, Gourmelen, Ferrie, Silventoinen, Gueguen, Stringhini, Nabi and Kivimaki2010). There is a general tendency for mean height and weight to decline from higher to lower social classes while BMI shows the opposite trend (Lasker & Mascie-Taylor, Reference Lasker and Mascie-Taylor1989; Li et al., Reference Li, Manor and Power2004). If movement between social classes (social mobility) was at random, then the mean differences between classes would tend to disappear depending on the length of time the mobility is in effect and the number of people moving.
However, if migration is selective, then social class differences would be maintained to a greater or lesser extent. In general social mobility studies show that upwardly socially mobile individuals are, on average, taller and heavier than the non-socially mobile, while the downwardly socially mobile are, on average, shorter (Mascie-Taylor, Reference Mascie-Taylor and Boyce1984; Cernerud, Reference Cernerud1995; Bielicki & Szklarska, Reference Bielicki and Szklarska2000; Hart et al., Reference Hart, McConnachie, Upton and Watt2008). A similar finding has been reported for IQ and educational attainment (Gibson & Mascie-Taylor, Reference Gibson and Mascie-Taylor1973; Mascie-Taylor & Gibson, Reference Mascie-Taylor and Gibson1978; Gibson et al., Reference Gibson, Harrison, Hiorns and Macbeth1983; Deary et al., Reference Deary, Taylor, Hart, Wilson, Davey Smith, Blane and Starr2005; Johnson et al., Reference Johnson, Brett and Deary2010).
This paper examines the association of intra- and inter-generational social mobility with height, weight and BMI using a large British national cohort study.
Methods
The National Cohort Study (NCDS) is a longitudinal study of all children born in England, Wales and Scotland in the week 3–9th March 1958. The children and their families were periodically re-studied in 1965, 1969 and 1974. Thereafter the index child was followed up into adulthood, and there were re-studies when the child was 33 and 40 years of age. This paper focuses on the 2090 father–son pairs for whom there were both height and weight data (anthropometric data when fathers and sons were both 33 years of age were used). Body mass index was also calculated (weight (kg)/height (m)2).
Social class was defined by the Registrar General's 5-point occupational scale, where I refers to professional, II to intermediate (mainly managerial), III skilled worker, IV semi-skilled worker and V unskilled. The extent of social class mobility was determined intra-generationally for the father (between 1958 and 1974) and the son (between 1991 and 2000) as well as inter-generationally between father and son. Social mobility was categorized as none (no change in social class), upwardly mobile (moving up one or more social classes) or downwardly mobile (going down one or more social classes).
Univariate analysis of variance was the main statistical tool used with Hochberg's or Games-Howell's post-hoc tests.
Results
Mean anthropometric measures by social class
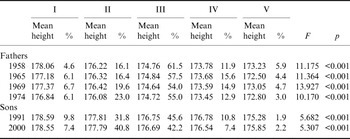
Table 1 presents the mean height of fathers on four occasions and sons on two occasions. Highly significant differences in means were found between social classes over all father and son follow-up dates, and there was a general tendency for mean height to decrease from social class I to V in both fathers and sons. The overall mean height difference between social class I and V ranged from about 4 cm to 4.8 cm in the fathers' generation but declined to between 2.7 cm and 3.3 cm in sons' generation.
Fathers' and sons' mean height (cm) and percentage distribution by social class

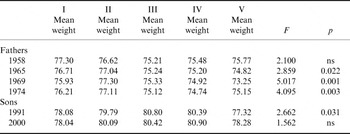
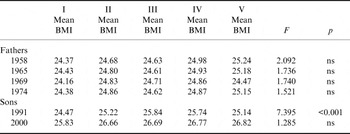
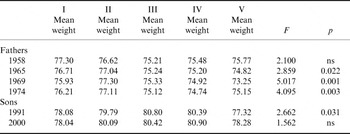
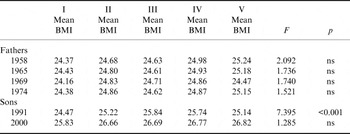
There was much less variation in mean weight between social classes (Table 2), and even less for BMI (Table 3). In fathers the highest mean weight was generally in social class II, while in sons highest means were found in classes III and IV. Body mass index only differed significantly by social class in sons in 1991 and the main cause of this heterogeneity was the lower mean in social class I.
Fathers' and sons' mean weight (kg) by social class
Fathers' and sons' mean BMI (kg/m2) by social class
Intra-generational social mobility
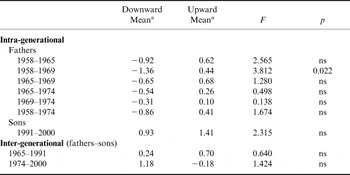
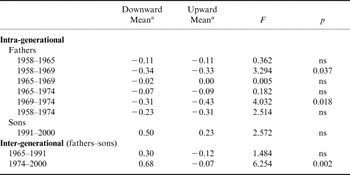
All intra-generational migration matrices were constructed for fathers and sons separately (not shown), and fathers and sons were classified as non-mobile if they remained in the same social class between time periods, downwardly mobile if they moved down one or more classes between time periods, and upwardly mobile if they moved up one or more classes over this time period. The non-mobile group were set as the reference group and assigned a value of zero. The mean height, weight and BMI values presented in Tables 4 to 6 for upward and downward mobile groups are relative to the non-mobile group.
Extent of intra- and inter-generational mobility of fathers and sons in relation to height
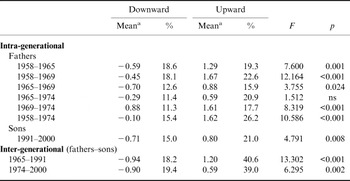
a Mean height difference (cm) from non-mobile reference group (set to zero).
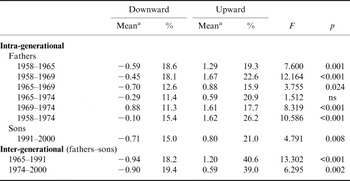
There was a general trend that downwardly mobile fathers were, on average, shorter than the non-mobile group by between 0.1 cm and 0.7 cm, while the upwardly mobile group were taller by between 0.6 cm and 1.7 cm. The only exception was the social mobility between 1969 and 1974, in which both downwardly and upwardly mobile groups were taller than the non-mobile group (respectively by between 0.9 cm and 1.6 cm). Over the whole intra-generational time period from 1958 to 1974, the main finding was of upwardly mobile fathers being taller, on average, than non-mobile fathers, and for downwardly mobile fathers to be slightly shorter. For sons, downwardly mobile sons were significantly shorter, while upwardly mobile were taller than non-mobile sons (Table 4).
There were no significant intra-generational differences in weight between socially mobile groups except the mobility of fathers between 1958 and 1969, where the downwardly mobile were lighter, on average, by 1.4 kg, while the upwardly mobile group were heavier by 0.4 kg. However, there was a tendency for downwardly mobile fathers to be lighter than the non-mobile group, while the upwardly mobile were heavier (Table 5).
Extent of intra- and inter-generational mobility of fathers and sons in relation to weight
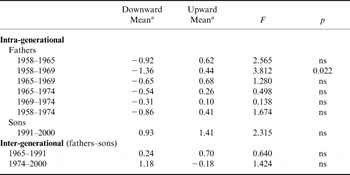
a Mean weight difference (kg) from non-mobile reference group (set to zero).
The results of intra-generational mobility for BMI are shown in Table 6. Most of the analyses (with the exception of the 1958–1965 data) were insignificant and both upward and downward mobile groups had a lower mean BMI than the non-mobile.
Extent of intra- and inter-generational mobility of fathers and sons in relation to BMI
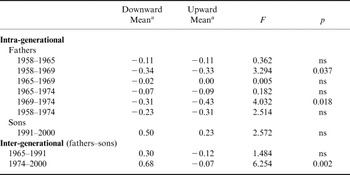
a Mean BMI difference (kg/m2) from non-mobile reference group (set to zero).
Inter-generational social mobility
Inter-generational mobility was highly significant for height with downwardly mobile sons having, on average, a lower mean stature by about 0.9 cm, while upwardly mobile sons were taller, on average, by between 0.6 cm and 1.2 cm. There were no significant inter-generational weight effects, while for BMI downwardly mobile sons had a higher BMI, on average, while upwardly mobile sons had a slightly lower BMI, on average, than non-mobile sons.
Discussion
Strong social inequalities in height in a British generation born in 1958 have been well documented (Lasker & Mascie-Taylor, Reference Lasker and Mascie-Taylor1989; Terrell & Mascie-Taylor, Reference Terrell and Mascie-Taylor1991; Power et al., Reference Power, Manor and Li2002; Li et al., Reference Li, Manor and Power2004; Li & Power, Reference Li and Power2004). This study shows that differences in mean height between the extreme social classes (I and V) were highly significant but greater for fathers than for sons, and that the differences decreased over time within each generation. For example, for fathers the height difference between social classes I and V was 4.8 cm in 1958 and 4.0 cm in 1974; for sons, it was 3.3 cm in 1991 and 2.7 cm in 2000 (Table 1). The reduction in the extent of social class mean differences in height has also been noted by Li et al. (Reference Li, Manor and Power2004) and Li & Power (Reference Li and Power2004).
Studies on the relationship between social mobility and body height are well known in the literature. Many researchers have found that tall people and those with better health are more mobile, more often socially promoted and tend to occupy higher positions that require better qualifications (Mascie-Taylor, Reference Mascie-Taylor and Boyce1984; Lasker & Mascie-Taylor, Reference Lasker and Mascie-Taylor1989; Cernerud, Reference Cernerud1995; Bielicki & Szklarska, Reference Bielicki and Szklarska2000; Power et al., Reference Power, Manor and Li2002).
These results on father–son pairs suggest that there is some selective social mobility in relation to height. It appears that people who are upwardly mobile (who have moved up the social scale) tend to be taller than non-mobile ones, while downwardly mobile tend to be shorter (Table 4).
The inter-generational mobility for BMI suggests a different scenario with the downwardly mobile having a higher BMI, and a risk of obesity in the lower social classes. These findings are in agreement with Swedish data, which also show that obese men are often downwardly mobile (Karnehed et al., Reference Karnehed, Rasmussen, Hemmingsson and Tynelius2008).
The general conclusion from this study is that there is a trend of diminishing inequalities in height between social classes, but that BMI differences between social classes may be increasing.