


Introduction
Attention-deficit/hyperactivity disorder (ADHD) is a common neurodevelopmental disorder, affecting ~5% of children and adolescents worldwide [Reference Cortese, Song, Farhat, Yon, Lee and Kim1]. Symptoms of inattentiveness and/or hyperactivity and impulsivity vary within and between individuals [Reference Sibley, Arnold, Swanson, Hechtman, Kennedy and Owens2], and can persist into adulthood [Reference Fayyad, Sampson, Hwang, Adamowski, Aguilar-Gaxiola and Al-Hamzawi3]. The factors underlying variation in symptom outcomes remain incompletely understood, though both genetic and environmental contributors have been reported [Reference Kuntsi, Rijsdijk, Ronald, Asherson and Plomin4–Reference Roy, Hechtman, Arnold, Sibley, Molina and Swanson6].
Epigenetic processes can regulate gene expression in response to genetic and environmental influences, and have therefore gained attention in ADHD research [Reference Cecil and Nigg7]. The most studied epigenetic mechanism is DNA methylation (DNAm; the addition of a methyl molecule to a cytosine of a cytosine-phosphate-guanine “CpG” dinucleotide), which has been linked to brain development and neurodevelopmental disorders [Reference Walton, Baltramonaityte, Calhoun, Heijmans, Thompson and Cecil8, Reference ENW, Stoye, Cox, Wardlaw, Drake and Bastin9]. Given the challenges in sampling brain tissue from living humans, most epigenetic research on psychiatric disorders rely on peripherally sourced tissues, like blood and saliva [Reference Smith, Kilaru, Klengel, Mercer, Bradley and Conneely10, Reference Nishitani, Isozaki, Yao, Higashino, Yamauchi and Kidoguchi11].
To determine the molecular underpinnings of ADHD symptoms across the developmental period, a growing number of epigenome wide association studies (EWAS) have investigated DNAm in children and adolescents with ADHD [Reference Camerota, Lester, Castellanos, Carter, Check and Helderman12–Reference Wilmot, Fry, Smeester, Musser, Mill and Nigg22]. Most are cross-sectional studies investigating methylation differences between ADHD and controls. Moreover, findings are inconsistent across probes, and are not always corrected for multiple comparisons. The evidence is predominantly based on DNAm measured from blood rather than alternative tissues such as saliva, which would allow for less invasive sample collection in children and adolescents with and without ADHD.
Patterns of age-related change in DNAm have been shown to vary across development [Reference Levesque, Casey, Szyf, Ismaylova, Ly and Verner23–Reference Mulder, Neumann, Cecil, Walton, Houtepen and Simpkin25], and therefore, hold considerable promise for understanding heterogeneity in clinical outcomes, but remains understudied in children and adolescents with and without ADHD. Of the few longitudinal studies on ADHD to date, most relate early life DNAm to later-childhood or adolescent ADHD symptoms [Reference Camerota, Lester, Castellanos, Carter, Check and Helderman12, Reference Gervin, Nordeng, Ystrom, Reichborn-Kjennerud and Lyle16, Reference Neumann, Walton, Alemany, Cecil, Gonzalez and Jima20], and therefore do not directly inform on patterns of epigenetic change. Methylated differences underlying variation in ADHD outcomes have also remain understudied with only one case-control study comparing DNAm between individuals with persistent or remitted ADHD, and this was focused on young adults (mean age of 20.9 years) [Reference Meijer, Klein, Hannon, Van der Meer, Hartman and Oosterlaan26].
Our primary aim provides contextual information about general ADHD-related dynamics in methylation by examining whether longitudinal changes in DNAm differ between children and adolescents with and without ADHD.
Our secondary and clinically relevant aim determines whether DNAm change distinguishes remitted from persistent ADHD. This work provides critical evidence toward the development of future prognostic tests that can operate within the ADHD population, rather than through case-control contrasts. Because epigenetic mechanisms are dynamic and potentially modifiable, identifying such signatures may improve prediction of clinical outcomes, provide tools for monitoring and guiding treatment, and biological pathways underlying ADHD symptom change.
Methods
Study participants
Data for this study comes from the Neuroimaging of the Children’s Attention Project (NICAP) [Reference Silk, Genc, Anderson, Efron, Hazell and Nicholson27], a sub-study of the Children’s Attention Project (CAP) [Reference Sciberras, Efron, Schilpzand, Anderson, Jongeling and Hazell28]. Recruitment into CAP has been described in detail elsewhere [Reference Sciberras, Efron, Schilpzand, Anderson, Jongeling and Hazell28]. Briefly, typically developing children (aged 6–8 years) were recruited from 43 socio-economically diverse primary schools across the Eastern and Western Melbourne metropolitan regions, Australia. CAP initially screened for ADHD symptoms using independent parent and teacher reports on the Conners 3 ADHD index [Reference Conners29] and confirmed ADHD diagnoses using the NIMH Diagnostic Interview Schedule for Children-IV (DISC-IV) [Reference Shaffer, Fisher, Lucas, Dulcan and Schwab-Stone30].
NICAP recruited CAP participants at the 36-month follow-up assessment of the study, when children were 10 years of age [Reference Silk, Genc, Anderson, Efron, Hazell and Nicholson27]. Two additional visits were conducted at 18-month intervals, when participants were aged 11.5 and 13 years [Reference Silk, Genc, Anderson, Efron, Hazell and Nicholson27]. Each visit was performed at The Royal Children’s Hospital, Melbourne, Australia [Reference Silk, Genc, Anderson, Efron, Hazell and Nicholson27]. This repeated-measures design provided DNAm data at multiple time points for each participant, therefore enabling longitudinal analysis of epigenetic change within individuals. Diagnostic assessment for ADHD was repeated at the first and last NICAP waves.
Children were classified as the ADHD group if they had a history of childhood ADHD, defined as meeting current diagnostic criteria at the first NICAP wave of epigenetic sampling or 3 years earlier at the initial CAP recruitment. To reflect the changing nature of ADHD symptoms, cases were further categorized by diagnostic outcome at the final NICAP wave: participants meeting criteria were defined as persistent ADHD and those no longer meeting the criteria were defined as remitted ADHD. Participants without ADHD did not meet the criteria at any wave. Comparisons to participants not meeting criteria for ADHD were included to provide context on general ADHD-related methylation dynamics, while clinically relevant contrasts were within ADHD groups (persistent versus remitted) for potential prognostic insight.
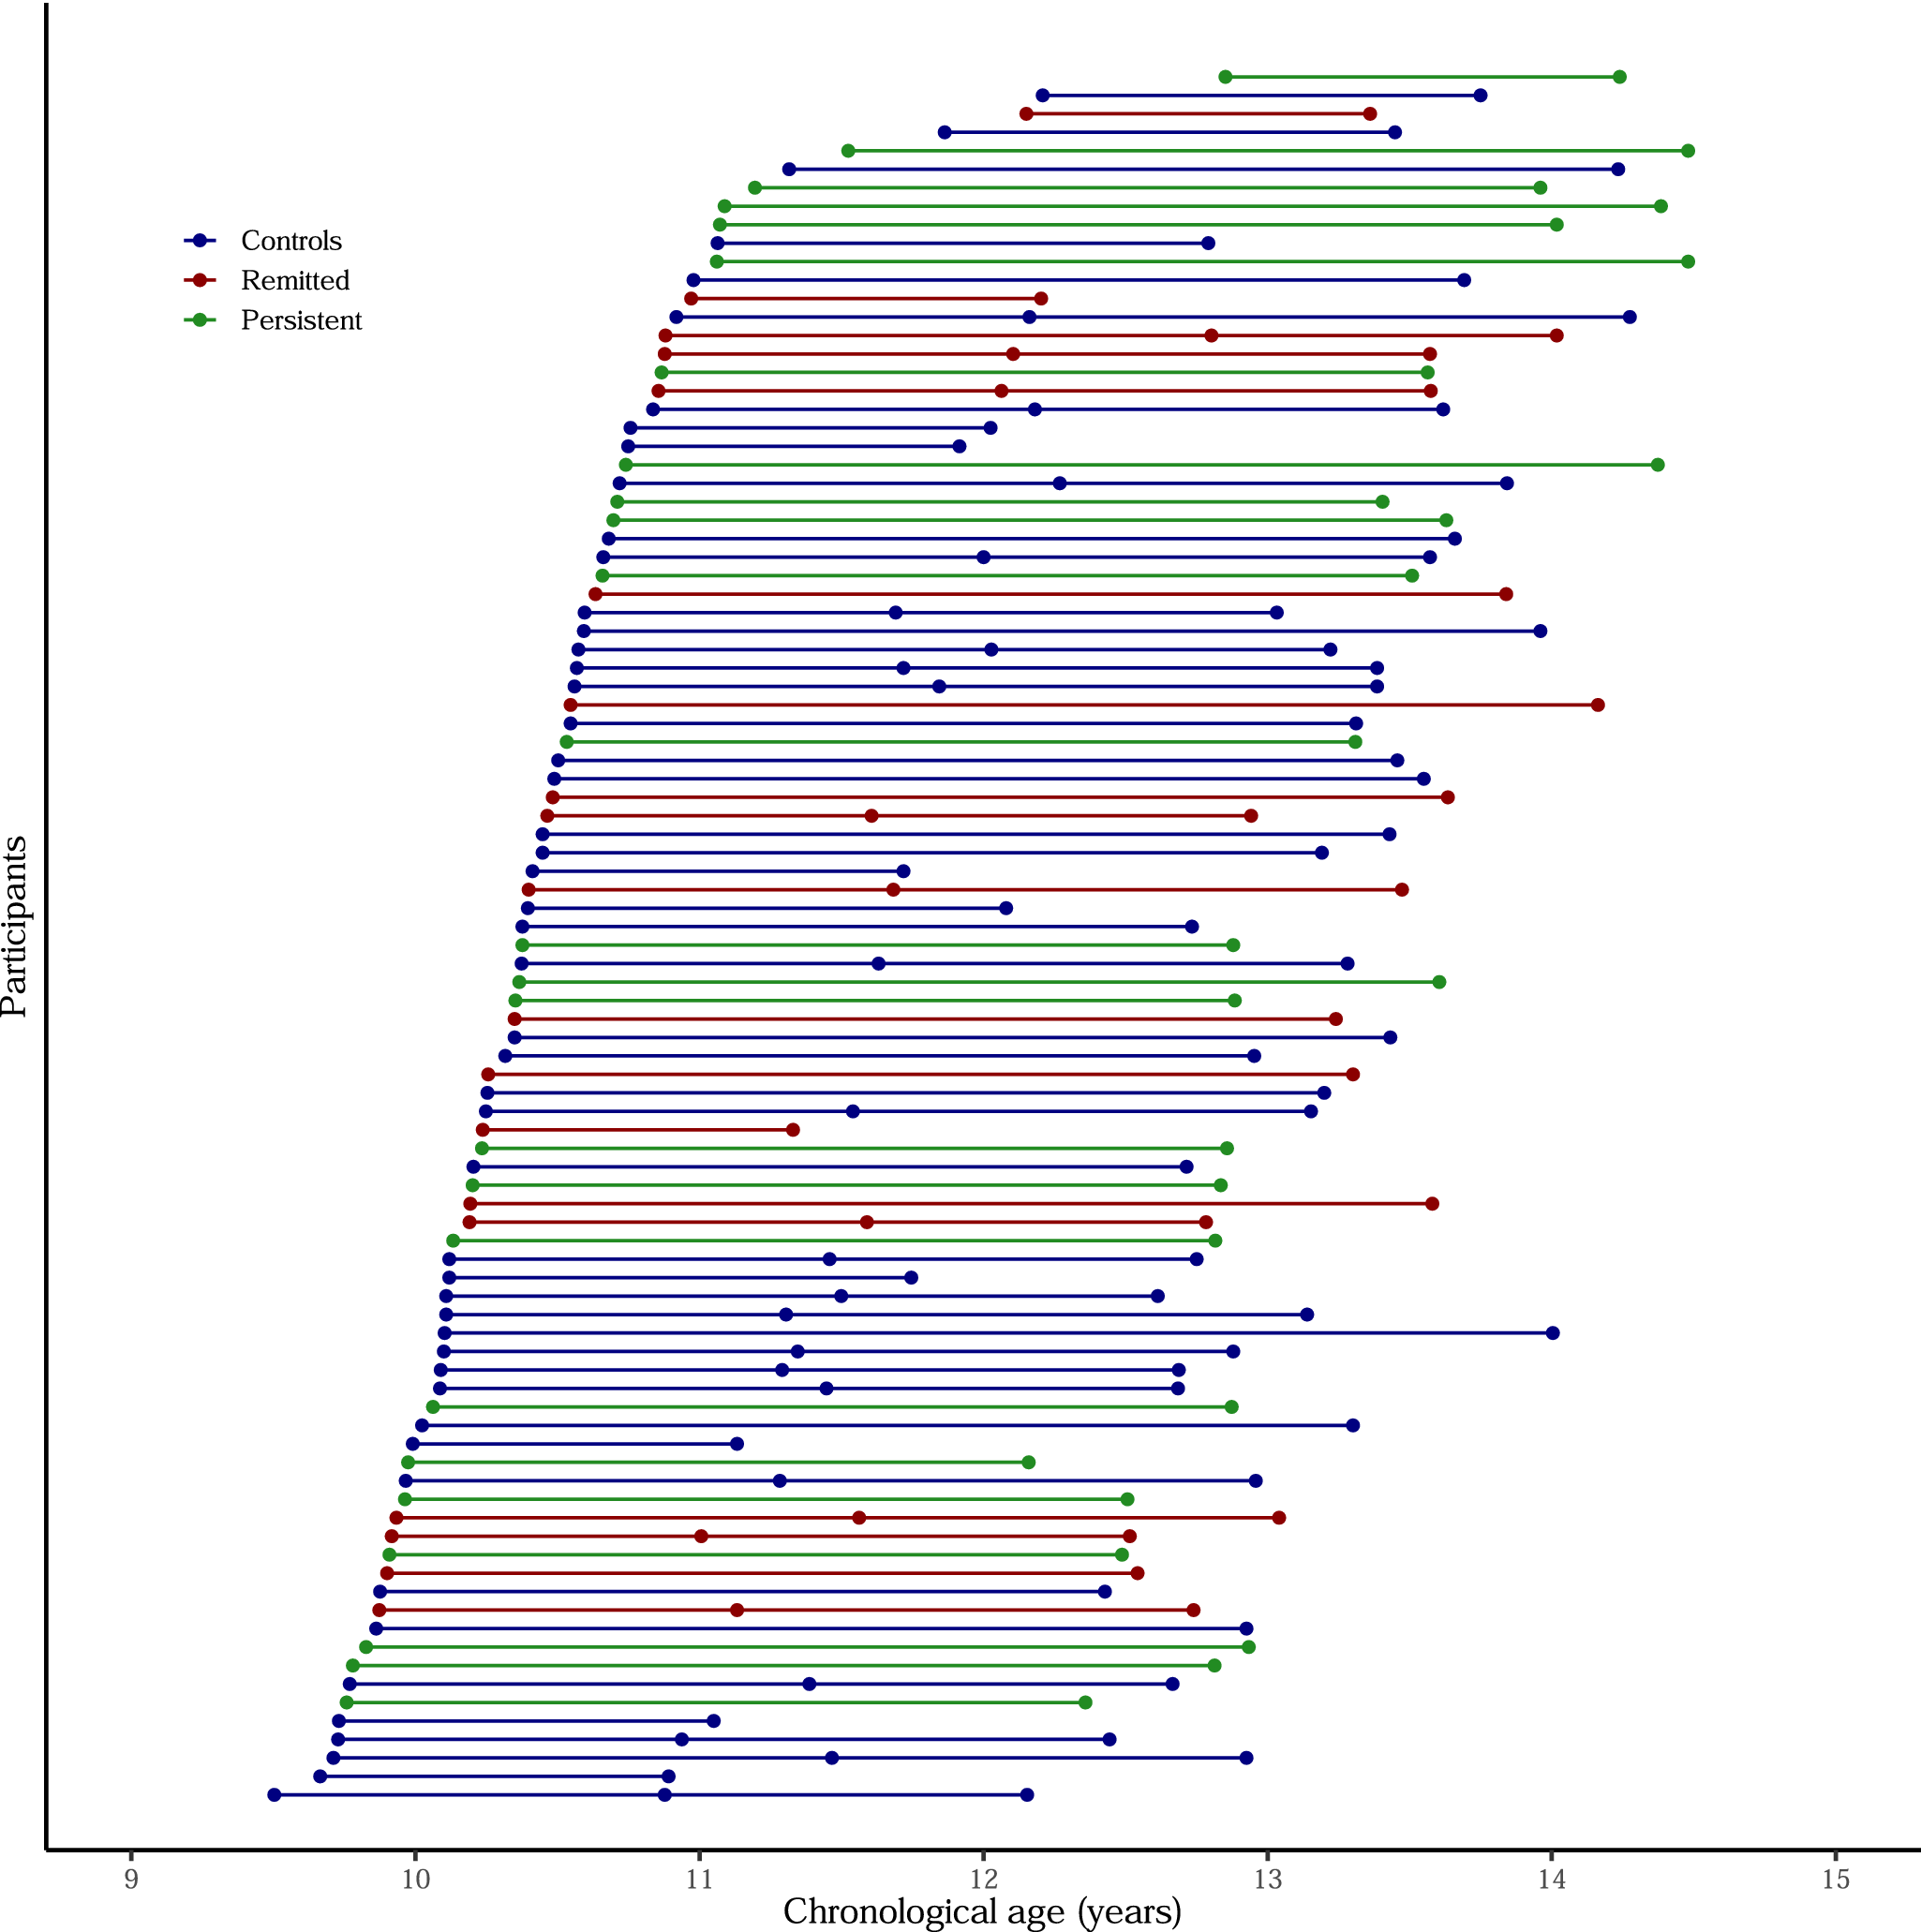
Children were eligible for this study if they had both a saliva sample and diagnostic assessment from at least two waves. In total, 219 saliva samples were collected from 94 participants: 63 attended two waves and 31 attended three waves of assessment. The distribution of chronological age at each wave of assessment is presented in Figure 1.
Distribution of participant ages at each NICAP wave, where saliva samples were collected for DNA methylation analysis. Points are colored by follow-up diagnostic status: blue = controls, red = remitted ADHD, and green = persistent ADHD. Horizontal spread is jittered for visibility.

Figure 1. Long description
A graph with Chronological age in years on the X-axis ranging from 9 to 15, and Participants on the Y-axis. A legend at the top left identifies three groups: blue dots for Controls, red dots for Remitted, and green dots for Persistent.
* The data consists of approximately 100 horizontal lines, each representing an individual participant.
* Each line connects two or three dots, indicating the age at which saliva samples were collected for D N A methylation analysis at different study waves.
* The lines are stacked vertically. At the bottom of the Y-axis, participants start their first wave around age 9.5 to 10.
* As one moves up the Y-axis, the starting age for the first wave gradually shifts rightward, with the top-most participants starting their first wave around age 12.
* Most horizontal lines span a duration of approximately 2 to 3 years between the first and last data point.
* The distribution of colors (blue, red, and green) is interspersed throughout the vertical stack, showing no immediate visual clustering of A D H D status by age group.
This study was approved by the Royal Children’s Hospital Human Research Ethics Committee, Melbourne, Australia (#34071). Written informed consent was obtained from the parents.
DNA methylation preprocessing and quality control
Genomic DNA was isolated from ~3 mL of saliva samples that were collected at each assessment via passive drool into a 50 mL centrifuge tube (Eppendorf South Pacific, NSW, Australia) and stored at −80°C until analysis. DNA samples were bisulfite-converted and hybridized to Infinium MethylationEPIC BeadChip arrays, version 1.0 (Illumina, San Diego, CA, USA), at NTX-Dx (Diagenode, Ghent, Belgium). These arrays generate data from over 850,000 CpGs across the human genome and are enriched for probes in regulatory regions.
Quality control procedures follow Maksimovic and colleagues’ (2016) Bioconductor workflow [Reference Maksimovic, Phipson and Oshlack31] in R using the R minfi package [Reference Aryee, Jaffe, Corrada-Bravo, Ladd-Acosta, Feinberg and Hansen32]. Probes were mapped to genomic features of the human genome assembly GRCh37 (hg19) using IlluminaHumanMethylationEPICanno.ilm10b4.hg19. Poor-quality samples were first removed (detection p > 0.01) before collectively normalizing data across all visits using subset quantile normalization [Reference Touleimat and Tost33, Reference Wu and Aryee34]. Normalization performance was visually checked using comparison plots between raw and normalized data. Probes were removed if they had a poor-quality signal (113,011 with detection p > 0.01); were on a sex chromosome (n = 16,376); overlapped single nucleotide polymorphisms (SNP) at the CpG or extension site (n = 26,455), or were cross-hybridizing (n = 34,471 mapped to multiple locations) [Reference Pidsley, Zotenko, Peters, Lawrence, Risbridger and Molloy35]. Sex checks were performed using the “getSex” function, which derives estimates from the difference between the median methylation of the X and Y chromosomes, and a default cutoff of −2. Beta-values represent the proportion of methylation at a CpG site (methylated signal intensity divided by the total intensity) and M-values represent the log2 ratio of methylated to unmethylated signal intensities. Both measures were calculated for the 675,546 remaining probes but M-values were used for statistical analysis [Reference Du, Zhang, Huang, Jafari, Kibbe and Hou36].
Cell-type heterogeneity was addressed using the EpiDISH “centEpiFibIC.m” reference panel [Reference Teschendorff and Zheng37], which has been shown to be appropriate when estimating epithelial and immune cells from pediatric saliva samples [Reference Chan, Meijer, Merrill, Fu, Lin and MacIsaac38]. Given these cell types are inversely proportional, we included epithelial proportion as a covariate, which is mathematically equivalent to adjusting for leucocyte proportion. Models also adjust for batch to remove potential confounding through samples being sent to the laboratory on two separate occasions, which is visually supported by delineated variation of DNAm (shown in Supplementary Figure S1B), compared to other technical covariates (i.e., wave, slide, and array) (Supplementary Figure S1A, C–D).
CpG selection
Given the longitudinal nature of the data, we focused on probes showing DNAm change within individuals over time, rather than static cross-sectional differences. We address the study aims of determining epigenetic differences between ADHD and controls (Aim 1) and whether change in DNAm was specific to change in diagnostic outcomes (remitted versus persistent ADHD) (Aim 2) by reducing our full set of quality-controlled sites (n = 675,546) into two independent and non-overlapping probe sets. Selection methods for each probe set are summarized in Figure 2, and described in detail below:
Flow diagram showing the selection of CpG sites exhibiting longitudinal DNA methylation change. Probes passing quality control were filtered for longitudinal change criteria (p < 0.05 and > 5% change) in the full sample or in the remitted ADHD group only. Probes selected from the full sample address the aim of longitudinal differences between ADHD and controls (Aim 1), while non-overlapping probes meeting the criteria for change in the remitted ADHD group determine differences by diagnostic outcome (Aim 2). The diagram summarizes filtered steps, participant numbers (94 total, 63 with 2 waves, 31 with three).

Figure 2. Long description
A flowchart organized into a top header and two main vertical columns.
* Top Header: Quality-controlled probes (n = 675,546) serves as the starting point, branching into two panels.
* Left Panel (Aim 1: A D H D compared to controls):
- C p G selection: A mixed group of green, red, and blue human icons representing the full study sample. An arrow labeled Linear mixed model points down to a D N A helix icon.
- Result: 284,665 probes met criteria (nominal p < 0.05 and > 5% change in methylation).
- Statistical analysis: Shows comparisons between A D H D (mixed red/green icons) versus Controls (blue icons), and Remitted (red) or Persistent (green) versus Controls.
* Right Panel (Aim 2: Diagnostic outcomes):
- C p G selection: Three separate groups of icons: Remitted A D H D (red), Persistent A D H D (green), and Controls (blue). Each group points through a Linear mixed model to a D N A helix with probe counts: 259,485 for Remitted, 293,846 for Persistent, and 207,128 for Controls.
- Filtering: An arrow from the Remitted group points to a final D N A icon representing 31,770 probes unique to remitted A D H D and non-overlapping with other groups.
- Statistical analysis: Shows a comparison between the Remitted group (red) and the Persistent group (green) as the reference.
Aim 1. Longitudinal differences between ADHD and controls
Quality-controlled probes were filtered for statistically significant change over time (nominal p < 0.05) and change of more than 5% (equal to a log2FC of 0.07, and calculated by subtracting 1 from the linear fold change of 1.049, and multiplying the result by 100) in the full sample. Change at each probe was modeled using unadjusted linear mixed models (LMMs) with time (difference between the grand mean centered age at first sample collection and the participants age at each wave) as the fixed effect and participant as a random intercept.
Aim 2. Longitudinal differences by diagnostic outcomes (remitted vs. persistent ADHD)
To determine whether longitudinal change in DNAm was associated with change in ADHD outcomes, the same selection criteria (p < 0.05 and >5% change) were applied to group-specific LMMs. Here, the same unadjusted LMMs were independently applied to participants without ADHD, remitted ADHD, and to persistent ADHD groups. Considering diagnostic outcome does not change for those without ADHD or with persistent ADHD, it was the epigenetic change in the remitted group that was of primary interest. Therefore, probes meeting the criteria of the remitted ADHD group, and not overlapping with groups without ADHD or with persistent ADHD, were selected for further analysis.
When individual probes are cited in the Results, both the probe name and the relevant annotated gene(s), if present, are provided (e.g., cg12881363 – MOV10L1, cg02208776 – HSPE1; HSPD1, and cg11124426).
Gene enrichment analysis
The functional relevance of peripherally sourced DNAm in brain-based disorders was first examined using tissue enrichment analyses, focusing on gene expression in the brain relative to other body tissues and across specific brain regions. Regional brain expression of genes further informs on DNAm in relation to neurodevelopmental patterns in ADHD. Analyses were performed on the larger sets of probes meeting our criteria for longitudinal change, in addition to the final diagnostic-group-significant CpGs.
Genes annotating to selected probes were tested for whole body tissue enrichment using RNA-seq data from the Human Protein Atlas (HPA) [Reference Uhlen, Fagerberg, Hallstrom, Lindskog, Oksvold and Mardinoglu39] via the TissueEnrich package [Reference Jain and Tuteja40] and then in 47 brain tissue regions (16 brain regions, plus their super-structures, which are structures inherited through a hierarchical brain organization [e.g., M1 primary motor cortex inherits super-structures like the cerebral cortex and frontal neocortex]) across the developmental stages (prenatal; 0–2 years; 3–11 years; 12–19 years, and >19 years) by the Allan Brain Atlas (ABA), using the ABAenrichment package [Reference Grote, Prufer, Kelso and Dannemann41]. Significant CpGs from diagnostic-group comparisons were also checked for cross-tissue correlations between saliva and brain tissue – collected from 27 patients with epilepsy (aged 5–61 years) – using the Iowa Methylation Array Graphing Experimental for Comparison of Peripheral Tissue & Gray matter (IMAGE-CpG) website [Reference Braun, Han, Hing, Nagahama, Gaul and Heinzman42].
The functional enrichment of differentially methylated probes in molecular, cellular, and biological processes and pathways was tested using the Gene Ontology (GO) [Reference Ashburner, Ball, Blake, Botstein, Butler and Cherry43, Reference Aleksander, Balhoff, Carbon, Cherry and Drabkin44] and the Kyoto Encyclopedia of Genes and Genomes (KEGG) databases, respectively [Reference Kanehisa and Goto45]. Here we used the gometh function from the missMethyl package [Reference Phipson, Maksimovic and Oshlack46] as this adjusts for probe number and multiple annotations.
All enrichment analyses were controlled for multiple comparisons using a false discovery rate (FDR) adjusted-p-value less than 0.05 [Reference Benjamini and Hochberg47], except for ABA enrichment, which used the package’s default minimum family-wise-error rate (FWER).
The clinical relevance of differentially methylated probes was also explored through gene–disease associations recorded by ClinVar [Reference Landrum, Lee, Benson, Brown, Chao and Chitipiralla48], ClinGen [Reference Rehm, Berg, Brooks, Bustamante, Evans and Landrum49], and PsyGeNET [Reference Gutierrez-Sacristan, Bravo, Portero-Tresserra, Valverde, Armario and Blanco-Gandia50] databases, using the gene2disease function from the disgenet2r R package [Reference Pinero, Ramirez-Anguita, Sauch-Pitarch, Ronzano, Centeno and Sanz51].
Statistical analysis
Differential DNAm was analyzed using R v4.4 [52] limma package. Longitudinal differences in DNAm were first assessed between children and adolescents with and without ADHD using adjusted LMM. These models regress the main effect of diagnosis and its interaction with time on selected probes meeting longitudinal change criteria in the full sample (refer “Aim 1. Longitudinal differences between ADHD and controls” in section “CpG Selection”). Comparisons included: (1) individuals with versus without ADHD and (2) persistent or remitted ADHD versus without ADHD. Models were adjusted for sex, medication use, batch, and epithelial cell proportion, with participant as a random intercept.
To determine whether change is associated with diagnostic outcomes, a third comparison examined DNAm differences between remitted and persistent ADHD groups. Here, the same adjusted-LMM regress the main effect of diagnosis and its interaction with time on selected probes meeting criteria in remitted ADHD (refer “Aim 2. Longitudinal differences by diagnostic outcomes” in the section “CpG Selection”). Because the clinical application of this study is prognostic rather than diagnostic, we prioritized these persistent versus remitted ADHD comparisons, with ADHD versus without comparisons included for context.
Each of the three group comparisons are corrected for multiple testing using a Benjamini-Hochberg FDR-adjusted-p-value less than 0.05 [Reference Benjamini and Hochberg47].
For probes significantly differing between persistent and remitted ADHD, residual change scores were used to further examine associations between DNAm change and ADHD symptom change. Residual change in methylation was defined by regressing M-values at last follow-up on baseline values, adjusted for baseline age, batch, epithelial cell proportion, and time interval. Residual change in symptoms was similarly defined using parent-reported Conners 3 ADHD Index [Reference Conners29], adjusted for baseline age and time interval. For both measures, a positive residual change score represents a higher level of methylation or symptom severity at follow-up, after considering data collected at baseline. Associations between methylation change and symptom change were tested with linear regression models adjusted for sex and medication use.
Results
Study participants
We analyzed 219 saliva samples from 94 participants, 47% of whom had a childhood history of ADHD (Table 1). Among the 44 ADHD cases, 57% retained a diagnosis at their final wave (persistent ADHD), while 43% no longer met criteria (remitted ADHD). Across waves and ADHD groups, males represented more than half of the eligible participants.
Characteristics of study cohort

Table 1. Long description
The table is organized into four main sections across five columns. The columns are Characteristic, Controls, Remitted A D H D, Persistent A D H D, and Total.
1. Participant count and percentage male:
* Wave 1: Controls 50 (70 percent), Remitted 18 (72 percent), Persistent 24 (71 percent), Total 92 (71 percent).
* Wave 2: Controls 32 (100 percent), Remitted 12 (83 percent), Persistent 1 (100 percent), Total 45 (96 percent).
* Wave 3: Controls 40 (63 percent), Remitted 17 (71 percent), Persistent 25 (72 percent), Total 82 (67 percent).
2. Chronological age mean and range:
* Wave 1: Mean age is approximately 10.4 across all groups, with a total range of 9.5 to 11.9.
* Wave 2: Mean age ranges from 11.7 in Controls to 12.9 in the single Persistent case.
* Wave 3: Mean age is approximately 13.3 across all groups, with a total range of 12.2 to 14.5.
3. A D H D symptoms mean and range:
* Wave 1: Controls 1.0, Remitted 7.8, Persistent 11.0.
* Wave 2: Controls 1.2, Remitted 6.8, Persistent 13.0.
* Wave 3: Controls 0.4, Remitted 5.1, Persistent 10.5.
4. Medication use count and percentage:
* Wave 1: Controls 0, Remitted 4 (22 percent), Persistent 8 (36 percent).
* Wave 2: Controls 0, Remitted 4 (33 percent), Persistent 1 (100 percent).
* Wave 3: Controls 0, Remitted 2 (13 percent), Persistent 7 (32 percent).
Note: Demographic and clinical characteristics of participants at each wave of the NICAP study. Values show numbers of participants (n) and percentages (%) or mean values with ranges, stratified by diagnostic status: controls, remitted ADHD, and persistent ADHD. ADHD symptom severity was measured using parent-reported Conners 3 ADHD Index scores. Medication use reflects any prescribed behavioral medication at each wave.
Within the ADHD group, 15 participants reported prescribed medication use for behavior at one or more visits. These included methylphenidate (n = 8), atomoxetine (n = 2), lisdexamfetamine (n = 3), fluoxetine (n = 2), risperidone (n = 1), or combinations (i.e., risperidone + atomoxetine [n = 1], clonidine + methylphenidate [n = 1], clonidine + fluoxetine + lisdexamfetamine [n = 1], or dexamphetamine + lisdexamfetamine [n = 1]). Nine participants reported medication at each wave of sample collection; four continually used methylphenidate (remitted = 1; persistent = 2) or fluoxetine (persistent = 1) across all visits; the others used medication intermittently.
Longitudinal change in DNA methylation between ADHD and controls
Of the 675,546 probes surviving quality control, 284,665 (42%) showed significant change in methylation in the full sample, comprising 145,493 hypomethylated and 139,172 hypermethylated sites (Supplementary Figure S2A). Among these, 188,942 probes mapped to a single gene (20,116 covering one or more probes), and these genes were found to be expressed throughout the body, though predominantly in brain tissue (Supplementary Figure S2B). In a separate analysis of gene expression in the Allan Brain Atlas, where our genes were compared to a set of background genes for each brain region, these candidate genes were enriched in seven brain regions in childhood (0–2 years and 3–11 years of the ABA data, all FWER-adjusted-p < 0.05; Supplementary Table S1). Enrichment spans regions with established functional roles that are often impaired in ADHD, including emotional regulation, and the processing of motor and somatosensory information [Reference Christiansen, Hirsch, Albrecht and Chavanon53–Reference Parush, Sohmer, Steinberg and Kaitz55]. The top 200 ranked probes (with a nominal p < 0.05 and the largest effect size) are listed in Supplementary Table S2.
Using probes meeting criteria in the total cohort, uncorrected tests identified 14,469 probes with a main diagnostic effect and 20,522 with a diagnosis interaction with time. However, these findings did not survive correction for multiple comparisons (Supplementary Table S4).
When stratifying by diagnostic outcome, persistent ADHD showed significant hypomethylation relative to participants without ADHD at two probes (cg15550572 – PRKCZ, cg12577151 – ACAD9) and time-dependent differences at three probes (cg26901352 – CCL17, cg17657037 – ITGB1BP3, and cg19892195 – AGAP1; Figure 3). Remitted ADHD differed significantly from participants without ADHD in the average DNAm of three probes (cg11124426, cg02208776 – HSPE1:HSPD1, and cg12881363 – MOV10L1; Table 2). For these CpGs surviving multiple correction, cross-tissue correlations between saliva and brain tissue were weak to moderately weak (negative and positive correlation coefficients less than 0.39) and did not reach statistical significance (all nominal p < 0.05).
Longitudinal DNA methylation trajectories at CpG sites surviving FDR correction. Plots show methylation change over time for controls (blue), remitted ADHD (red), and persistent ADHD (green). Sites include cg26901352 – CCL17, cg17657037 – ITGB1BP3, and cg19892195 – AGAP1, with significant diagnosis x time interactions, and cg21443143 – ZFAT, which showed greater decline in remitted ADHD than in persistent ADHD.

Figure 3. Long description
A four-panel multiplot. Each graph plots Chronological age in years on the x-axis from 10 to 14 and D N A methylation m-values on the y-axis.
* Top-left panel (c g 2 6 9 0 1 3 5 2): Shows a flat trend for the Control group (dark blue) and a slight downward trend for the Persistent group (green).
* Top-right panel (c g 1 7 6 5 7 0 3 7): Shows a downward trend for the Control group (dark blue) and an upward trend for the Persistent group (green).
* Bottom-left panel (c g 1 9 8 9 2 1 9 5): Shows a slight upward trend for the Control group (dark blue) and a slight downward trend for the Persistent group (green).
* Bottom-right panel (c g 2 1 4 4 3 1 4 3): Shows a downward trend for the Persistent group (green) and an upward trend for the Remitted group (dark red).
In all panels, thin background lines represent individual trajectories, while bold lines represent the group mean with shaded areas indicating confidence intervals. The y-axis scales vary between panels, ranging from negative 4.0 to positive 4.5.
Differentially methylated probes between diagnostic groups

Table 2. Long description
The table contains seven columns: Comparisons, Probe I D, Chr, Position, Gene, Main log F C p-value, and Interaction log F C p-value.
Under Remitted versus controls:
- Probe cg 1 1 1 2 4 4 2 6 on Chr 2 at position 1 3 1 1 4 9 1 0 8 has a Main log F C of minus 0.67 with p-value 0.02.
- Probe cg 0 2 2 0 8 7 7 6 on Chr 2 at position 1 9 8 3 6 5 1 1 9 associated with genes H S P E 1 and H S P D 1 has a Main log F C of 0.83 with p-value 0.03.
- Probe cg 1 2 8 8 1 3 6 3 on Chr 22 at position 5 0 5 2 8 2 9 8 associated with gene M O V 1 0 L 1 has a Main log F C of 1.17 with p-value 0.03.
Under Persistent versus controls:
- Probe cg 1 5 5 5 0 5 7 2 on Chr 1 at position 2 0 6 4 4 4 1 associated with gene P R K C Z has a Main log F C of minus 0.75 with p-value 0.05.
- Probe cg 1 2 5 7 7 1 5 1 on Chr 3 at position 1 2 8 6 1 5 0 9 7 associated with gene A C A D 9 has a Main log F C of minus 0.42 with p-value 0.05.
- Probe cg 2 6 9 0 1 3 5 2 on Chr 16 at position 5 7 4 4 7 5 0 2 associated with gene C C L 1 7 has an Interaction log F C of minus 0.13 with p-value 0.02.
- Probe cg 1 7 6 5 7 0 3 7 on Chr 19 at position 3 9 3 3 8 5 6 associated with gene I T G B 1 B P 3 has an Interaction log F C of 0.26 with p-value 0.03.
- Probe cg 1 9 8 9 2 1 9 5 on Chr 2 at position 2 3 6 9 6 3 4 6 2 associated with gene A G A P 1 has an Interaction log F C of minus 0.15 with p-value 0.04.
Under Remitted versus persistent:
- Probe cg 1 7 6 0 1 2 1 6 on Chr 8 at position 1 3 3 7 8 7 6 9 0 associated with gene P H F 2 0 L 1 has a Main log F C of minus 0.58 with p-value 0.03.
- Probe cg 0 0 0 6 0 3 2 0 on Chr 3 at position 1 3 4 3 6 9 9 7 4 associated with gene K Y has a Main log F C of minus 0.62 with p-value 0.02.
- Probe cg 0 2 9 6 8 1 1 6 on Chr 2 at position 6 6 6 5 2 8 7 8 has a Main log F C of 0.55 with p-value 0.03.
- Probe cg 2 1 4 4 3 1 4 3 on Chr 8 at position 1 3 5 4 9 1 2 4 0 associated with gene Z F A T has an Interaction log F C of minus 0.24 with p-value 0.02.
Note: CpG probes showing significant main effects or diagnosis × time interactions in comparison between remitted ADHD, persistent ADHD, and control groups. Chromosomal location (Chr), strand orientation, associated gene, and effect sizes (logFC) with FDR-adjusted p-values provided.
Change in DNA methylation by remitted and persistent ADHD outcomes
A total of 31,770 probes met the criteria for longitudinal change in remitted ADHD, of which, 67% (n = 21,213 probes) mapped to a single gene (10,809 annotate to one or more probes) (Supplementary Figure S3A). Again, we found these genes to be enriched throughout the body, though predominantly in brain tissue (Supplementary Figure S3B). Focusing on genes enriched in brain tissue, we found enrichment across 25 brain regions spanning prenatal through to adult life (Supplementary Table S1). The top 200 probes are summarized in Supplementary Table S3.
Among probes meeting the criteria for change in remitted ADHD, three sites (cg17601216 – PHF20L1, cg00060320 – KY, and cg02968116) showed significant main effects between remitted and persistent ADHD (Table 2). A fourth probe, cg21443143 – ZFAT, exhibited greater methylation decrease over time in remitted ADHD than in persistent ADHD (Figure 3). These genes are expressed broadly in cortical and subcortical brain regions, across developmental stages, with PHF20L1 highly represented in the neocortical areas (i.e., dorsolateral temporal neocortex, frontal neocortex, neocortex [isocortex], and temporal neocortex). Conversely, cross-tissue correlations between saliva and brain tissue were weak (negative and positive correlation coefficients less than 0.16) and did not reach statistical significance (all nominal p < 0.05).
Change in DNA methylation and change in ADHD symptom severity
To examine links between epigenetic and clinical changes, we performed residual-change analyses on four significant diagnostic-outcome probes (cg17601216, cg00060320, cg02968116, and cg02968116). As expected, ADHD symptoms decreased more in remitted ADHD (−1.37 ± 4.40) than in persistent ADHD (1.23 ± 2.92, t = −4.25, nominal p < 0.0001). No significant association was observed between residual change in methylation and symptom change (cg17601216: ß = 0.003 [95% CI: −0.03, 0.03]; cg00060320: ß = −0.01 [−0.03, 0.02]; cg02968116: ß = −0.01 [−0.03, 0.01]; and cg21443143: ß = 0.032 [−0.01, 0.07]; all nominal p < 0.05), though among these null-findings was a notable trend for cg21443143 – ZFAT (p = 0.085).
Gene enrichment
Functional understanding of the 12 probes surviving multiple correction (FDR-corrected p < 0.05) were evaluated using the GO and KEGG databases. Collectively, no enrichment results survived correction for multiple comparisons (Supplementary Table S5), but did reveal some interesting findings at a nominal p-value <0.05 (Figure 4A and B), Specifically, one probe annotated to PRKCZ (cg15550572) was linked to long-term memory and was also enriched in the top-ranking chemokine signaling pathway. A second probe annotated to AGAP1 (cg19892195) was enriched in synaptic structure modification. We summarize the top ranking 20 functional processes and their associated gene in Supplementary Table S5.
Functional enrichment analyses of differentially methylated CpGs. (A, B) Gene Ontology (GO) terms and KEGG pathways most enriched (nominal p < 0.05) among FDR-significant probes. (C) Disease-association analysis linking probe-annotated genes (e.g., PRKCZ, AGAP1, HSPD1, ACAD9, ZFAT, and MOV10L1) to nervous system and mental disorders.

Figure 4. Long description
Panel A is a G O term heatmap. The X-axis lists genes: A C A D 9, A G A P 1, H S P D 1, H S P E 1, I T G B 1 B P 3, M O V 10 L 1, and P R K C Z. The Y-axis lists 21 biological terms such as anion binding and ribosylnicotinate kinase activity. Colored rectangles indicate enrichment: A C A D 9 (red), A G A P 1 (teal), H S P D 1 (gold), H S P E 1 (magenta), I T G B 1 B P 3 (green), M O V 10 L 1 (pink), and P R K C Z (blue). P R K C Z shows the most diverse enrichment across terms like myelin sheath abaxonal region and apical cortex.
Panel B is a K E G G pathway heatmap. The X-axis lists genes: A G A P 1, C C L 17, I T G B 1 B P 3, and P R K C Z. The Y-axis lists 21 pathways including Axon guidance and Endocytosis. P R K C Z (blue) is associated with the majority of pathways shown, including Type I I diabetes mellitus and various signaling pathways. C C L 17 (purple) is linked to cytokine and chemokine interactions.
Panel C is a horizontal bar chart titled score on the X-axis (0.0 to 1.0). It ranks disease associations from highest to lowest score:
* Congenital, Hereditary, and Neonatal Diseases and Abnormalities (1.0)
* Nervous System Diseases (1.0)
* Nutritional and Metabolic Diseases (1.0)
* Pathological Conditions, Signs and Symptoms (approximately 0.7)
* Urogenital Diseases (0.65)
* Mental Disorders (0.6)
* Endocrine System Diseases (0.4)
* Eye Diseases (0.4)
* Immune System Diseases (0.4).
The clinical relevance of the 12 identified probes was explored through gene–disease associations reported by three curated databases (ClinVar, ClinGen, and PsyGeNET). Among the annotated genes, PRKCZ, HSPD1, ACAD9, ZFAT, and MOV10L1, were associated with several disease classes, including mental disorders and nervous system diseases (Figure 4C).
Discussion
This study examined whether longitudinal change in DNAm differs between children and adolescents with and without ADHD and is among the first to explore the epigenetic patterns distinguishing persistent from remitted ADHD. By quantifying methylation across three developmental waves, we found no robust differences between individuals with and without ADHD after multiple comparison correction but we did identify 12 CpG sites that distinguished diagnostic subgroups from each other. Many of these probes map to genes expressed in brain tissue, suggesting biologically relevant methylation changes that may help explain variability in ADHD outcomes.
For the first aim of determining longitudinal differences between children and adolescents with and without ADHD, we focused on a subset of CpG sites that met a predefined criteria for epigenetic change across development. Using saliva samples, we found that nearly half (42%) of the quality-controlled probes met these criteria, consistent with patterns observed in whole blood [Reference Mulder, Neumann, Cecil, Walton, Houtepen and Simpkin25]. When exploring whether DNAm varies among ADHD groups prospectively, most earlier studies have focused on whether early-life DNAm predicts late-childhood symptoms [Reference Camerota, Lester, Castellanos, Carter, Check and Helderman12, Reference Neumann, Walton, Alemany, Cecil, Gonzalez and Jima20, Reference Walton, Pingault, Cecil, Gaunt, Relton and Mill21]. From these, two studies found an association with childhood ADHD symptoms when DNAm was measured at birth, but not when samples were collected concurrently during childhood [Reference Neumann, Walton, Alemany, Cecil, Gonzalez and Jima20, Reference Walton, Pingault, Cecil, Gaunt, Relton and Mill21]. This and other prospective evidence in children and adolescents are largely limited to DNAm from cord or whole blood; therefore, our null finding between a pooled ADHD sample (including both remitted and persistent ADHD) and non-ADHD controls, using repeated saliva samples, represents a novel contribution. Our null-finding, however, does align with several saliva-based epigenome wide case-control or cross-sectional studies, which had also adjusted for multiple comparisons [Reference Goodman, Burton, Butcher, Siu, Lemire and Chater-Diehl17, Reference Mooney, Ryabinin, Wilmot, Bhatt, Mill and Nigg19, Reference Fujisawa, Nishitani, Makita, Yao, Takiguchi and Hamamura56]. An exception being one saliva-based cross-sectional study which had discovered and validated a differentially methylated site annotating to the VIPR2 gene (cg13444538), though samples were collected from a cohort of boys [Reference Wilmot, Fry, Smeester, Musser, Mill and Nigg22]. Given the novelty of collecting repeated saliva samples to investigate ADHD differences in children and adolescents, these findings may be furthered through additional investigations.
Symptoms of ADHD in childhood can vary over the course of adolescence, and individuals can remit or persist in their diagnostic status over time. To further understand this diversity at the molecular level, we compared DNAm between children and adolescents with remitted or persistent ADHD and identified four differentially methylated sites. Among these, cg21443143 (annotated to ZFAT) showed a decline in methylation over time among remitted participants. ZFAT encodes a transcriptional regulator involved in immune cell survival and apoptosis [Reference Fujimoto, Doi, Koyanagi, Tsunoda, Takashima and Yoshida57], and autoimmune thyroid disease [Reference Koyanagi, Nakabayashi, Fujimoto, Gu, Baba and Takashima58, Reference Shirasawa, Harada, Furugaki, Akamizu, Ishikawa and Ito59]. This aligns with evidence implicating immune processes and inflammation in ADHD pathophysiology [Reference Han, Patel, Jones, Nielsen, Mohammad and Hofer60–Reference Liu, Wang, Yu, Zhao, Zhu and Wang62]. In relation to the brain, we found this gene to be enriched in several brain regions, most notable in the cingulate cortex and the prefrontal region, which echoes neuroimaging findings [Reference Clerkin, Schulz, Berwid, Fan, Newcorn and Tang63–Reference Wetterling, McCarthy, Tozzi, Skokauskas, O’Doherty and Mulligan67]. This CpG site, however, was not identified by the only other published epigenetic study in remitted and persistent ADHD, though this was a case-control study involving a relatively small sample of young adults [Reference Meijer, Klein, Hannon, Van der Meer, Hartman and Oosterlaan26]. Therefore, to understand the molecular dynamics underpinning varying symptom trajectories across childhood and into adolescence, our finding warrants further investigation using repeated measures in children and adolescents.
In comparison to those without ADHD, a most consistent finding for persistent ADHD was a lower or declining methylation over time. Three of the identified sites map to genes enriched in brain tissue collected during infancy and childhood (PRKCZ, ACAD9 and AGAP1), including the somatosensory cortex, which supports prior NICAP neuroimaging data whereby pathways connecting to and from somatosensory regions are altered in persistent ADHD [Reference Fuelscher, Hyde, Thomson, Vijayakumar, Sciberras and Efron68] and aligns with known processing difficulties of somatosensory stimuli in ADHD [Reference Parush, Sohmer, Steinberg and Kaitz55, Reference Duerden, Tannock and Dockstader69, Reference Frost-Karlsson, Capusan, Olausson and Boehme70]. Functionally, some genes are implicated in synaptic structure modification (AGAP1) and long-term memory (PRKCZ), which are essential for brain development and can be impaired in persons with ADHD [Reference Mohammadkhanloo, Pooyan, Sharini and Yousefpour71, Reference Rhodes, Park, Seth and Coghill72]. Whether the lower DNAm of these genes represents a heightened expression that ultimately maintains symptom severity in ADHD is yet to be seen, though some evidence has shown overexpression of AGAP1 to have a negative impact on dendritic spine density [Reference Arnold, Cross, Singleton, Zlatic, Chapleau and Mullin73].
CpG sites distinguishing remitted ADHD from individuals without ADHD were mostly hypermethylated, though none of these maps to brain-expressed genes. One site near the HSPD1 gene (cg02208776), however, has been previously associated with brain morphology in schizophrenia [Reference van der Meer, Shadrin, O’Connell, Bettella, Djurovic and Wolfers74] and may have neurodevelopmental relevance. The scarcity of research limits our interpretation of this finding, and it should be noted that gene expression was not directly measured in the present study, and therefore, these sites in remitted ADHD could still be linked directly to the brain with further studies. In the previously mentioned study by Meijer et al (2020), which involved small samples of cases and controls, they found no evidence of a difference between individuals with remitted ADHD and controls, though investigations using large cohort studies, and therefore, with greater power would provide further insight.
This study has several strengths. First and foremost, the current study is one of the few to investigate longitudinal change in DNAm across the epigenome and compare these changes between children and adolescents with or without ADHD. It is also the first to explore DNAm across childhood and adolescence in relation to change in adolescent diagnostic outcomes (i.e., persistence and remitted).
Notwithstanding these strengths are several limitations that warrant consideration. While this cohort had data across three waves, most individuals provided only two saliva samples, and across a limited age range. Moreover, diagnostic status was assessed at the first and final wave, but was not reassessed concurrently with the wave 2 epigenetic sampling. Consequently, while participants with persistent ADHD or without ADHD continued to meet their respective diagnostic criteria at the final wave, it was not possible to determine whether remission occurred during the 18-month intervals between waves 1 and 2 or between waves 2 and 3 for a small subset of participants classified as having remitted ADHD. We address this limitation through additional analyses, which test associations between DNAm and symptom severity (using the Conner’s assessment), measured at each wave of assessment.
These findings are limited to epigenetic markers measured from saliva, and therefore, cannot inform directly on DNAm in brain tissue. We address this gap by testing the enrichment of genes within brain regions of the Allan Brain Atlas, which defines gene expression at varying stages across the lifespan [Reference Grote, Prufer, Kelso and Dannemann41], and by assessing cross-tissue correlations for each individual CpG using the IMAGE-CpG website. While these genes were found to be expressed in brain tissue, this was not corroborated by cross-tissue DNAm correlations in samples collected from an independent cohort of patients with epilepsy [Reference Braun, Han, Hing, Nagahama, Gaul and Heinzman42]. Thus, while some studies report relative stability of DNA across tissue types [Reference Nishitani, Isozaki, Yao, Higashino, Yamauchi and Kidoguchi11], patterns are highly tissue- and cell-specific, and these findings should be interpreted with caution. Further studies on these sites are planned to explore links to the brain by leveraging the extensive neuroimaging data collected through the NICAP study. Lastly, the decision to select probes meeting a study criterion of 5% change at an uncorrected p-value of less than 0.05 may not have been sufficient to overcome residual confounding from batch, or other technical covariates.
In conclusion, our study identified several epigenetic differences between children and adolescents with persistent or remitted ADHD, from neurotypical peers, and from each other. Given the novelty of these findings, we recommend replication in an independent study cohort, in addition to further epigenetic investigations in diagnostic subgroups, rather than pooled clinical samples, using data collective at repeated timepoints.
Supplementary material
The supplementary material for this article can be found at http://doi.org/10.1192/j.eurpsy.2026.12255.
Data availability statement
Data from the Children’s Attention Project cohort are available via Lifecourse: https://lifecourse.melbournechildrens.com/cohorts/cap-and-nicap/. The data that support the findings of this study are available on request from the corresponding author, upon reasonable request.
Acknowledgments
A special thanks to all the children and families for their participation in this study. This work was supported by the MASSIVE HPC facility (www.massive.org.au).
Author contribution
J.W.: data curation, conceptualization, methodology, formal analysis, writing – original draft, and visualization. V.C.: methodology and writing – review & editing. P.D.F.: data curation, methodology, and writing – review and editing. J.M.C.: project administration, resources, and writing – review & editing. T.J.S.: supervision, project administration, resources, conceptualization, methodology, and writing – review & editing.
Financial support
The work was funded by the National Health and Medical Research Council of Australia (NHMRC; grant #2029361) and a grant from the Waterloo Foundation. The broader Children’s Attention Project (CAP) and the Neuroimaging of the Children’s Attention Project (NICAP) cohort was funded by NHMRC (grants #1065895 and #1008522).
Competing interests
The authors declare none.


 Open access


Comments
No Comments have been published for this article.