

Introduction
Red palm weevil (RPW) Rhynchophorus ferrugineus (Olivier) (Coleoptera: Curculionidae/Rhynchophoridae/Dryopthotidae) is a key pest of several palm species and is reported from nearly 50% of the date palm Phoenix dactylifera L. (Arecaceae) growing countries (Faleiro, Reference Faleiro2006). Ever since R. ferrugineus was reported from Rass-El-Khaima in the United Arab Emirates in 1985, it has spread rapidly to all the countries of the Gulf region in the Middle East infesting approximately 5% of the palms in the region with an annual infestation rate of about 1.9 (Zaid et al., Reference Zaid, De Wet, Djerbi, Oihab and Zaid2002). Saudi Arabia produces nearly a million tonnes of dates annually accounting for 15% of the global date production (available at: http://en.wikipedia.org/wiki/Date_(fruit)#Fruit). With the synthesis of the male-produced R. ferrugineus aggregation pheromone (4-methyl-5-nonanol) in the early 1990s (Hallett et al., Reference Hallett, Gries, Borden, Czyzewska, Oehlschlager, Pierce, Angerilli and Rauf1993) and its subsequent commercial availability, pheromone-based area-wide R. ferrugineus integrated pest management (IPM) programmes were initiated to suppress this pest in several date palm plantations of Saudi Arabia and other Gulf countries of the Middle East (El-Ezaby et al., Reference El-Ezaby, Khalifa, El Assal, Rahman Al Afifi and Al Sharif Al Badawy1998; Abraham et al., Reference Abraham, Faleiro, Al Shuaibi and Prem Kumar2000; Vidyasagar et al., Reference Vidyasagar, Mohammed Hagi, Abozuhairah, Al Mohanna and Al Saihati2000; Al-Khatri, Reference Al-Khatri2004; Oehlschlager, Reference Oehlschlager2005).
Adult R. ferrugineus female weevils usually prefer to infest young palms, and hence, as new date palm plantations are developed in the Gulf region, the threat of R. ferrugineus attacking these groves always exists. Recent reports suggest that the annual loss due to eradication of severely infested palms by R. ferrugineus in Saudi Arabia has been estimated to range from US$1.74 to 8.69 million at 1–5% infestation, respectively (El-Sabea et al., Reference El-Sabea, Faleiro and Abo El Saad2009). The concealed nature of this pest demands that a constant vigil be kept on its activity. Early detection of infestation due to R. ferrugineus is the key to the success of any strategy aimed to manage this lethal pest. As there is no reliable instrument to detect infested palms in the field, checking teams have to inspect every palm and rely only on their experience to locate R. ferrugineus-infested date palms. An assumed action threshold of 1% infested palms has been recommended previously to implement pheromone-based area-wide R. ferrugineus IPM programmes (Faleiro, Reference Faleiro2006).
Relying only on infestation reports or pheromone trap captures to initiate area-wide R. ferrugineus IPM operations could often result in either an over- or underestimation of the pest intensity in the field. Such a decision would either lead to initiating IPM when it is not required or not implementing the programme when necessary. Several R. ferrugineus IPM programmes have been in progress for the last 15 years in Saudi Arabia, and it is necessary to periodically validate these programmes.
For the purpose of IPM decision making, the concept of sequential sampling has been reported several times since the mid-1950s (Morris, Reference Morris1954; Harcourt, Reference Harcourt1966; Smith and Shepard, Reference Smith and Shepard2004). Although Faleiro and Ashok Kumar (Reference Faleiro and Ashok Kumar2008) have developed such sampling plans for managing R. ferrugineus in coconut plantations of India, there are no reports on decision-making sampling plans for the management of this pest in date palm.
We have therefore studied the spatial distribution of R. ferrugineus in the region and developed a decision-making sampling plan for the management of R. ferrugineus in date plantations of Saudi Arabia, using the concept of sequential sampling.
Materials and methods
The first step in the development of a sequential sampling plan is to establish the spatial distribution of the insect in nature (Morris, Reference Morris1954). Although R. ferrugineus infestation pattern in date plantations of Al Hassa, Saudi Arabia, depicts clumped or aggregated distribution (Anonymous, 1998), there is no information on the extent of clumping of the weevil population based on mathematical tests in date plantations.
To ascertain the spatial distribution of R. ferrugineus, 120 date plantations including 41,100 palms were inspected in Al Hassa, Saudi Arabia, for 4 days from 4 to 7 August 2008. Data on % infestation for each of the 4 days were used to compute (i) mean and variance, and (ii) clumping parameter K by determining the moment estimate of K and common K values as suggested by Southwood (Reference Southwood1978).
(i) Mean–variance test: here, mean ( ) and variance (S 2) were determined for % infestation, and compared for each of the 4 days. When S 2 <
 , the distribution of the population is uniform, and when S 2>
 , it indicates aggregation. When S 2 =
 , it indicates random or Poisson distribution.
(ii) Dispersion parameter ‘K’: clumping or dispersion parameter K was determined by the following methods:
(a) Moment estimate of K: this parameter measures the degree of aggregation (Elliott, Reference Elliott1979) and was computed using the following formula:

(b) Clumping parameter K: this is a valid and readily computed measure of aggregation for a wide range of insect counts (Bliss and Owen, Reference Bliss and Owen1958; Waters, Reference Waters1959). Here, common K (K c) value was computed using the moment and regression method of Bliss and Owen (Reference Bliss and Owen1958), where

For the above K estimates, a value of < 8 indicates clumped or aggregated distribution, while a value of >8 suggests random distribution.
Having studied the distribution pattern of R. ferrugineus population, the next step was to develop a decision-making sampling plan for initiating new and validating ongoing R. ferrugineus IPM programmes. In this study, we devised a decision-making sequential sampling plan based on (i) the null hypothesis that ‘area-wide R. ferrugineus IPM is not required’, (ii) a mean aggregation index (K c) value of 3.56 and (iii) an assumed action threshold of 1% infested palms. Furthermore, the sampling plan was developed at a risk factor of α and β set at 0.01, where α is the probability of recommending area-wide management when it is not required, and β is the probability of failing to recommend area-wide management when it is required.
The acceptance and rejection lines of the hypothesis that ‘area-wide R. ferrugineus IPM is not required’ are based on the sequential probability ratio test formulae outlined by Wald (Reference Wald1947), and were devised using the formulae:

where d 0 and d 1 are the cumulative maximum and minimum infested palms per ha (100 young palms < 20 years old) for not recommending and recommending area–wide management of R. ferrugineus, respectively, and n is the area sampled in ha. Commercial date plantations in Saudi Arabia use a plant spacing of 10 × 10 m accommodating 100 palms/ha. As RPW usually attacks young date palms below the age of 20 years (Abraham et al., Reference Abraham, Mahmood Al, Faleiro, Abozuhairah and Vidyasagar1998; Anonymous, 1998), the number of palms sampled/inspected in the susceptible age group is important rather than the area covered.

where K is the index of aggregation; p 0 = m 0/K;p 1 = m 1/K; q 0 = p 0+1 and q 1 = p 1+1 and m 0 and m 1 are the lower and upper levels of the infestation set at 1/3 and 2/3 of the assumed action threshold levels. Stern et al. (Reference Stern, Smith, Van Den Bosch and Hagen1959) reported that the economic threshold value would correspond to m 1, which is the level at which treatment should be initiated to prevent economic loss. h 0 is the intercept of the lower line and h 1 is the intercept of the upper line, and are given by h 0 = log B/log (p 1q 0/p 0q 1), where B = β/1 − α, and h 1 = log A/log (p 1q 0/p 0q 1), where A = 1 − β/α, and α and β are the probabilities of failing to recommend the correct decision (i.e. implementing and rejecting area-wide management when it is not essential and essential, respectively) which was set at 0.01 in the plan.
Having developed the sequential sampling plan, it is essential to ascertain its performance. The operating characteristic (OC) and the average sample number (ASN) curves are helpful in visualizing the performance of a sequential sampling plan. A two-level classification plan as the one envisaged in this study is assessed by two basic criteria: (i) accuracy of the classification and (ii) how rapidly an accurate decision is made. These questions are answered by the OC and ASN curves (Binns and Nyrop, Reference Binns and Nyrop1992; Binns et al., Reference Binns, Nyrop and Van der Werf2000).
These curves are based on the formulae outlined for negative binomial distribution by Oakland (Reference Oakland1950) and Waters (Reference Waters1955). The OC curve was developed using the formula:

where A and B are as defined earlier and h is the dummy variable, while

The ASN curve developed for the plan in this study indicates the number of samples at different infestation levels and is given by

where h 1, h 0, L(p), K, p and S are as defined earlier.
The spatial distribution tests, sequential sampling plan and the OC and ASN curves in this study were computed through web-based software available at http://icargoa.res.in/nbd.
Results
Data presented on spatial distribution studies in Table 1 reveal that the variance was more than the mean for all the 4 days, indicating aggregation of the pest. Furthermore, the moment estimate of K and common K values computed for each of the 4 days were < 8, indicating aggregation or contagious distribution of R. ferrugineus in date plantations of Al Hassa, Saudi Arabia (Table 1). The common K value varied from 2.04 to 4.99, from which a mean common K value of 3.56 was computed as the aggregation index of the pest.
Spatial distribution parameters of Rhynchophorus ferrugineus in date plantations of Al Hassa, Saudi Arabia (2008)+

+ Degree of aggregation/clumping is represented by K. For the above K estimates, a value of less than 8 indicates clumped or aggregated distribution.
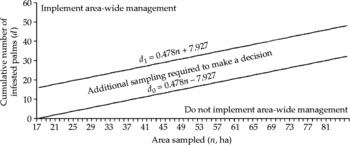
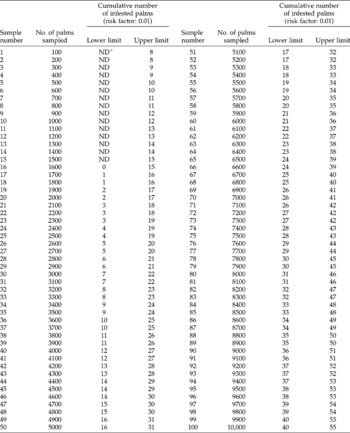
Incorporating the above distribution of R. ferrugineus in date plantations of the region (common K value of 3.56), decision-making sampling lines to accept and reject the null hypothesis that ‘area-wide R. ferrugineus IPM is not required’ were computed as d 0 = 0.478n − 7.519 and d 1 = 0.478n+7.519, respectively, where d 0, d 1 and n are as defined above (Fig. 1). So as to facilitate the use of the sampling plan in the field, we developed Table 2 as a ready-to-use decision-making guide for the plan at the above-mentioned risk factor for the lower and upper infestation limits at different sample sizes.
Sequential sampling plan for area-wide management of Rhynchophorus ferrugineus in date plantations of Saudi Arabia

Decision-making sequential sampling table to initiate and validate area-wide management of Rhynchophorus ferrugineus in date plantations of Saudi Arabia (2010)

+ ND, no decision.
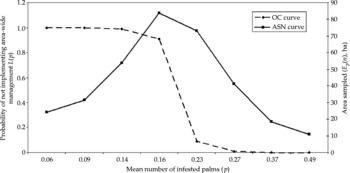
The OC curve for the plan presented in Fig. 2 suggests that at lower infestation means, the probability of accepting the null hypothesis and not implementing area-wide R. ferrugineus IPM is high, with the reverse being true at high infestation means indicating that the sampling plan devised is accurate. In addition, the ASN curve for the plan suggests that at low and high infestation means, few samples are needed, while at medium infestation means, more samples are required, which is also in agreement with the concept of sequential sampling. As per the ASN curve for the plan developed, the maximum sample size is 79 (Fig. 2).
Operating characteristic (OC) and average sample number (ASN) curves for the sequential sampling plan

Discussion
Spatial distribution
Understanding the spatial distribution of an insect pest is an important prerequisite for developing sequential sampling plans (Waters, Reference Waters1955). Spatial distribution patterns of a population can deviate from randomness to be either uniform or clumped (Ruesink and Kogan, Reference Ruesink, Kogan, Metcalf and Luckman1974). The significance of incorporating the spatial and temporal dimensions in managing mobile pests has been well documented in the literature (Yu and Leung, Reference Yu and Leung2006).
In this context, the relationship between variance and mean is extremely useful and allows the development of sequential sampling procedures (Binns and Nyrop, Reference Binns and Nyrop1992). In this study, the variance exceeded the mean, suggesting that the population is aggregated and follows the negative binomial distribution pattern (Southwood, Reference Southwood1978). Furthermore, the dispersion parameter (moment estimate of K and common K) values were < 8. This also indicates aggregation according to Southwood (Reference Southwood1978). This type of aggregation in a R. ferrugineus population has been cited as a cause of increasing in clusters of infestations in date palm plantations in the Al Hassa oasis in Saudi Arabia, resulting in spread of the pest in and around heavily infested date plantations where severely infested palms were eradicated (Anonymous, 1998). Similar studies involving a series of mathematical tests on monthly weevil captures using food-baited RPW pheromone traps showed that its population was highly aggregated in coconut plantations of India (Faleiro et al., Reference Faleiro, Ashok Kumar and Rangnekar2002). Mass trapping of R. ferrugineus in an area-wide operation in coconut plantations of India over a period of 18 months in two villages brought down infestation levels below the assumed action threshold of 1% infestation (Sujatha et al., Reference Sujatha, Chalapathirao Rao and Rao2006).
Sequential sampling plan
Having studied the distribution pattern of R. ferrugineus on date palm in Al Hassa oasis, we incorporated the aggregation index (mean common K) value of 3.56, and devised a decision-making sampling plan to initiate and validate R. ferrugineus IPM in date plantations of Saudi Arabia.
Initiating R. ferrugineus IPM
In this plan, the upper limit to implement area-wide R. ferrugineus IPM for the first 100 palms inspected is eight infested palms. Additional sampling would have to be done at an infestation level of < 8 infested palms (Table 2). In the plan developed, infestation could be rated as low and high if d 0 ≤ 0.478n − 7.519 and d 1 ≥ 0.478n+7.519, respectively. Infestation above d 0 and below d 1 would be rated as medium at which no decision can be made, and additional sampling would be needed to initiate R. ferrugineus IPM. Table 2 is proposed as a ready-to-use decision-making guide, wherein the cumulative total of infestations less than or equal to the lower limit implies that the infestation is light and there is no need to implement area-wide management of R. ferrugineus. A cumulative total of more than or equal to the upper limit indicates that the infestation is high and area-wide management of R. ferrugineus is essential. To apply this plan in the field, running totals of infestation counts are tallied against the lower and upper infestation limits after every 100th palm inspected, and a decision either to implement and not to implement area-wide R. ferrugineus IPM or to continue sampling is made. In Saudi Arabia, RPW infestations gradually increase from the month of May reaching a peak in November, before declining during the winter (Anonymous, 1998). The sampling plan developed in this study could be effectively used to arrive at an accurate decision on damage levels throughout the year at both high and low damage levels.
Faleiro and Ashok Kumar (Reference Faleiro and Ashok Kumar2008) developed two sequential sampling plans to manage R. ferrugineus in coconut plantations of India based on a common aggregation index value of 3.45, and assumed action threshold values of either 1 or 0.5% infested palms, and a risk factor of making the wrong decision was set at 0.05. In the present study, we developed the sampling plan at a very low risk factor (0.01), as date palm has a much higher monitory value when compared with coconut. Besides, the damage due to R. ferrugineus in date palm is more difficult to detect when compared with coconut. Hence the error of making a wrong decision is set at only 1 in 100 in this study when compared with 5 in 100 to manage R. ferrugineus in coconut (Faleiro and Ashok Kumar, Reference Faleiro and Ashok Kumar2008).
Since the 1950s, several decision-making sampling plans for extending threshold-based pest management to the field on the concept of sequential sampling have been developed to manage insect pests in diverse ecosystems including forest insects (Waters, Reference Waters1955), cabbage worm (Harcourt, Reference Harcourt1966), cotton fleahopper (Pieters and Sterling, Reference Pieters and Sterling1974), rice planthoppers (Shepard et al., Reference Shepard, Ferrer, Kenmore and Sumangil1986) and cotton bollworms (Beyo et al., Reference Beyo, Nibouche, Goze and Deguine2004).
Validating R. ferrugineus IPM
Pheromone-based area-wide R. ferrugineus IPM programmes that have been in progress in Saudi Arabia since 1994 need to be validated periodically. Currently, the performance of R. ferrugineus IPM programmes is gauged on the basis of infestation reports and pheromone trap capture data, without considering the spatial distribution of this pest and the risk of either over- or underestimating the damage intensity. This could mislead pest managers to continue with R. ferrugineus IPM in areas where it is not required or stop/scale down the operation where it is essential. We recommend the use of this plan to validate ongoing R. ferrugineus IPM programmes in date plantations of Saudi Arabia, which is devised at a low risk factor (0.01) of making the wrong decision. Hence by using this plan, if repeatedly d 0 ≤ 0.478n − 7.519, then the strategy adopted in that particular operational area could be rated as effective, and the entire operation could be scaled down and valuable resources diverted to localities where the pest is severe. On the other hand, if persistently d 1 ≥ 0.478n+7.519, then the IPM programme in that particular area needs to be strengthened by adopting one or several of the R. ferrugineus IPM tactics proposed by Abraham et al. (Reference Abraham, Mahmood Al, Faleiro, Abozuhairah and Vidyasagar1998) of either repeatedly inspecting palms to detect infestations around pheromone traps with high weevil captures, conducting preventive cover sprays with insecticides, especially in endemic pockets around palms that are heavily infested and had to be eradicated, intensifying the search to locate hidden breeding sites of the pest (beheaded palms, closed and neglected gardens) or strengthening quarantine regimes to prevent its reintroduction where R. ferrugineus has been controlled. At infestation levels between d 0 and d 1, the intensity of the pest could be rated as medium, warranting the need to continue with the programme, which should be strengthened to bring the infestation below the lower limit. At such persisting levels of moderate infestation, it would be reasonable to infer that although the strategy is working, it is not having the desired effect and infestation could cross the upper limit at any moment. Hence at medium infestation levels, no decision can be made, and the next unit of 100 palms would have to be inspected for the purpose of validating ongoing programmes. Under this scenario, it would be desirable to strengthen the IPM strategy in areas with medium infestation. Faleiro and Ashok Kumar (Reference Faleiro and Ashok Kumar2008) developed similar sampling plans to validate R. ferrugineus IPM programmes in coconut plantations of India.
The ongoing area-wide R. ferrugineus IPM programmes in Saudi Arabia are substantially or fully subsidized by the government with very little farmer participation. Yu and Leung (Reference Yu and Leung2006) have developed a model to demonstrate that for managing a common mobile pest faced by many heterogeneous farmers, area-wide pest management is superior to farm-by-farm control, and that co-operation of these heterogeneous farmers is crucial for the success of area-wide pest management. In the date growing oasis of Al Hassa in Saudi Arabia, farmer participation in a 250 ha date plantation situated in an R. ferrugineus hot spot involving regular inspection of palms, weekly servicing of pheromone traps to ensure strong bait–lure synergy, coupled with localized preventive insecticidal cover treatments around pheromone traps capturing weevils, resulted in significant reduction in infestation. Hence farmer participatory R. ferrugineus IPM is highly recommended (Faleiro, Reference Faleiro2008) in the fight against this dreaded pest.
OC and ASN curves
The OC and ASN curves do not directly assist in devising a sequential sampling plan, but are essential to visualize the accuracy and performance of the plan developed (Harcourt, Reference Harcourt1966; Binns and Nyrop, Reference Binns and Nyrop1992). Here, the OC curve predicts the probability of not implementing area-wide management of R. ferrugineus at different infestation means. For the plan developed in this study, the probability of not implementing area-wide R. ferrugineus IPM at low infestation means is high, while as the infestation increases, the probability of accepting the null hypothesis and not implementing area-wide R. ferrugineus IPM is low. This is in accordance with the simulation model provided by Binns et al. (Reference Binns, Nyrop and Van der Werf2000) (available at http://www.nysaes.cornell.edu/ent/faculty/nyrop/cpdm), which suggests that a perfect OC curve has a horizontal line followed by a vertical drop with a subsequent horizontal line at low, medium and high infestation means, respectively, as seen in Fig. 2 of this study.
Furthermore, the ASN curve indicates sampling requirement at different infestation levels. At low and high infestation means, only a few samples are needed to arrive at the correct decision, while at medium infestation levels, more samples are required (Fig. 2), which is in agreement with the concept of sequential sampling. This therefore suggests that the sampling plan developed is accurate. Beyo et al. (Reference Beyo, Nibouche, Goze and Deguine2004) showed that the ASN curve developed for sampling of three cotton bollworms in Northern Cameroon attained a maximum of 17 plants, and was little affected by fluctuations in the clumping index K.
At medium levels of infestation, the problem of continuous open-ended sampling is often encountered while using sequential sampling plans (Ruesink and Kogan, Reference Ruesink, Kogan, Metcalf and Luckman1974). Hence we propose that the maximum number of samples derived in the ASN curve of this study (79) could be taken as the point at which sampling should be stopped, and a decision to initiate IPM should be taken. For validating R. ferrugineus IPM programmes, this problem would not arise.
Conclusion
Spatial distribution studies based on infestation reports in the Al Hassa date palm oasis of Saudi Arabia revealed that the population was clumped and followed the negative binomial distribution pattern with a mean aggregation index (common K) value of 3.56. Furthermore, the decision-making sequential sampling plan developed in this study will assist area-wide R. ferrugineus IPM programmes in Saudi Arabia to accurately decide on whether to initiate new area-wide programmes. Besides, the plan provides pest managers with a valuable tool to validate ongoing area-wide R. ferrugineus IPM programmes and will go a long way in optimizing resources in the fight against this pest in Saudi Arabia.
Acknowledgements
Institutional support provided by ICAR Research Complex for Goa, Old Goa, India and the FAO-funded project (UTF/SAU/015/SAU) at the National Date Palm Research Centre, Al Hassa, Saudi Arabia, to conduct this study is gratefully acknowledged. We also thank the Directorate of Agriculture, Al Hassa, Saudi Arabia, for providing the basic data on infestation.