Introduction
Seasonal terrestrial snow cover is a significant factor in the Earth’s climate system and as such, can be used as an indicator of climate change. The interactions between snow cover and the atmosphere over variable temporal and spatial scales are, however, extremely complex and insufficiently understood. This makes it difficult to isolate cause and effect between snow-cover processes and atmospheric processes (Reference Cohen and RindCohen and Rind, 1991).
In this research, potential relationships between snow-cover extent, expressed through snow water equivalent (SWE), and atmospheric-circulation patterns are investigated to reveal connections between surface and upper air conditions. Anomalous or transitional snow events and corresponding atmospheric circulation may be evident by observing patterns al a temporal resolution of live day averages rather than the monthly means that are common for this type of research.
Snow cover has been shown to have considerable local and regional influence on energy exchange through both a high surface albedo and low thermal conductivity (Reference WalshWalsh, 1984, Reference Walsh1987; Reference DaviesDavies, 1994: Reference FosterFoster and others, 1996). An additional local effect is the reduction of air-mass thickness as it passes over a large area of snow cover. This reduction produces a trough over the colder air, which in turn contributes to snow-cover persistence. Conversely the absence of snow cover may induce rapid air-temperature increase in the spring (Reference WalshWalsh, 1984, Reference Walsh1987; Reference DaviesDavies, 1994).
The effects of a snow cover, or lack of it, at a hemispheric scale are difficult to establish, as snow distribution is influenced by large-scale circulation patterns that vary considerably over synoptic time-scales. To compound matters, while snow cover has established seasonal patterns, a single weather event can extend snow lines extensively and modify SWE (Reference DaviesDavies, 1994). Some teleconnections have been established despite these complexities (see Reference Robinson and LeathersRobinson and Leathers, 1993; Reference WalshWalsh, 1987). For example, extensive snow cover in Eurasia can create lower sea-level pressure over the Asian coast (Reference Walsh and RossWalsh and Ross, 1988). Reference Dickson and NamiasDickson and Naimias (1976) show that extensive or persistent snow cover in North America enhances the land–sea temperature contrast in northeastern North America, which causes a higher frequency of pressure depressions along the Atlantic coast. These examples illustrate that teleconnections do exist, but that they need to be clarified and further developed to allow a fuller understanding of the relationship between snow cover and upper atmospheric circulation.
In this study a two-step method to identify and isolate relationships between patterns of SWE and the atmosphere is incorporated. First, rotated principal components analysis PCA was used to simplify mathematically the time series of data for each variable. Associations between upper atmospheric patterns and snow-cover data were then identified through canonical correlation analysis (CCA) of the derived principal component loadings. The CCA scores indicate which snow-cover principal components are associated with specific atmospheric components. Through this, a process leading to an understanding of the spatial and temporal changes in snow cover and the corresponding atmospheric variables may be developed. Identifying and understanding how snow cover and the atmosphere interact is critical to monitoring and comprehending the processes that affect global climate variability.
Data
SSM/I-Derived SWE Data
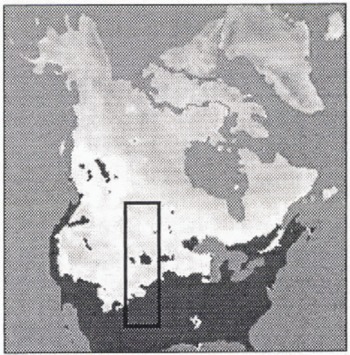
Northern Hemisphere SWE was derived from Special Sensor Microwave Imager (SSM/I) data available in the Equal Area SSM/I Earth (EASE) grid projection provided by the National Snow and Ice Data Center, Boulder. These data were available from 1 August 1987 to 15 December 1988. (As additional data become available the study periods can be extended.) Passive-microwave data were used for the study as they provide excellent temporal (daily) and adequate spatial (approximately 25 km pixel centres) coverage for snow investigations. From the EASE grid projection, a study area encompassing a large portion of the Canadian Prairies and the American Great Plains (approximate area of 1.5 million km2, or 30 × 80 = 2400 pixels) was selected (Fig. 1) as this region is frequently subjected to transitional snow events of short ground duration.
Study area subscene outlined on a SSM/I image

The Canadian Atmospheric Environment Service (AES) has developed and evaluated single- and dual-channel algorithms (Reference GoodisonGoodison, 1989) for determining snow cover using passive-microwave data; the algorithms are used routinely to produce SWE maps for various regions of Canada. Reference Goodison, Walker, Choudhury, Kerr and PampaloniGoodison and Walker (1994) outline the use of the algorithms, their strengths and weaknesses and the utility of passive microwave remote sensing for snow-cover climate-change investigations. The AES dual-frequency algorithm was used to derive SWE from passive-microwave data in this study. This algorithm utilizes the vertically polarized 19 and 37 GHz channel brightness temperatures and was developed in conjunction with field work performed in the Canadian Prairies (Reference Goodison, Rubinstein, Thirkettle and LanghamGoodison and others, 1986; Reference GoodisonGoodison, 1989). Greater confidence can therefore be placed in the SWE values used in this work as the study area was comprised solely of Prairie surfaces for which this algorithm was specifically developed. Variable surface types, such as forest cover and alpine regions, adversely affect algorithm performance.
Data were combined into 17 five-day averaged images (pentads) between 16 January and 9 April 1988. A five-day temporal resolution was selected to construct a time series of acceptable synoptic sensitivity, while maintaining a practical number of time series images. Early plans for this work, and Subsequent analysis not discussed here, utilized a larger study area and longer time series that emphasized the need for a manageable number of time-series images. The SWE values through all pentads were standardized to values between 0 and 100. The study time period was limited due to the shutdown of the SSM/I sensor between 2 December 1987 and 15 January 1988, while the study area was clear of snow by 10 April 1988. It is important to note that during the winter and early spring of 1988, snow-cover extent was well below normal (Reference Frei and RobinsonFrei and Robinson, 1993): this was a period of drought over the Prairies/Great Plains. Ascending orbits were used for analysis as brightness temperatures are recorded in the morning and thereby lessen the influence of melt.
National Meteorological Center Gridpoint Upper Atmospheric Circulation Data
Atmospheric data from the National Meteorological Center (NMC), now National Center for Environmental Prediction, NCEP) were used in the analysis. These data are projected onto a 1977 point octagonal grid, with equally spaced data points when viewed polar stereographically. Gridpoinls over the entire North American continent, including the Arctic Archipelago and Greenland, were used for the PCA to ensure an adequate number of data points created a statistically robust PCA procedure. The North American continental area has a 323 point NMC data coverage (19 × 17). Pentads of 700 mb geopotential height (700H) and temperature (700T), 500 mb geopotential height (500H). and 500–700 mb thickness (THK) were created.
Methodology
PCA
PCA is a technique used to transform mathematically an original dataset into a reduced set of uncorrelated variables to represent the majority of the information presented in the original data. This set of uncorrelated variables simplifies time-series data analysis by representing the entire dataset in a smaller number of images that proportionally explain the variance within the original time-series data (for example, Reference Fung and LeDrewFung and LeDrew, 1987). PCA was performed on the SSM/I SWE and NMC upper atmospheric pentads using the statistical analysis software (SAS) package (SAS Institute Inc., 1990). These data were orthogonally transformed using the varimax rotation method, which maximizes the sum of the variances of the squared loadings within each column of the loadings matrix (Reference DuntemanDunteman, 1989). While other orthogonal-rotation methods were tested (i.e. equamax, orthomax), the varimax rotation was selected as it produced consistent spatially coherent results.
Each PCA input matrix was composed of columns for each time-series pentad, while SSM/I pixels or NMC grid-points comprised the rows. For example, the input matrix for the SWE data was 17 columns by 2100 rows. PCA was performed using a correlation matrix approach as opposed to a covariance matrix as discussion has shown this method to be advantageous in synoptic climatological applications (Reference Overland and PreisendorferOverland and Preisendorfer, 1982). The first three components for each variable were subjectively retained for CCA analysis. In all cases, variance explained by component 3 was just below or greater than 10% while the variance explained by component 4 dropped to near 1% making this an obvious cutoff. While tests for component selection do exist (for example, Reference Overland and PreisendorferOverland and Preisendorfer, 1982). components can fail selection tests and still track a geophysical process that occurs through the presence of noise, and therefore can still be relevant (Reference Preisendorfer, Zwiers and BarnettPreisendorfer and others, 1981).
CCA
In essence CCA replaces a series of linear regressions of each pattern in one variable set with those of another by a single procedure that considers multiple variables in each of the two datasets. This approach has been used in meteorological analysis by Reference LeDrewLeDrew (1983, Reference LeDrew1985) and Reference CraneCrane (1983) as well as other applications (for example, Reference JakuhauskasJakubauskas, 1996). In this study, this type of analysis was performed on the rotated principal-component loadings of snow cover and each atmospheric variable, producing a series of canonical scores. These scores indicate the strength or weakness of the relationship between the dominant patterns of SWE, and related atmospheric-circulation patterns. CCA was only performed on the retained component loadings so the first 3 SWE components were correlated against the loadings from the first 3 atmospheric components. The SAS statistical analysis software package was used to perforin the CCA (SAS Institute Inc., 1990).
Results
PCA
Results of the PCA (Table 1) for the SWE data indicate that the first 3 components combine for over 90% of the variance in the original data. After these first 3 components, variance explained drops below an acceptable level and predominantly expresses data noise. Results of the PCA of the atmospheric data indicate that the majority of the variance in all of the upper atmospheric data can also be explained by the first 3 principal components (Table 1).
Percent variance explained by rotated principal components

Principal components do not depict actual observable data patterns, but rather variance exhibited within the original data. Therefore, in order to visualize the data that components are representing, composite images of time-series data that load strongly to each specific component were created. Loading plots for the first 2 components of each variable are presented below, along with composite time-series data that loads over 0.75 to each component. Through this procedure, real spatial patterns cm be visualized through the component loadings.
An examination of the data shown in Figure 2 and 3 show that SWE component 1 explains data variance found during snow-cover maximum, while SWE component 2 accounts for variance during snow-cover minimum. This seasonal trend is also obvious through examination of component loadings, also shown in Figure 2 and 3. The southern snow-cover margin in the study area moves across eastern Colorado though Kansas and into Iowa. Snow-cover minimum shows remaining traces of snow in Manitoba and the eastern edge of Colorado—possibly under alpine influence.
Composite time-series data representing the variance explained by SWE component 1 (a). Time-series data were selecled from the loadings output plotted in (b), with the line representing the 0.75 loading cutoff.

Composite time-series data representing the variance explained by SWE component 2 (a). Time-series data wire selected from the loadings output plotted in (b), with the line representing the 0.75 loading cutoff.

The composite data, which load heavily to the first 2 components for each atmospheric variable, are shown in Figures 4–9, and depict the two dominant patterns of atmospheric circulation over the continent during the study time period. The first is a predominantly zonal pressure system over central North America, with a low based over Labrador and eastern Hudson Bay. (Figs 4 and 5). A corresponding zonal temperature gradient (Fig. 6) is also evident with coldest temperatures over the Canadian Arctic Archipelago and consistent warming advancing southward. The second circulation pattern is strongly meridional, again with a low centred over Hudson Bay and orographic-indueed ridging to the west with a trough south of the Great Lakes (Figs 7 and 8). Temperatures again correspond to this meridional pattern (Fig. 9.)
Composite time-series data representing the variance explained by 500 mb geopotential highl component 1 (a). Time-series data were selected from the loadings output plotted in (b), with the line representing the 0.75 loading cut-off

Composite time-series data representing the variance explained by 700 inh geopotential height component 1 (a). Time-series data were selected from the lodings output plotted in (b), with the line representing the 0.75 loading cut-off.

Composite time-series data representing the variance explained by 700 mb air temperature component 1 (a), Time-series data were selected from the loadings output plotted in (b), with the line representing the 0.75 loading cut-off

Composite time-series data representing the variance explained by 500 mb geopotential height component 2 (a). Time-series data were selected from the loadings output plotted in (b), with the line representing the 0.75 loading cut-off.

Composite time-series data representing the variance explained by 700 mb geopotential height component 2 (a). Time-series data were selected from the loadings output plotted in (b), with the line representing the 0.75 loading cut-off.

Composite time-series data representing the variance explained by 700 mb air temperature component 2 (a). Time-series data were selected from the loadings output plotted in (b), with the line representing the 0.75 loading cut-off.

CCA
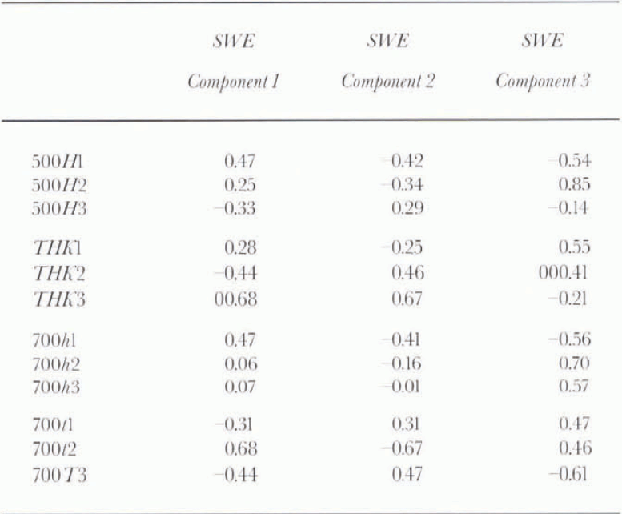
Inter-correlations between component loadings revealed by the CCA are shown in Table 2. High correlations exist between 500H component 2 and SWE component 3 (0.85), 700 H component 2 and SWE component 3 (0.70), THK component 3 and SWE component 1 (−0.68), and 700T component 2 and SWE component 1 (0.68). This demonstrates clear linkages between spatial patterns in the SWE and atmospheric variables, the first step towards understanding potential feedbacks.
Regression coefficients among variables
A summary of the CCA results is shown in Table 3. In all cases, correlation between the SWE and atmospheric variales was high (>0.80) accounting for 79–89% of the information contained in the first canonical correlation. An example of extended CCA results is shown in Table 4. Standardized coefficients indicate the relative contribution of a variable to the canonical variate. Canonical loadings are the correlation between an original variable and the canonical variates for that data. Cross loadings are correlations between original variables (in this case, SWE) and the canonical variates of the opposite set (atmospheric variables), and are given for all combinations of SWE and atmospheric data in Table 5.
Summary of canonical correlation results

Example of canonical correlation coefficients and loadings

Correlation cross loadings for selected variable sets

Results of the CCA indicate strong positive associations between a meridional atmospheric-circulation pattern at both the 500 and 700 mb geopotential height levels with ridging over the western Cordillera and SWE component 1, which is the pattern of snow-cover maximum. This meridional pattern allows for the penetration of systems of Arctic and North Pacific origin over the central plains, and is clearly the pattern of greatest moisture advection. 700T component 2 also cross loads strongly to SWE component 1, and the time-series data that loads highly to 700T component 1 shows generally colder air temperatures over the majority of the study area than characteristic conditions that load strongly to 700T component 2.
CCA cross loadings also reveal a relationship between the zonal pressure and temperature distribution pattern as characterized by the first components of 500H, 700H, and 700T, and snow-cover minimum (SWE component 2). This zonal pattern constrains Arctic air masses and associated temperatures in the north, allowing moderating temper atures and snow ablation to dominate the study region under predominantly westerly air flow.
Conclusions
In this paper we have restricted the analysis to the first 2 spatial modes in the aerological and SWE data to demonstrate the feasibility of the approach for examining snow-cover processes at the synoptic scale. A complete analysis, including the lower components, is forthcoming. The results of the first 2 components are logical and consistent. A meridional flow over the Great Plains is associated with the paltern of maximum extent in the SWE, whilst a zonal flow is associated with minimum extent. These 2 modes are the major components in the variance fields.
More insight into the nature of the linkages must await further analysis of several years of data that will allow lag analysis to be applied with confidence. The intent is to develop a climatology of atmosphere SWE comparable to that which exists for atmosphere–sea-ice variability and change. The constraint is the validation of the SWE algorithms for which we have confidence only over the Great Plains. The behaviour in forested areas and upland regions is fraught with unknowns. It is clear that work on calibration of algorithms for a variety of surface structures, such as that of Reference TaitTait (1996), is necessary to realize further the true potential of these datasets.