I. INTRODUCTION
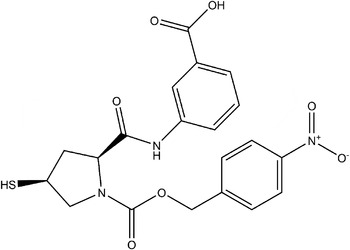
Ertapenem is an important first-line carbapenem antibiotic. It provides a new, potent, and convenient choice in the treatment of mixed aerobic/anaerobic polymicrobial infections (Shah and Isaacs, Reference Shah and Isaacs2003). Ertapenem side chain (Figure 1) is the key intermedium for synthesis of ertapenem, and is also the important raw material for a new ertapenem intermediate by reacting with carbapenem derivative (Sheng, Reference Sheng2014).
Structural formula of ertapenem side chain.

Presently, the detailed X-ray powder diffraction (XRD) data for ertapenem side chain have not been reported.
II. EXPERIMENTAL
A. Sample preparation
Ertapenem side chain (High Performance Liquid Chromatography [HPLC] ≥ 98%), was obtained from Shandong Xiya chemical industry Co., Ltd., Shandong, China. The melting point and measured density of ertapenem side chain are 258–259 °C and 1.449 g cm−3, respectively. The Fourier transform-infrared (FT-IR) spectrum of ertapenem side chain was presented in Supplementary Figure SI.
B. Diffraction data collection and reduction
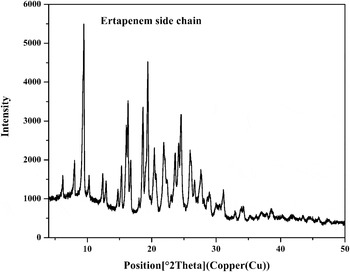
The diffraction pattern for ertapenem side chain was collected at room temperature using an X'Pert PRO diffractometer (PANalytical Co., Ltd., The Netherlands) with a PIXcel one-dimensional detector and CuKα radiation (generator setting: 40 kV and 40 mA). The diffraction data were collected over the angular range from 4° to 50°2θ with a step size of 0.01313°2θ and a counting time of 50 ms per step (Figure 2).
XRD pattern of ertapenem side chain using CuKα radiation.

Data evaluation was performed using the software package Material Studio 8.0 (Accelrys Co., Ltd., San Diego, California, USA) in the Analytical & Testing Center (Sichuan University, Chengdu, China). The XRD pattern was pre-treated by subtracting the background, smoothing, and stripping off the Kα2 component. Automatic indexing results were obtained by X-Cell method (Neumann, Reference Neumann2003). The indexing results were then refined using Pawley (Pawley, Reference Pawley1981), which involves assigning the Miller indices (h, k, l) to each observed peak in the experimental XRD pattern.
III. RESULTS
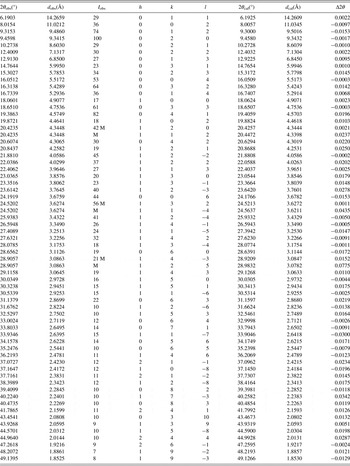
The experimental powder diffraction pattern is depicted in Figure 2. Indexing results show that ertapenem side chain is monoclinic with the space group P21/c and unit-cell parameters: a = 4.907(6) Å, b = 18.686(3) Å, c = 22.071(0) Å, α = γ = 90°, β = 90.759(5)°, unit-cell volume V = 2023.82 Å3, Z = 4 and ρ cal = 1.462 g cm−3. The values of 2θ obs, d obs, I obs, h, k, l, 2θ cal, d cal, Δ2θ are listed in Table I.
Indexed XRD data for ertapenem side chain. The d-values were calculated using CuKα 1 radiation (λ = 1.54056 Å).

SUPPLEMENTARY MATERIAL
The supplementary material for this article can be found at https://doi.org/10.1017/S0885715617000513.
ACKNOWLEDGEMENTS
This work was supported by the Large-scale Science Instrument Shareable Platform Construction of Sichuan Province (Grant No. 2015JCPT0005-15010102).