Introduction
The retinal pigment epithelium (RPE) is a highly specialized and polarized cell monolayer of the retina. Major RPE functions important for the adjacent photoreceptors and choroid include phagocytosis of photoreceptor outer segments, absorption of excess light, processing of retinoids for phototransduction (visual cycle), maintenance of the blood–retina barrier, and secretion of growth factors, cytokines, and lipoprotein particles (Strauss, Reference Strauss2005; Shi et al., Reference Shi, Maminishkis, Banzon, Jalickee, Li, Hammer and Miller2008; Wang et al., Reference Wang, Li, Rudolf, Belyaeva, Chung, Messinger, Kedishvili and Curcio2009). The overlying photoreceptors show a characteristic distribution in humans, which reflects different requirements for vision: cones only in the fovea, highest rod density in the perifovea, and highest rod:cone ratio in the near periphery (Curcio et al., Reference Curcio, Sloan, Kalina and Hendrickson1990).
The majority of cells in the human body have one nucleus and only a few cell types that are multi-nucleated (Lacroix & Maddox, Reference Lacroix and Maddox2012). In a classic 1967 study by Ts'o and Friedman, 3% of RPE cells in humans were reported bi-nucleate (Ts'o & Friedman, Reference Ts'o and Friedman1967). Precise information about spatial distribution of bi-nucleate RPE cells in the human RPE is rare since information about exact measurement position is unavailable (Ts'o & Friedman, Reference Ts'o and Friedman1967) or imprecisely reported with regard to distance from the fovea (Robb, Reference Robb1985). Robb et al. described regional differences in bi-nucleate cell density in the developing human eye, with highest density (4.7%, range 1.7–11.4%) at the equator; however, no numbers for macula were reported. Multi-nucleate cells in some tissues may have a protective role in stressed and cancer cells (Lacroix & Maddox, Reference Lacroix and Maddox2012; Pandit et al., Reference Pandit, Westendorp and de Bruin2013). The significance of multi-nucleate cells in the human RPE is not understood, and an accurate description of their topography would be informative.
In histological autofluorescence images of the RPE, cell nuclei appear as nonfluorescent intracellular structures (Bodenstein & Sidman, Reference Bodenstein and Sidman1987). In our recent study of histological autofluorescence in RPE flat-mounts (Ach et al., Reference Ach, Huisingh, McGwin, Messinger, Zhang, Bentley, Gutierrez, Ablonczy, Smith, Sloan and Curcio2014), we noted that cell nuclei were devoid of autofluorescence and thus clearly silhouetted against the bright autofluorescence signal of lipofuscin and melanolipofuscin. Here, we used these images to systematically examine the macula and near periphery of human RPE flatmounts to determine the number of nuclei per cell, at different eccentricities and quadrants. We found a characteristic distribution of multi-nucleate cells that might reflect the adaptation of RPE cells to the special needs of overlying photoreceptors.
Materials and methods
The Institutional Review Board at the University of Alabama at Birmingham approved the use of human tissue. All methods conformed to the guidelines of the Declaration of Helsinki.
Tissues
RPE-flatmount tissues were collected from eyes of white donors to the Alabama Eye Bank recovered within 4.2 h of death (median 2.3 h) (Ach et al., Reference Ach, Huisingh, McGwin, Messinger, Zhang, Bentley, Gutierrez, Ablonczy, Smith, Sloan and Curcio2014). Briefly, RPE-Bruch's membrane (BrM) flatmounts were prepared from chorioretinal tissue (∼20- to 25-mm total width and including optic disc, macula, and retinal vascular arcades) by removing retina and choroid in a multistep, photodocumented process. The filamentous actin of the RPE cells was labeled with Alexa Fluor 647 phalloidin (#A22287; Life Technologies, Grand Island, NY). Tissues were mounted (#P36930, ProLong Gold anti-fade reagent; Molecular Probes, Eugene, OR) with BrM down on microscope slides (#12-550-15; Fisher Scientific, Pittsburgh, PA), and cover slipped (#061812-9; Fisher Scientific, Pittsburgh, PA) (Ach et al., Reference Ach, Huisingh, McGwin, Messinger, Zhang, Bentley, Gutierrez, Ablonczy, Smith, Sloan and Curcio2014).
The absence of chorioretinal pathologies in all tissues was determined by gross inspection under a dissection microscope using trans- and oblique epi-illumination. Additional ex vivo spectral domain optical coherence tomography and AF images (Spectralis, Heidelberg Engineering, Heidelberg, Germany) corroborated these assessments, for 15 tissues.
Imaging acquisition and sampling
The imaging procedure and data acquisition were described in detail (Ach et al., Reference Ach, Huisingh, McGwin, Messinger, Zhang, Bentley, Gutierrez, Ablonczy, Smith, Sloan and Curcio2014). Briefly, fluorescence imaging was performed using a BX51 microscope (Olympus, Center Valley, PA) with a motorized stage control, oil objective (UPlanApo 340 oil iris, numerical aperture 1.0; Olympus), digital camera (Orca R2, Hamamatsu, Middlesex, NJ), excitation light source emitting a mercury arc lamp spectrum (Xcite 120Q, Lumen Dynamics Group Inc., Mississauga, Ontario, Canada), and filter cubes for cytoskeleton imaging (LF635-B-000, excitation 635 nm, emission >650 nm; Semrock Inc., Rochester, NY) and AF lipofuscin/melanolipofuscin imaging (Long-pass GFP filter cube OSF-GFP-30LP-B-Z, excitation: 460–490 nm, emission >505 nm, Semrock Inc.), all under control of the integrated microscope software (cellSens Dimension V1.7.1; Olympus). Tissues were imaged at 0.4 µm steps in the z-direction. For each tissue, images were taken at 75–90 predefined locations in an unbiased sampling pattern centered on the foveola and covering eccentricities from 0 to 10 mm.
For the current study, AF and cell cytoskeleton data sets from 19 [two age groups: ≤51 years (9 donors) and >80 years (10 donors)] of the previously 20 imaged tissues were used. In one tissue nuclei were hardly visible and thus were not included in the analysis. From each tissue data set, images were chosen in one of 12 locations: three eccentricities (within 0.5 mm from foveal center), perifovea (4 mm distance to foveola), and periphery (10 mm distance to foveola) at four quadrants (superior, inferior, nasal, and temporal). Based on our previous findings, these areas sample the varying photoreceptor populations serviced by RPE (fovea: cones only; perifovea: highest rod density; near periphery: highest rod/cone ratio) (Curcio et al., Reference Curcio, Sloan, Kalina and Hendrickson1990; Ach et al., Reference Ach, Huisingh, McGwin, Messinger, Zhang, Bentley, Gutierrez, Ablonczy, Smith, Sloan and Curcio2014).
Nucleus determination and analysis
From the 228 possible locations (19 tissues × 12 locations), 28 locations were omitted from further analysis due to poor image quality or preparative tissue losses. Therefore, nuclei were counted in the remaining 200 locations.
We used the z-stacks of autofluorescence images (488 nm excitation) to view an autofluorescence-devoid region in each cell, as described (Bodenstein & Sidman, Reference Bodenstein and Sidman1987). Z-stacks were overlaid with a Voronoi diagram representing each cell (Fig. 1). To record nuclear position, we used a custom FIJI plugin (http://fiji.sc; plugin available from the authors upon request) (Fig. 1). A trained observer scrolled through image z-stacks at each location to find the best focus for the nucleus of each cell and place a mark indicating “definitely present” at its center. While rolling focus through a z-stack, all cellular boundaries could be seen. Nuclei close to cell borders were assigned to the cell body that covered the largest part of the nuclei.
Computer-assisted manual marking of cell nuclei. (A) Single image from z-stack before marking. (B) Single image from z-stack with Voronoi regions (surrogate for cells, thin green borders around cells) displayed and cell nuclei identified (white dots). All data within yellow edging were used for analysis. As previously described, (Ach et al., Reference Ach, Huisingh, McGwin, Messinger, Zhang, Bentley, Gutierrez, Ablonczy, Smith, Sloan and Curcio2014) Voronoi regions (collection of regions that tessellate a plane) were generated from corresponding RPE cytoskeleton images (not shown). Scale bar: 20 µm.

Cells lacking visible nuclei were marked as “cannot determine.” This category included those that had an artifact obscuring visualization, cells that were hypo-autofluorescent due to a high density of melanosomes, and nuclei that could not be distinguished from the cytoplasm. We included for analysis only those locations with “definitely present” greater than 85%. This led to elimination of four locations, for a total of 196 locations to be analyzed.
Statistics
For analysis, percentage of multi-nucleate cells and nuclei per cell were determined. Poisson regression models using generalized estimating equations were used to compare the mean number of nuclei per cell by age group, eccentricity, and quadrant. The exchangeable correlation structure was imposed, which models equal correlations between each location; this structure produced better-fit statistics than other correlation structures (Ziegler et al., Reference Ziegler, Kastner and Blettner1998). To test this association, model-based and empirical standard errors (SEs) were calculated. Results were similar between the empirical and model-based, so for consistency P-values are presented from the empirical SE models only. The analysis was repeated using a binomial regression model with a binary outcome (0 = cell had 1 nucleus, 1 = cell had >1 nucleus). Lastly, Spearman correlations were used to assess the linearity between the number of nuclei, cell area, AF, and number of neighbors. P-values <0.05 were considered statistically significant.
Results
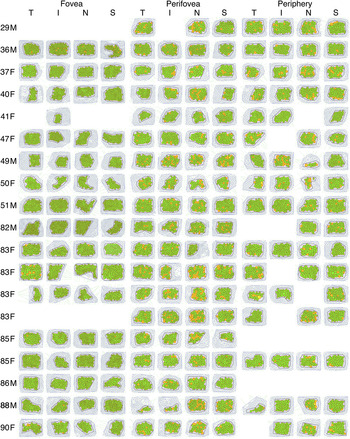
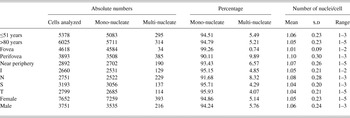
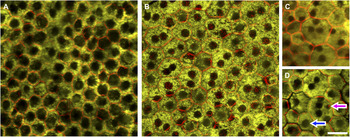
Nineteen macula RPE–BrM flatmounts (9 ≤ 51 years, 10 > 80 years) were imaged at 196 locations (Fig. S1) in an unbiased and predefined pattern, and a total of 11,403 cells were interrogated (Table 1). Of these, 94.7% (10,797 cells) were mono-nucleate, and 5.31% (606 cells) were bi-nucleate. Two cells (0.02%) had three and one cell (0.01%) had five nuclei, respectively (Fig. 2). There was no significant difference between the two age groups, either in the percentage of multi-nucleate cells (P = 0.79) or the mean number of nuclei per cell (both ∼1.05 nuclei per cell, P = 0.83). As reported earlier, we detected no evidence for overall reduction in RPE cell density between the two age groups, consistent with collectively inconclusive age-effects reported by other investigators (Ach et al., Reference Ach, Huisingh, McGwin, Messinger, Zhang, Bentley, Gutierrez, Ablonczy, Smith, Sloan and Curcio2014).
Voronoi regions from 196 locations used for analysis. The reconstructed Voronoi region images are plotted for each donor (number, age of donor; F, female; M, male), for each eccentricity (fovea, perifovea, near periphery) and quadrant (T, temporal; S, superior; N, nasal; I, inferior). Percentage of multi-nucleate cells differs significantly between eccentricities and quadrants. The Voronoi regions reflect the original RPE pattern in very good approximation (Ach et al., Reference Ach, Huisingh, McGwin, Messinger, Zhang, Bentley, Gutierrez, Ablonczy, Smith, Sloan and Curcio2014). The small blue dots are at the center of each Voronoi region, i.e., the center of the RPE cell. The borders of each Voronoi region are highlighted in green. All regions completely within the black edging were used for analysis. The black edging includes only those regions with clearly visible cells in the original images, while tissue areas with reduced image quality impacting analysis (e.g., wrinkles, damage during preparation) were omitted. The black dots represent the location of the nuclei (“definitely present”) as manually detected using a custom FIJI-plugin, within each Voronoi region (delimited by red borders). Gray dots represent nuclei “cannot determine.” Cells with one nucleus are filled green, with two nuclei are orange, and with three nuclei are yellow.

Absolute numbers, percentages, and number of nuclei/cell in RPE cells of the human macula.

I, inferior; N, nasal; S, superior; T, temporal; s.d. , standard deviation.
RPE cells with one (A) or multiple (B–D) cell nuclei in normal human macula. There are mono- (A) and fewer bi-nucleate (B) RPE cells visible throughout the macula. Only a few cells with ≥3 nuclei were detectable: tri-nucleate (C) and penta-nucleate (D). Cells in regions with a high percentage of bi-nucleate RPE cells are pleomorphic in size and shape. Of note in (D), cell nuclei differ in size (blue arrow: nucleus size comparable to nuclei in surrounding cells; magenta arrow: a noticeably smaller nucleus). Foveal cells in panel A have abundant, apically located melanosomes which can be mistaken for large nuclei. (A) Temporal perifovea, female, 41 years. (B) Nasal near periphery, female, 37 years. (C) Superior near periphery, male, 88 years. (D) Superior perifovea, female, 50 years. Scale bar: 20 µm.

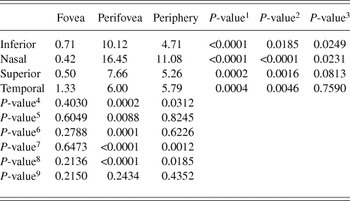
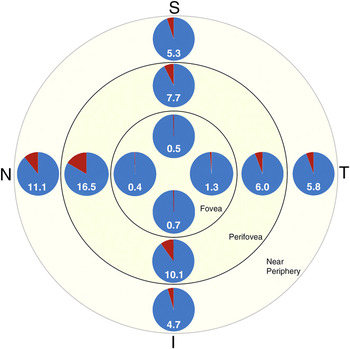
Significant differences in number of multi-nucleate cells were detectable between eccentricities fovea, perifovea, and periphery (Table 2, Fig. 3, Fig. S1). Perifovea had the highest mean number of nuclei per cell, followed by periphery and fovea (1.10, 1.07, 1.01, respectively; Table 1). At the perifovea, a significantly higher percentage of multi-nucleate RPE cells (9.89%) were found compared to fovea (0.74%, P ≤ 0.001) and periphery (6.57%, P ≤ 0.0001).
Percentages of multi-nucleate cells in each quadrant at each eccentricity and the inter-quadrant (superior, inferior, nasal, temporal) and inter-eccentricity (fovea, perifovea, near periphery) significances

P-value1 compares fovea versus perifovea.
P-value2 compares fovea versus. periphery.
P-value3 compares perifovea versus. periphery.
P-value4 compares inferior versus. nasal.
P-value5 compares inferior versus. superior.
P-value6 compares inferior versus. temporal.
P-value7 compares nasal versus. superior.
P-value8 compares nasal versus. temporal.
P-value9 compares superior versus. temporal.
Percentages of multi-nucleate RPE cells as a function of eccentricity and quadrant. The percentage of multi-nucleate RPE cells at each location, i.e., quadrant at each eccentricity, is presented in this multi pie illustration: as number and area (red) of each pie. Cells were pooled across all tissues. Quadrant (T, temporal; S, superior; N, nasal; I, inferior).

There was also a significant difference between the nasal quadrant and the inferior, superior, and temporal quadrants. The nasal quadrant had the highest mean number of nuclei per cell (1.08) while the inferior, superior, and temporal quadrants had similar means (∼1.04).
Quadrant analysis revealed highest percentage of multi-nucleate cells nasal (8.32%), followed by inferior (4.85%), superior (4.29%), and temporal (4.07%) quadrant (Table 1). Comparisons by quadrant and eccentricity are shown in Table 2.
There was a weak positive correlation between area, number of neighbors and total AF/cell with number of nuclei. It was our impression that some cell nuclei in multi-nucleate cells were smaller than nuclei in surrounding cells [Fig. 2(D)].
Discussion
This is the first study examining the spatial distribution of multi-nucleate RPE cells of the human macula in a systematic and unbiased sampling pattern. Highest densities of multi-nucleate cells are found at the perifovea, which identifies a close relationship to the distribution and metabolism of overlying rod photoreceptors. Remarkably, the lowest densities were consistently found for the fovea, suggesting that minimal perturbations from perfect geometry confer a selective advantage for foveal cone vision (Hirsch & Curcio, Reference Hirsch and Curcio1989).
Differences between humans and laboratory animals in RPE polyploidy
Among mammals, bi-nucleate RPE cells are reported for mice, rats, monkeys, and humans (Ts'o & Friedman, Reference Ts'o and Friedman1967). Rodents have a high percentage of bi-nucleate cells (up to 85%) (Ts'o & Friedman, Reference Ts'o and Friedman1967), that is attained shortly after birth (Bodenstein & Sidman, Reference Bodenstein and Sidman1987). Bi-nucleate RPE in rodents exhibit spatial differences: 70% of cells in the center are bi-nucleate (Al-Hussaini et al., Reference Al-Hussaini, Kam, Vugler, Semo and Jeffery2008), while this number declines to 25% in the periphery (Bodenstein & Sidman, Reference Bodenstein and Sidman1987). Frequency of bi-nucleate RPE cells in humans and monkeys seems to be identical (Ts'o & Friedman, Reference Ts'o and Friedman1967), however, reports are rare and while a few snapshots of bi- or multi-nucleate cells in humans are available in the literature (Feeney, Reference Feeney1978; Al-Hussaini et al., Reference Al-Hussaini, Kam, Vugler, Semo and Jeffery2008; Al-Hussaini et al., Reference Al-Hussaini, Schneiders, Lundh and Jeffery2009; Ding et al., Reference Ding, Johnson, Herrmann, Farsiu, Smith, Groelle, Mace, Sullivan, Jamison, Kelly, Harrabi, Bollini, Dilley, Kobayashi, Kuang, Li, Pons, Lin and Bowes Rickman2011), no systematic analysis exists so far. In two histological studies hydrogen peroxide bleached, hematoxylin eosin stained RPE flatmounts were used to report multi-nucleate RPE cells. Ts'o and Friedman found only 3% bi-nucleate RPE cells in humans (Ts'o & Friedman, Reference Ts'o and Friedman1967) viewed at unspecified regions. Later, Robb et al. found that during ocular development (gestational week 25–6 years post-natal), the rate of bi-nucleate RPE cells in humans was highest at the equator (4.7%, ranging from 1.7 to 11.4%), and stable throughout development (Robb, Reference Robb1985). Thus the frequency and topography of multinucleated RPE cells differ significantly between humans and rodents, highlighting the limited comparability of posterior poles of mice and humans.
In humans: Striking absence of multi-nucleated RPE at the fovea
The nearly complete absence of multi-nucleate cells in the human fovea is striking, underlying the high order of cells in the RPE monolayer at this region. The fovea has the highest density of mono-nuclear, hexagonal RPE cells (Ach et al., Reference Ach, Huisingh, McGwin, Messinger, Zhang, Bentley, Gutierrez, Ablonczy, Smith, Sloan and Curcio2014), which may reflect the specialized needs of foveal cones in sustaining high-acuity vision. The perfect spatial order of RPE cells and photoreceptors might be the prerequisite for optimal photon capture at the fovea center (Williams, Reference Williams1985). The spacing and geometry of cone packing is optimally balanced for resolution without aliasing except under specific circumstances (Hirsch & Curcio, Reference Hirsch and Curcio1989; Provis et al., Reference Provis, Dubis, Maddess and Carroll2013). The RPE under the fovea reflects the requirements of cone sampling array by maintaining hexagonality (Ach et al., Reference Ach, Huisingh, McGwin, Messinger, Zhang, Bentley, Gutierrez, Ablonczy, Smith, Sloan and Curcio2014) and minimal number of nuclei. In contrast, the highest rate of bi-nucleate cells is at the perifovea, in concordance with the highest density of rod photoreceptors. The high density of bi-nucleate cells in the perifovea could either reflect special requirements of the rod photoreceptor metabolism, markers of past developmental processes (closure of optic fissure) (Fleming et al., Reference Fleming, Harman and Beazley1997; Duncker et al., Reference Duncker, Greenberg, Sparrow, Smith, Quigley and Delori2012), or other currently unknown mechanisms. Our data is consistent with recent studies of human RPE bisretinoid content (Ablonczy et al., Reference Ablonczy, Higbee, Anderson, Dahrouj, Grey, Gutierrez, Koutalos, Schey, Hanneken and Crouch2013) demonstrating a distinct spatial organization of this epithelium, which should be incorporated in models of cellular health and disease.
Significance of multi-nucleation: Still under discussion
In mammals, the majority of cells are diploid with one cell nucleus. Only a few tissues in the human body contain polyploid multi-nucleate cells, i.e., multiple chromosome sets. These include heart (cardiomyocytes) (Walsh et al., Reference Walsh, Ponten, Fleischmann and Jovinge2010), liver (hepatocytes) (Celton-Morizur et al., Reference Celton-Morizur, Merlen, Couton, Margall-Ducos and Desdouets2009), and bones (osteoblasts), with the definite significance of these cells still unknown. There are at least two possible mechanisms for polyploidy: cell fusion, which leads to a bi-nucleate cell with two diploid genomes, and cell cycle mechanisms, including atypical DNA replication, dissolving sister-chromatid cohesion, mitotic spindle function, and cytokinesis (Storchova & Pellman, Reference Storchova and Pellman2004). It remains unclear whether cellular multi-nucleation and polyploidy presented in one cell is a physiological or pathological process.
Multi-nucleation results in a reduced surface-to-cytoplasmic volume ratio for the whole cell, thereby minimizing membrane requirements (Comai, Reference Comai2005) and maintaining critical nucleus:cytoplasm ratio (Bodenstein & Sidman, Reference Bodenstein and Sidman1987). Furthermore, it has been proposed that polyploidization might increase the metabolic capacity of a tissue by “focusing on gene duplication and protein synthesis instead of cell division and membrane synthesis” (Joubès & Chevalier, Reference Joubès, Chevalier and Inzé2000; Lacroix & Maddox, Reference Lacroix and Maddox2012). Polyploidization increases the transcriptional and translational output of the same set of gene products which are required for a cell type-specific function (Pandit et al., Reference Pandit, Westendorp and de Bruin2013). In this context it is unclear whether polyploidization is causation or association, but it can also lead cell physiology toward specific and more effective functions, as seen in macrophages (Vignery, Reference Vignery2000; Reference Vignery2005), myoblast (Abmayr & Pavlath, Reference Abmayr and Pavlath2012), and osteoclasts (Teitelbaum & Ross, Reference Teitelbaum and Ross2003).
Polyploidization might be a consequence of normal aging and cellular stress, like in hepatocytes in the human liver after age 50 (Kudryavtsev et al., Reference Kudryavtsev, Kudryavtseva, Sakuta and Stein1993). The comparison of bi-nucleate RPE in two age groups in the current study did not reveal any significant differences; however, earlier changes in the immediate postnatal phase or within the first decades of life cannot be excluded. Feeney reported a significant increase of deposition of autofluorescence lipofuscin granules in the second decade, which might lead to increased metabolic stress and, as a reaction, to polyploidization. Metabolic rate and stress might be especially high at the perifoveal region (highest increase of lipofuscin/melanolipofuscin with age) (Ach et al., Reference Ach, Huisingh, McGwin, Messinger, Zhang, Bentley, Gutierrez, Ablonczy, Smith, Sloan and Curcio2014).
The distribution of incident light, often invoked as a mechanism behind topographic differences in the retina, is fairly even across the fundus out to 50 deg of eccentricity and thus does not explain variation within the 6 mm diameter macula (21 deg of vision) (Kooijman, Reference Kooijman1983; Pflibsen et al., Reference Pflibsen, Pomerantzeff and Ross1988; Bone et al., Reference Bone, Gibert and Mukherjee2012).
In general, RPE cells are believed to be postmitotic nondividing cells (Ts'o & Friedman, Reference Ts'o and Friedman1968; Robb, Reference Robb1985). However, Rappaport et al. reported the presence of occasional 3H-thymidine-labeled RPE cells in monkeys up to 204 postnatal days, which might indicate that a source of additional cells in the mature retina is mitoses within the RPE itself (Rapaport et al., Reference Rapaport, Rakic, Yasamura and LaVail1995).
Strengths and weaknesses of this study
The strength of our study is the unbiased sampling method, previously used for imaging autofluorescence and cell density in RPE flatmounts. Z-stack imaging allowed us to reliably determine the nonautofluorescent cell nuclei within the vast majority of RPE cells. Future studies will use nucleic acid markers (e.g., 4′,6-diamidin-2-phenylindol) to increase sample size and enhance detection of multinucleate RPE cells, Ki67 immunohistochemistry, and BrdU labeling to confirm cell cycle activity, and transmission electron microscopy to check chromatin structure in polyploid cells. As RPE imaging with cellular resolution continues to develop (Scoles et al., Reference Scoles, Sulai, Langlo, Fishman, Curcio, Carroll and Dubra2014) it is possible that more longitudinal data on multinucleate cells will become available.
Conclusion
In conclusion, we have demonstrated for the first time that multi-nucleate RPE cells show a characteristic distribution pattern within the macula. Their near-absence in the fovea may reflect the specialized needs of foveal cones in sustaining high-acuity vision, while the high frequency of multi-nucleate RPE cells at the perifovea might reflect specific requirements of retinal metabolism, markers of past developmental processes, and other mechanisms to be explored in further studies.
Competing interests
None of the authors has any potential conflict to report.
Supplementary Data
Supplemental materials can be viewed in this issue of Visual Neuroscience by visiting http://journals.cambridge.org/VNS.
Acknowledgments
The authors thank Kristen M. Hammack for her assistance with the custom FIJI plugin. This study was supported by grants from the German Research Foundation DFG (Bonn, Germany) #AC265/1-1 and #AC265/2-1 (both TA), National Institutes of Health (Bethesda, Maryland, USA) Grants R01 EY06109 (CAC), R01 EY015520 (RTS), EY019065 (ZA), Research to Prevent Blindness (CAC, ZA; New York, New York, USA), EyeSight Foundation of Alabama (CAC; Birmingham, Alabama, USA).