Implications
The effects of feed restriction on the intermediate metabolism of breeds of rabbits selected for meat production induce an increase over non-selected rabbits on the efficiency of metabolic systems responsible for the homeostasis with reflection on the glycemia maintenance levels and on the excretion process of protein catabolism products. According to our results, seasonal draft periods inducing food restriction might not impair the use of highly productive breeds in upgrading animal production. Further studies are necessary regarding these metabolic pathways, including integrated genomic, transcriptomic and metabolomic approaches leading to results with practical consequences that are specifically required to upgrade livestock production in areas submitted to seasonal feedstuff shortage.
Introduction
The livestock sector is responsible for, respectively, over half of the agricultural output in the developed world and about a quarter in developing countries, which affects the relevance of animal production in agricultural growth in these economies. Understanding the responsible gene pool for the enhancement of this production is a relevant component of this challenge, since transgenesis appears to be an attractive method to improve animal production. It has been shown that the ability to retain energy and protein has a relevant relationship with the activity of metabolic enzymes and hormonal profiles. In fact, there is overwhelming evidence that exposure to different nutritional conditions (below standard requirements and ad libitum) leads to changes in the activity of metabolic enzymes and hormones in mammals (McDowell, Reference McDowell1972; Williamson and Payne, Reference Williamson and Payne1980; Collins-Lusweti, Reference Collins-Lusweti2000). These changes may be due to the expression of different genes as shown by Li et al. (Reference Li, Zhang, Liu, Qiao, Zhao, Shao, Xiao, Chen, Chen and Song2006). Genes for lipogenesis, glycolysis and glucose aerobic oxidation were decreased in response to starvation in rats. The aim of this study is to investigate whether two breeds of rabbits representing different lines of genetic selection toward meat production presented differences in the activity and transcription level of regulatory enzymes of the intermediate metabolism, hormonal profile and body composition when subjected to approximately the same level of food restriction. The rabbit breeds used in this experiment were Oryctolagus cuniculus algirus, a wild rabbit (WR) breed and Oryctolagus cuniculus cuniculus (New Zealand (NR) rabbit), a highly meat selected breed.
Food restriction is the main experimental condition in our study. The metabolic stress induced through this diet profile enhances the differences in protein and energy metabolism and saving mechanisms involved in body growth within the experimental animals. Thus, relevant enzyme and hormonal conditions resulting from genetic selection seeking increased meat productivity are highlighted.
Material and methods
Animals and tissues
Both the European Union (European Legislation no. 86/609/CEE) and Portuguese regulations and guidelines on care, use and handling of laboratory animal experimentation were followed. The experiment was monitored by competent veterinary authorities and approved by the Scientific Council of the Faculty of Veterinary Medicine (Lisboa, Portugal). The authors S. van Harten and L. A. Cardoso are holders of a Federation of European Laboratory Animal Science Associations grade C certificate, which enables them to design and conduct laboratory animal experimentation in the European Union.
Two breeds of male rabbits were purchased from registered breeders at an age of 8 weeks. The New Zealand white (O. c. cuniculus) and the Iberian WR (O. c. algirus) genotypes were used. The latter refers to rabbits that descend from wild caught animals, kept in captivity and generally used for the repopulation of reserves. After an adaptation period of 21 days, all animals were considered apt for use in the trial. Each breed was randomly divided into three weight-matched groups New Zealand control (NZC; n = 11), restricted (NZR; n = 10) and a baseline group (n = 11), wild rabbit control (WRC; n = 10), restricted (WRR; n = 9) and a baseline group (n = 10). The control groups were fed ad libitum, and the restricted groups were gradually underfed until their weight was approximately 80% of their initial weight, 30 days later, achieved with a 40% reduction of their ad libitum daily ration in the NZR and 60% reduction of their ad libitum daily ration in the WRR. This level of reduction was chosen to simulate a frequent and possible metabolic effort, such as that shown in animals subjected to food restriction due to draft seasonal periods. Food consumption was recorded on a daily basis. The average individual feed intake of the four experimental groups was as follows 190.78 ± 28.5 g (NZC), 76.40 ± 5.7 g (NZR), 63.13 ± 4.7 g (WRC) and 38.41 ± 2.0 g (WRR). The baseline groups were fed ad libitum, but were killed at the beginning of the experiment. All experimental animals were fed on standard rabbit commercial pellets (Biona 701, Saprogal, Vila Chã de Ourique, Portugal) with the following composition 14.9% crude protein (CP), 2.7% crude fat, 14% crude fiber and 13% ash. Animals were kept in individual cages with environmental enrichment and allowed free access to water. All experimental animal groups were killed after 30 days, when restricted fed animals’ live weight decrease to 20% of the initial weight was attained. Experimental animals were anesthetized with 4% isoflurane and killed (IsoFlo; Veterinaria Esteve, Bologna, Italy). Liver samples were collected, snap-frozen in liquid nitrogen and stored at −80°C for further analysis. The eviscerated carcasses were cleaned and ‘dressed’ (decapitation, amputation at the tibiotarsal, radio-cubit-carpal and sacro-coccigenal joints) and stored at −20°C for further processing. The plasma and serum obtained from the animals under anesthesia were separated by centrifugation at 2300×g (4°C) for 15 min using a Hettich Universal 32R centrifuge (Andreas Hettich GmbH & Co., Tuttlingen, Germany), and stored in aliquots at −20°C until hormone analysis.
The frozen carcasses were sliced by means of an electric tape saw (Mercurio d’Oro 71, SO 1650 INOX, TBS srl, Bologna, Italy). Liofilization was made on a liofilizer Edwards-Minifast 1700 (Edwards High Vacuum International, West Sussex, UK). The nitrogen contents of the carcasses were analyzed in duplicate by the micro-Kjeldahl technique using a Buchii digestion distillation apparatus.
Carcasses crude energy was also determined in duplicate (Bomb calorimeter Parr – 1216, Parr Instrument Company, Moline, IL, USA). Fat was determined by subtracting the values of humidity, protein and ash from the carcass fresh weight, as described by Carter et al. (Reference Carter, Dang, Faas and Lynch1991).
Enzyme assays
All enzyme assays were processed on cellular fractions obtained by differential centrifugation of liver homogenate (Tanaka et al., Reference Tanaka, Inoue, Takeguchi, Washizu, Bonkobara and Arai2005) with the exception of glycogen phosphorylase (GP), which was determined directly from liver homogenate. Hexokinase (HK), phosphofructokinase (PFK) and pyruvate kinase (PK) activities were determined in the cytosol and glutamate dehydrogenase (GDH) activity was determined in the mitochondria. All fractions were stored at −80°C and all the activities were determined in duplicate. HK activity (EC 2.7.1.1) was determined spectrophotometrically at 340 nm by a coupled assay system based on a method by Easterby and O’Brien (Reference Easterby and O’Brien1973) with the following modifications: in a 3.11 ml reaction mix, the final concentrations were 50 mM Tris-HCl (pH 7.6), 8.0 mM D-glucose, 9.6 mM ATP, 19 mM magnesium chloride, 0.1 mM β-NADP and 5 units glucose-6-phosphate dehydrogenase. The reaction started with the addition of 100 μl of the sample to the cuvette, which was mixed by inversion and then monitored at 1-min intervals for 5 min at 30°C. The blank was prepared with glucose solution instead of the sample. PFK (EC 2.7.1.11) was assayed spectrophotometrically at 340 nm by a coupled assay system based on a modification of the method described by Massey and Deal (Reference Massey and Deal1973). The determination of PFK activity was effectuated in a reaction mixture with a final volume of 3.0 ml that contained 50 mM Tris-HCl (pH 8.0), 1 mM dl-Dithiothreitol, 2 mM Adenosine 5′-Triphosphate, 0.2 mM β-nicotinamide adenine dinucleotide, reduced form, 5 mM magnesium chloride, 2 units aldolase, 1 unit α-glycerophosphate dehydrogenase, 8 units triosephosphate isomerase, 4 mM fructose 6-phosphate and 50 μl of sample. The reaction started with the addition of 4 mM fructose 6-phosphate to the sample cuvette, which was mixed by inversion and then monitored at 1-min intervals for 5 min at 30°C. The blank was prepared without the sample. PK (EC 2.7.1.40) enzyme activity was assayed spectrophotometrically at 340 nm by a coupled assay system based on a method by Cardenas and Dyson (Reference Cardenas and Dyson1973). In a 3.00 ml reaction mix, the final concentrations were 38 mM potassium phosphate (pH 7.6), 0.43 mM phosphoenolpyruvate (PEP), 0.2 mM β-NADH, 6.7 mM magnesium sulfate, 1.3 mM ADP, 20 units lactic dehydrogenase and 1 mM fructose 1.6-diphosphate. The reaction started with the addition of 100 μl of the sample to the cuvette, which was mixed by inversion and then monitored at 1-min intervals for 5 min at 37°C. The blank was prepared without the sample. GDH (EC 1.4.1.3) was assayed spectrophotometrically at 334 nm based on a method by Schmidt and Schmidt (Reference Schmidt and Schmidt1984). The activity of glycogen phosphorylase was determined spectrophotometrically at 660 nm by a modified method by Hers (Reference Hers1959) and Fiske and Subbarow (Reference Fiske and Subbarow1925). A portion (50 μl) of homogenate (1/200 liver with water) was incubated for 40 min at 37°C with an equal volume of a solution (pH 6.1) containing 0.1 M glucose-1-phosphate, 2% glycogen, 0.003 M adenosine monophosphate and 0.2 M NaF. The reaction was stopped by the addition of 500 μl of ice-cold 1.0 M tricloroacetic acid followed by 2.2 ml of ice-cold water. The mixture was centrifuged for 10 min at 2500×g and 0.25 ml of molybdate reagent and 0.10 ml of aminonaphtolsulfonic acid (0.25%) were added to 2.15 ml of the supernatant for the determination of phosphate. The reaction was developed during 10 min in the dark and the samples were read at 660 nm.
All enzyme activities were expressed as U/mg protein. To calculate the specific activity of the enzymes, protein concentration was determined in each cellular fraction (mitochondria and cytosol) according to the Bradford method (Bradford, Reference Bradford1976).
Determination of metabolite concentrations
All the samples were assayed in duplicate to determine metabolite levels using spectrophotometrical protocols. Glucose was determined in plasma using an enzymatic-colorimetric kit (Spinreact S.A., Sant Esteve de Bas (Gi), Spain) following the protocols provided by the manufacturers. Liver Glucose 1-phosphate (G1P) levels were assessed spectrophotometrically at 340 nm using the method of Bergmeyer (Reference Bergmeyer1984). Glycogen dosage was assayed with a modification of van Handel (Reference Van Handel1965). To each of the sample (5 mg) tubes were added 1 ml potassium hydroxide (33%) and placed in boiling water for 15 min. The glycogen present in liver samples was precipitated by adding 2 ml of 96% ethanol with Na2SO4 (saturated solution) as a coprecipitant, cooled in an ice-bath for 30 min, centrifugated at 3000×g for 10 min and the supernatants were discarded. A 0.5 ml volume of distilled water and 1 ml of 96% ethanol were added, and the samples were cooled in an ice-bath for 30 min, centrifugated at 3000×g for 10 min and the supernatants discarded. The sediment was then incubated for 20 min at 90°C with a fresh solution of 15% anthrone in diluted sulfuric acid (72%) and measured spectrophotometrically at 620 nm. Blood glucose 6-phosphate (G6P) and fructose 6-phosphate (F6P) levels were assessed spectrophotometrically at 340 nm using the method of Michal (Reference Michal1984b). Fructose 1.6-biphosphate (FBP) was measured using an assay system described by Michal (Reference Michal1984a). Liver PEP and pyruvate (Pyr) levels were assessed spectrophotometrically at 339 nm using the method of Lamprecht and Heinz (Reference Lamprecht and Heinz1984). Liver Oxaloacetate (OA) levels were assessed spectrophotometrically at 339 nm using the method of Rej (Reference Rej1984). OA was measured in a 3.005 ml assay mixture containing 100 mM Tris buffer (pH 7.8), 6.7 mM EDTA, 0.27 mM NADH, 2.0 ml sample deproteinized extract and 380 U/l LDH. The change in absorbance was measured after the addition of the latter. The absorbance was read at room temperature after the development of the reaction (5 min). Non-esterified fatty acids (NEFA) were determined in serum using an enzymatic-colorimetric kit (Wako Chemicals GmbH, Neuss, Germany) following the protocols provided by the manufacturers. Triacylglycerols (TGA) were determined in plasma using an enzymatic-colorimetric kit (Spinreact S.A., Sant Esteve de Bas) following the protocols provided by the manufacturers.
Hormone profile determination
Serum insulin and plasma cortisol and triiodothyronine (T3) concentrations were determined by solid-phase radioimmunoassay using commercial kits of insulin, cortisol and T3 labeled with the isotope I125 (Coat-A-Count, Diagnostic Product Corporation, Los Angeles, CA, USA) following the protocols provided by the manufacturers. All samples were assayed in duplicate. Plasma insulin-like growth factor-1 (IGF-1) concentrations were determined by enzyme-linked immunosorbent assay using a commercial quantitative immunoassay kit (Biocode Hycel, Liége, Belgium) following the protocols provided by the manufacturers. All samples were assayed in duplicate. Intraassay CV was 3.54% for insulin, 2.86% for cortisol, 2.40% for T3 and 7.90% for IGF-1.
Regulatory enzyme gene transcription quantification
RNA extraction and cDNA synthesis
Total RNA was isolated from liver tissue samples (15 to 30 mg) using RNAspin Mini kit (GE Healthcare UK Limited, Buckinghamshire, England) following the protocols provided by the manufacturers. Concentration and purity of the RNA were determined spectrophotometrically (Beckman DU68, Beckman Instruments, Inc. Fullerton, CA, USA) at 260 and 280 nm. RNA integrity was assessed by 28S and 18S rRNA band visualization after gel (agarose 1.5%) electrophoresis and ethidium bromide staining. First-strand cDNA synthesis was carried out by reverse transcription using the Cloned AMV Reverse Transcriptase enzyme (Invitrogen Corporation, California, USA). cDNA was obtained by mixing 500 ng of total RNA with oligo dT primers (500 ng/μl), random hexamers (500 ng/μl) and deoxynucleotide triphosphate (10 mM). The mixture was incubated during 5 min at 70°C and the rest of the components were added (cDNA synthesis buffer, DTT, RNase OUT and Cloned AMV RT), according to the manufacturer’s instructions, to a final 100 μl reaction volume. This step was followed by incubation during 60 min at 37°C, 15 min at 42°C and 5 min at 94°C. cDNA samples were stored at −20°C until real-time (RT) PCR amplification.
Degenerate primers
Degenerate primers for carbomoyl synthase (CPSI) were designed on the basis of published sequences at Genebank (http://www.ncbi.nlm.nih.gov). CPSI primers [F-5′-CCCG(G/T)CTCCCAATGAA(C/T)AA-3′; R-5′- CCCG((G/T)CTCCCAATGAA(C/T)AA-3′] were synthesized by STABVIDA (ITQB, Oeiras, Portugal). The predicted amplicon size was 348 bp. PCR amplification was carried out on a GeneAmp PCR System 9700 (Applied Biosystem Inc., Foster City, CA, USA) with the following conditions: 92°C for 2 min; 35 cycles of 92°C for 15 s, 50°C for 20 s, 68°C for 45 s and a final extension at 68°C for 5 min. Reaction products were analyzed by electrophoresis on 1.5% agarose gel stained with ethidium bromide, purified with high pure PCR product purification kit (Roche Diagnostic GmbH, Mannheim, Germany) and sequencing was performed by STABVIDA (ITQB).
RT-PCR primers
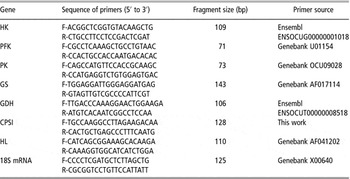
RT-PCR oligonucleotide primers used for amplifying HK, PFK, PK, glutamate synthase (GS), hepatic lipase (HL), GDH and 18S RNA genes were designed based on the sequences available in the NCBI database (http://www.ncbi.nlm.nih.gov/sites/entrez) using Primer3 Software and confirmed by Primer Express® Software (Applied Biosystem Inc.) to avoid the formation of self- and heterodimers, hairpins and self-complementarity (Table 1). To avoid and detect genomic DNA amplification, primers were designed in two different exons. Amplification products were analyzed by qualitative RT-PCR and run on 2.0% agarose gel to confirm specificity, followed by sequencing performed by STABVIDA (ITQB). RT-PCR with SYBR Green detection was used to evaluate relative mRNA amounts of the genes studied. Reference gene candidates were selected from among those well known in the literature as commonly constitutively expressed genes in similar conditions of our experiment (liver and food restriction). In our work, 18S RNA was used as the endogenous housekeeping gene that allowed normalization of the target transcripts, after experimenting with other genes (cyclophilin and β-actin) and verifying that 18S RNA gene expression was the only one that was unaffected by experimental conditions (P > 0.05).
Sequences of primers, fragment sizes and primer sources

HK = hexokinase; PFK = phosphofructokinase; PK = pyruvate kinase; GS = glycogen synthase; GDH = glutamate dehydrogenase; CPSI = carbamoyl phosphate synthase; HL = hepatic lipase.
–RT-PCR conditions
RT-PCR reactions were performed in a total 25 μl reaction volume containing a 12.5 μl of Power SYBR® Green PCR Master Mix (Applied Biosystem Inc.), 2 μl of cDNA and 100 nM of each primer. All samples were applied in duplicate on a 96-well optical reaction plate (Applied Biosystem Inc.) on ABI Prism® 7300 SDS (Applied Biosystem Inc.). The reaction was initially heated during 10 min of pre-incubation at 95°C, followed by 40 two-temperature cycles (15 s at 95°C and 1 min at 60°C). After PCR, melting curves were acquired (15 s at 95°C, 30 s at 60°C and 15 s at 95°C) to ensure that a single product was amplified in the reaction. For the housekeeping quantification we used diluted cDNA (1 : 1000). Primer concentrations were previously optimized to determine the minimum primer concentrations giving the lowest cycle threshold (Ct), assuring non-specific amplification.
Results analysis
PCR Miner (Zhao and Fernald, Reference Zhao and Fernald2005) was used to calculate the reaction efficiencies and cycle thresholds from the fluorescence readings of individual wells during the reaction (http://www.miner.ewindup.info/).
Statistics
Statistical differences among groups were analyzed by two-factorial ANOVA 2 × 2 (two breeds v. two conditions). The level of significance was set at P < 0.05. Whenever a significant difference was detected, a post hoc comparison test (LSD test) was performed. Whenever only one condition was reunited, a one-way ANOVA was performed, comparing the results separately (STATISTICA, StatSoft, Inc., 2004, version 7, Tulsa, OK, USA).
Results
Live weight loss
Table 2 refers to the initial and final live weight of all the experimental groups, as well as growth and the relative evolution of live weight and feed/gain ratio from the control groups.
Growth and evolution of rabbit live weight

NZC = New Zealand white control; NZR = New Zealand white restricted; WRC = wild rabbit control; WRR = wild rabbit restricted; LW = live weight; BLNZ = base line of the New Zealand group; BLWR = base line of the wild rabbit group.
Values are means ± s.e.m. Within a row, means without a common superscript differ (P < 0.05).
NZR animals lost 757.54 g (17.7% decrease relative to the beginning of the experiment) and WRR animals lost 182.08 g (21.07% decrease relative to the beginning of the experiment). Live weights at day 30 were significantly different between both groups.
Carcass composition
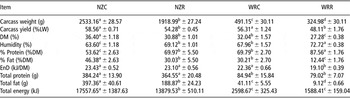
Table 3 refers to the carcass composition of the experimental groups. The NZ breed-restricted feed group revealed a decrease in the carcasses’ fresh weight (24.24%), carcass yield (7.3%), dry matter (15.2%), % fat (35.2%), total fat (52.5%) and total energy (22.6%) when compared to the control group. Humidity (8.7%) and % protein (30.5%) showed an increase (P < 0.05) and energy density and total protein of the carcass revealed no effect of the experimental treatment. The WR breed-restricted group also showed a statistically significant decrease in the carcasses’ fresh weight (33.8%), carcass yield (14.6%), dry matter (14.9%), % fat (58.8%), total fat (77.8%) and energy density (14.6%) of the carcass toward the control group. Parameters with a significant increase were the expected CP (25.46%), due to decrease in fat percentage, and the percentage of humidity (6.5). Total protein, total fat and total energy suffered no significant differences (P > 0.05).
Carcass composition

NZC = New Zealand white control; NZR = New Zealand white restricted; WRC = wild rabbit control; WRR = wild rabbit restricted; LW = live weight; EnD = energy density; DM = dry matter.
Values are means ± s.e.m. Within a row, means without a common superscript differ (P < 0.05).
Energy/protein losses
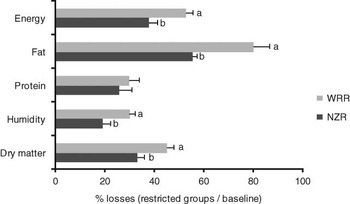
The energy and protein losses of the restricted groups are represented in Figure 1.
Energy/protein losses of the food-restricted groups. Within a row, means without a common superscript differ (P < 0.05). NZR = New Zealand white restricted. WRR = wild rabbit restricted.

These values were estimated based on the results of energy and protein of the baseline groups, in order to obtain the composition of the carcass of the experimental animals before the food restriction period.
The WR suffered more with the same diet restriction than did the NZ breed, as shown by the values of dry matter, humidity, fat and energy (P < 0.05). Only the protein content was similar to the NZ rabbits.
Hepatic metabolite levels
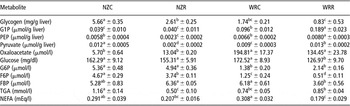
Table 4 summarizes the metabolite levels obtained for the experimental groups. The NZR group showed a significant decrease in the glycogen (53.9%), F6P (19.9%), Pyr (80.6%) and triglycerides (56.9%) relative to the NZC group. All other metabolites (G1P, glucose, G6P, FBP, PEP, OA and NEFA) showed no differences in this experimental group (P>0.05). The analysis of the WR group revealed a significant decrease in the glucose (26.4%), F6P (59.2%), FBP (41.7%), OA (31.0%) and NEFA levels (41.9%) and increases in G1P (97.1%), PEP (246.1%) and Pyr (14.2%) in the animals subjected to food restriction. Glycogen, G6P and triacylglycerols did not reveal any differences.
Metabolite levels in liver and plasma

NZC = New Zealand white control; NZR = New Zealand white restricted; WRC = wild rabbit control; WRR = wild rabbit restricted; G1P = glucose-1-phosphate; G6P = glucose-6-phosphate; F6P = fructose-6-phosphate; FBP = fructose-1.6-biphosphate; PEP = phosphoenolpyruvate; TGA = triacylcycerols; NEFA = non-esterified fatty acids.
Values are means ± s.e.m. Within a row, means without a common superscript differ (P < 0.05).
Enzyme activity
Table 5 represents the activity of part of the enzymes studied (HK, PFK, PK, GDH and GP). The NZR group suffered a decrease in the activity of PK (54.4%) and an increase in the activity of GDH (243.6%) and GP (106.7%) when compared to their control group. The WRR group showed a decrease in HK (60.3%) and GDH (73.6%) activities and an increase in the activity of GP (171.0%).
Enzyme specific activity in liver (U/mg protein)

NZC = New Zealand white control; NZR = New Zealand white restricted; WRC = wild rabbit control; WRR = wild rabbit restricted; HK = hexokinase; PFK = phosphofructokinase; PK = pyruvate kinase; GDH = glutamate dehydrogenase; GP = glycogen phosphorylase.
Values are means ± s.e.m. Within a row, means without a common superscript differ (P < 0.05).
Quantification of gene transcription
Nucleotide sequence accession numbers
The partial sequences recovered from this study have been placed in the GenBank database with accession numbers EU520487 (CPSI).
Relative gene transcription
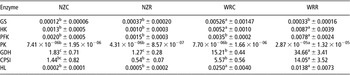
Table 6 shows the values for the gene transcription of the regulatory enzymes. The NZ breed-restricted feed group showed no significant differences over controls in the mRNA level of the studied enzymes.
Quantification of mRNA transcription by real-time PCR, relative mRNA level of each enzyme

NZC = New Zealand white control; NZR = New Zealand white restricted; WRC = wild rabbit control; WRR = wild rabbit restricted; GS = glycogen synthase; HK = hexokinase; PFK = phosphofructokinase; PK = pyruvate kinase; GDH = glutamate dehydrogenase; CPSI = carbamoyl phosphate synthase; HL = hepatic lipase.
Values are means ± s.e.m. Within a row, means without a common superscript differ (P < 0.05).
On the other hand, the WRR group revealed a decrease over controls in the transcription of GS (16-fold), and a transcription increase over controls of PFK (2.23-fold), PK (3.73-fold), GDH (2.28 fold) and CPSI (2.52-fold).
Hormone blood levels
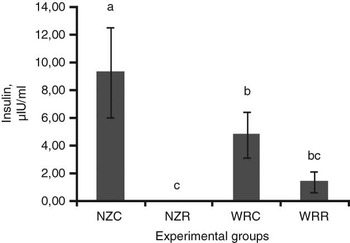
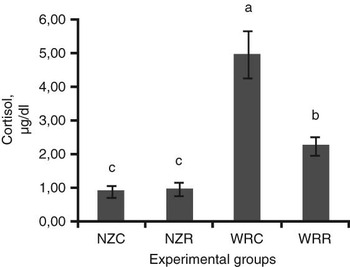
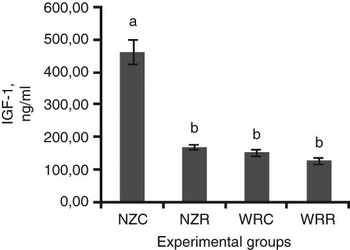
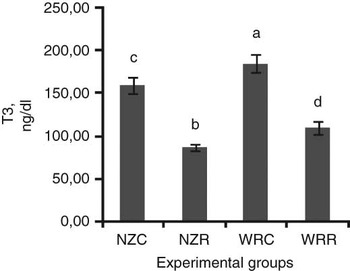
The insulin levels can be seen in Figure 2, which depicts the undetectable levels of insulin in the NZR group and no statistical differences in the results of the WR breed. Figure 3 reveals the levels of cortisol obtained for the experimental groups. No significant differences were detected in the NZ breed and in the WR group a significant decrease (54.7%) could be observed when the animals were subjected to food restriction. Figure 4 shows a significant decrease of IGF-1 in the NZR group caused by food restriction (63.4%). In the WR group, no significant differences were observed concerning this hormone. T3 levels were reduced in both of the restricted groups (Figure 5), with the NZR presenting a decrease of 45.4% and WRR of 41.3%.
Serum insulin (μI/U per ml) levels in New Zealand rabbits and wild rabbits; values are expressed as mean ± s.e.m. Bars with different letters differ significantly (P < 0.05). NZC = New Zealand white control. NZR = New Zealand white restricted. WRC = wild rabbit control. WRR = wild rabbit restricted.

Plasma cortisol (μg/dl) levels in New Zealand rabbits and Wild rabbits; Values are expressed as mean ± s.e.m. Bars with different letters differ significantly (P < 0.05). NZC = New Zealand white control. NZR = New Zealand white restricted. WRC = wild rabbit control. WRR = wild rabbit restricted.

IGF-1 (ng/ml) levels in New Zealand rabbits and wild rabbits. Values are expressed as mean ± s.e.m. Bars with different letters differ significantly (P < 0.05). NZC = New Zealand white control. NZR = New Zealand white restricted. WRC = wild rabbit control. WRR = wild rabbit restricted.

Plasma T3 (ng/dl) levels in New Zealand and Wild rabbits. Values are expressed as mean ± s.e.m. Bars with different letters differ significantly (P < 0.05). NZC = New Zealand white control. NZR = New Zealand white restricted. WRC = wild rabbit control. WRR = wild rabbit restricted. T3 = Triiodothyronine.

Discussion
Live weights, carcass composition and energy/protein losses
With 40% reduction of their ad libitum daily ration in the NZ and 60% in the WR breeds, the animals suffered, respectively, 17.7% and 21.1% in weight reductions. They presented different responses regarding the carcass composition. Food restriction induced, in the WR, increased reduction in the carcass fresh weight, carcass yield, percentage of fat and energy density than in the NZ breed. Total fat changes decreased as expected in both the restricted food groups. Percentage of fat suffered a major reduction (58.8%), which is consistent with the lipids being the first energy source to be mobilized (Hornick et al., Reference Hornick, Van Eenaeme, Gérard, Dufrasne and Istasse2000). The fact that the carcass yield presented a higher reduction in the WR (over NZR) can be explained by the higher fat depletion experienced by these animals, in line with the higher energy density reduction in the WR breed. Percentage of protein suffered a major increase in the NZR rabbits over controls, explained by the diminution of percentage of fat and subsequently by the raise in the carcass protein fraction. The results concerning energy and protein changes reflect the higher fat losses suffered by the WR breed over controls, with those animals showing greater losses in all the parameters excluding the percentage of protein content.
Effect of feed restriction on NZ rabbits concerning enzyme gene expression and activity and hormone levels
Among the enzyme activities studied, hexokinase did not present any statistical difference in the NZR animals. One possible explanation for our results in the NZ experimental group might be related to the fact that, according to our study, the glucose level was maintained constant in the food-restricted animals with no need for an increase in catabolizing glucose. This fact is corroborated with the level of G6P that also did not change with food restriction and with the increase in glucose-6-phosphatase activity. In addition, the activity of GP in our work suffered an increase in the NZR animals, and therefore glycogen was depleted, which agrees with the food-restricted condition and with a possible explanation for the maintenance of glucose levels. Hexokinase did not suffer any influence of food restriction in the NZ breed groups regarding its transcriptional level. Although the HK mRNA level was not changed due to food restriction, this enzyme can present a reduced mRNA when subjected to starvation (Pilkis and Claus, Reference Pilkis and Claus1991), due to transcription inhibition by glucagon when glucose production is required.
PFK, another key enzyme in glycolysis, did not suffer any influence of food restriction in its activity and in its transcriptional level in the NZ breed. In these animals, although F6P concentration decreased in the restricted group, the enzyme and its product (FBP) did not exhibit any effect of food restriction. Our results regarding the enzyme mRNA level in the NZ rabbits agree with a study effectuated in rats, in which no difference was detected when animals were subjected to starvation (Hotta et al., Reference Hotta, Nakajima, Yamasaki, Hamaguchi, Kuwajima, Noguchi, Tanaka, Kono and Tarui1991). Other authors detected an mRNA reduction of 14% in calorie-restricted mice (Dhahbi et al., Reference Dhahbi, Mote, Wingo, Tillman, Walford and Spindler1999), suggesting a decreased enzymatic capacity for glycolysis. Our enzyme activity results agree with Ugochukwu and Figgers (Reference Ugochukwu and Figgers2006) working on restricted diet rats who noticed the same results regarding this enzyme (no alteration). However, a contradictory result was observed by Hagopian et al. (Reference Hagopian, Ramsey and Weindruch2003) in calorie-restricted mice, whose enzyme activity revealed a decrease of 14% in young animals and 27% in old mice.
PK activity was decreased in the NZ-restricted group, as was Pyr concentration. These results are consistent with a study that reported the influence of caloric restriction on the activity of PK (Hagopian et al., Reference Hagopian, Ramsey and Weindruch2003). These authors showed a significant decrease in its activity (27% and 37%) verified, respectively, in young mice (subjected to 1 month of caloric restriction – -60% of ad libitum intake) and in old mice (subjected to 28 months of caloric restriction with the same daily caloric intake). The NZR PK activity results were also corroborated by a study in fish that were starved during 18 days, in which PK activity significantly decreased (Meton et al., Reference Meton, Fernandez and Baanante2003). PK revealed no influence of food restriction on its mRNA level in the NZ breed. This result does not agree with Dhahbi et al. (Reference Dhahbi, Mote, Wingo, Tillman, Walford and Spindler1999), since these authors noticed a decrease in the transcriptional level of PK (42%) in calorie-restricted rats.
Food restriction did not affect the mRNA level of GS in the NZ breed. In the NZ breed, G1P did not change its level in both diet groups; however, glycogen level suffered a decrease in our NZ-restricted animals. Nur et al. (Reference Nur, Sela, Webster and Madar1995) noticed similar results concerning the glycogen synthase mRNA level and glycogen concentrations in the liver of starved rats.
The NZ breed did not reveal any difference between the restricted and the control group regarding the GDH transcriptional level. The activity of GDH in the NZ group suffered an increase when subjected to food restriction. This can be explained by the fact that mammalian GDH is regulated allosterically by diverse compounds, such as purine nucleotides (ADP, NADH and GTP), and these are shown to influence the enzyme’s activity rate as GDH is stimulated by ADP and inhibited by GTP, NADH and ATP. The oxidative deamination of glutamate by GDH induces the availability of the reduced coenzymes NADH or NADPH used in the synthesis of ATP, as can be observed in situations of energy shortage such as food restriction (Plaitakis and Zaganas, Reference Plaitakis and Zaganas2001).
CPSI mRNA results were similar to the GDH values, that is, the NZ breed was unaffected by our experimental condition.
HL did not suffer any influence of food restriction on its mRNA level in this experimental breed, which agrees with Oku et al. (Reference Oku, Koizumi, Okumura, Kobayashi and Umino2006) who worked with fasted fish that showed no influence of fasting on the expression of HL in the hepatopancreas. Even though HL did not present any change in this breed, triacylglycerol level did decrease in the plasma of the restricted NZ animals over controls.
The cortisol results did not suffer any significant differences in the NZ breed. They were not increased in the NZR group, indicating that energy resources from protein catabolism induced by this hormone were not utilized. In fact, Pyr (one of the entrances of amino acids into the energy cycle) was decreased in the NZR rabbits.
The NZ breed presented a decrease in the insulin levels reaching values beyond the detection level in the restricted group (<1.2 μl/U per ml).
The T3 levels suffered a decrease in the restricted groups of the NZ breed. These results are in agreement with a study performed on sheep that underwent a long-term feed restriction (Rhind et al., Reference Rhind, McMillen, Duff, Kyle and Wright2000) and with a study on restricted rabbits (Rommers et al., Reference Rommers, Boiti, Brecchia, Meijerhof, Noordhuizen, Decuypere and Kemp2004). Our results are in accordance with the effect of T3, which is directly related to the metabolic rate, which in cases of severe stress presents a decrease, as occurred in our study. Lower concentrations of T3 allow the organism to spare energy by decreasing basal metabolism (Hornick et al., Reference Hornick, Van Eenaeme, Gérard, Dufrasne and Istasse2000).
IGF-1 presented a significant decrease in the NZ breed when the animals were subjected to food restriction. The NZ results are consistent with a study made with restricted chickens (Dewil et al., Reference Dewil, Darras, Spencer, Lauterio and Decuypere1999). Our result regarding the NZR group agrees with the fact that this hormone is an important growth factor involved in cell proliferation and metabolism, and so its decrease is in concordance with a situation of food restriction and consequently with a diminution in muscle production. The high growth potential of the NZ rabbits is consistent with the IGF-1 levels of this breed control group.
Effect of feed restriction on WRs concerning enzyme gene expression and activity and hormone levels
Hexokinase activity showed a decrease in the WR-restricted group. The latter is consistent with a study that reported the influence of caloric restriction on the activity of HK (Hagopian et al., Reference Hagopian, Ramsey and Weindruch2003), in which significant decreases (28% and 54%) were verified in young and old mice (subjected to 1 and 28 months of caloric restriction – 60% of ad libitum intake, respectively). In fish, similar results were obtained when the animals were deprived of food during 14 days (Kirchner et al., Reference Kirchner, Seixas, Kaushik and Panserat2005). Our WR breeds’ HK activity results are consistent with the decrease in glucose levels shown by WRR. In the WR breed, the glucose level is decreased in the restricted group, indicating a food deprivation status with glucose and HK depression, maintaining G6P levels. Other researchers have noticed the same results regarding this enzyme’s mRNA level (Dhahbi et al., Reference Dhahbi, Mote, Wingo, Tillman, Walford and Spindler1999). Most of the studies involving starvation or fasting refer to a decrease in the mRNA level of HK (Caseras et al., Reference Caseras, Metón, Fernández and Baanante2000; Dhahbi et al., Reference Dhahbi, Mote, Wingo, Rowley, Cao, Walford and Spindler2001; Kirchner et al., Reference Kirchner, Seixas, Kaushik and Panserat2005; Soengas et al., Reference Soengas, Polakof, Chen, Sangiao-Alvarellos and Moon2006). We would like to highlight that HK transcriptional levels in the WRR group do not match with its activity results, which are depressed.
However, the PFK mRNA level increased in these restricted animals with no consequences in the enzyme activity, which did not change in the food-restricted wild group. There seems to be a tendency for the maintenance in the WR of this enzyme activity (PFK). F6P in the WRR decreased at a higher rate than the NZR, in line with the reduced amount of available glucose.
The WR-restricted group did not present any differences in the activity of PK over the control group, even though PEP (its substrate) and Pyr were increased with food restriction. This result is in conformity with several studies effectuated in fasted fish (Kirchner et al., Reference Kirchner, Seixas, Kaushik and Panserat2005; Soengas et al., Reference Soengas, Polakof, Chen, Sangiao-Alvarellos and Moon2006), in which the authors did not detect any influence of food deprivation in the activity of PK. On the other hand, Kirchner et al. (Reference Kirchner, Seixas, Kaushik and Panserat2005) revealed an increase in the mRNA level in fish subjected to food deprivation, similar to that verified by us in the WR breed. There is no consistency in the mRNA levels among several authors, finding under-restricted food, increases or decreases in these levels (Granner and Pilkis, Reference Granner and Pilkis1990).
The values of glycogen synthase decreased in the WR breed. Dhahbi et al. (Reference Dhahbi, Mote, Wingo, Tillman, Walford and Spindler1999) noticed the same results in calorie-restricted mice, that is, a decrease in the transcriptional level of GS. Although our enzymes’ mRNA level decreased in wild animals, its substrate (G1P) showed an increase and glycogen (its product) maintained the same level in both groups (restricted and control). Our values of GS in the WRR group agree with a food-restricted environment, in which no syntheses of energy resources are predominant and with low levels of glycogen in this breed, even in the ad libitum feeding system.
Our GDH mRNA level increased in the WR-restricted animals when compared to the control group. This result does not agree with the level of enzyme activity found in our work. Thus, in both experimental animal groups, the enzyme mRNA level does not agree with the results expressing its chemical activity. In the WRR group, our results show a decrease in the GDH activity, which can reflect the lack of the deamination capacity of glutamate. This can be a limiting factor in the catabolism of the amino acids and the use of proteins as energy resources.
CPSI mRNA results presented an increase when subjected to food restriction in the WR-restricted group. Calorie-restricted mice (Tillman et al., Reference Tillman, Dhahbi, Mote, Walford and Spindler1996) presented the same results (increase) and the authors referred to regarding their results suggest that calorie restriction increases protein catabolism, probably for gluconeogenesis. Since our results are in agreement with the ones concerning GDH, we can infer that the mitochondrial glutamate formed via the GDH pathway may have an important role in the formation of N-acetylglutamate, an allosteric activator of carbamoyl-phosphate synthetase-I (Nissim, Reference Nissim1999). In addition, our results regarding this enzyme are in agreement with protein catabolism pathways. However in the nitrogen metabolism of WRR, we must consider the depression in GDH activity and its limiting effects.
HL did not suffer any influence of food restriction on its mRNA level in this experimental breed. WRR animals maintained TGA levels that are consistent with the lipid depletion of these experimental animals and NEFA decreased in the restricted group. These results might be due to decreases in the activity of HL (which was not determined), which are in agreement with TGA concentrations on the restricted food group.
The WRR group showed a decrease in cortisol levels over controls. This result was not expected, since this hormone maintains critical processes at times of prolonged stress, such as undernutrition, and its major metabolic effect is stimulation of hepatic gluconeogenesis. This contradictory result might be explained with the lethargy presented by animals and caused by the weight loss imposed.
No influence of food restriction on insulin levels was detected in the WR breed. The high insulin s.e.m. are due to the fact that seven of the animals have insulin levels beyond the limit of detection (<1.2 μl/U per ml), thus leading to statistically non-significant results that correspond to clearly different physiological interpretations.
The T3 levels suffered a decrease in the restricted groups of the WR breed. As was referred in the NZ group discussion, our results are in accordance with the effect of T3, which is directly related to the metabolic rate.
IGF-1 results of the food-restricted group did not differ significantly from the ad libitum animals in the WR breed. This latter result is consistent with a study performed in long-term restricted sheep (Rhind et al., Reference Rhind, McMillen, Duff, Kyle and Wright2000).
Effect of food restriction on experimental breeds on energy and protein metabolism
The experimental conditions highlighted intermediate metabolism performances, contributing to the different productivity parameters shown between the experimental animal groups.
As showed in Table 3, the carcass total energy loss in the restricted WR breed corresponds to double (thus 200%) the loss verified in the NZ breed, a reflection of higher concentrations of glycogen, plasmatic triacylglycerols and lipids in the carcass of these animals (NZ).
Food restriction did not affect glycemia in the NZ breed as a consequence, as shown, of a higher efficiency of the enzymatic system responsible for the maintenance of this parameter in this group of rabbits.
A catabolic effort in the WR can be seen, in line with a constant activity of PK also in the WR, contrasting with the diminution of PK and Pyr in the NZ rabbits. This is coherent with diminution of energy reserves of the WR.
Deamination and excretion systems of protein catabolism products were more effective in the NZ breed. Food restriction reduced significantly the levels of free fatty acids in the WR and induced a higher lipidic depletion in these animals.
These results concerning nitrogen and lipid metabolism can explain the better performances shown by the NZ breed. According to our results, apart from insulin with a role in glycemia homeostasis, T3 and IGF-1 seem to play a particularly relevant role in the enhanced productivity of the NZ breed, T3 intervening in the energy saving mechanisms of the restricted diet animals and IGF-1 with the known protein anabolic function.
Conclusion
In conclusion, the effects of genetic selection on meat production concerning intermediate metabolism show that there is a higher homeostasis efficiency of the NZ rabbits compared to the WR, with reflection on the glycemia maintenance levels, on the accumulation of hepatic energy reserves and on the excretion process of protein catabolism products. Further work is, however, necessary regarding these metabolic pathways, including integrated genomic, transcriptomic and metabolomic approaches leading to results with practical consequences that are specifically required to upgrade livestock production in areas submitted to seasonal feedstuff shortage.
Acknowledgements
This study was supported by grant ‘SFRH/BD/4943/2001 from Fundação para a Ciência e Tecnologia (FCT), Portugal. The support of Centro Interdisciplinar de Investigação em Sanidade Animal (CIISA) and the Faculty of Veterinary Medicine of Lisboa is also acknowledged. The authors wish to thank Dr Elisabete Silva and Dr Luísa Mateus for technical assistance.