INTRODUCTION
In ruminants, urea nitrogen (N) produced by the liver and recycled to the gastrointestinal tract (GIT) provides a source of N for microbial growth and also conserves N. The extent of urea N recycled varies greatly from around 0·20 to >0·90 of urea production (Kennedy & Milligan Reference Kennedy and Milligan1980). Higher values are associated with low intakes of dietary N. Early estimates of the amount of urea N recycled to the rumen were based on relationships between plasma urea N and ruminal ammonia concentrations. These estimates were improved with the use of isotopic tracers (Kennedy & Milligan Reference Kennedy and Milligan1980).
Isotopic tracers and net flux measurements across the portal-drained viscera (PDV) and liver are two approaches used to estimate urea synthesis by the liver and urea recycled to the GIT. These approaches provide complementary information and each has benefits and limitations. Blood urea is directly transferred across GIT epithelial tissues or enters the GIT via saliva (Lapierre & Lobley Reference Lapierre and Lobley2001). With the net flux approach, direct transfer of urea N from blood is measured and the salivary contribution can be estimated by difference when urinary urea N excretion (UUE) is available (Huntington Reference Huntington1989). Improvements in a dual-labelled urea isotopic approach allow reliable estimates of complex urea N transfers across the GIT through blood and saliva and provide an indirect estimate of anabolic use of urea N. Anabolic use includes incorporation of N from urea into microbial products, including amino acids, used to support tissue anabolism as well as anabolic reactions of ammonia in the body (Lobley et al. Reference Lobley, Bremner and Zuur2000).
The equation developed by the National Research Council (NRC 1985) and adopted by the NRC (1996, 2000) estimated N recycled to the rumen based on relationships between ruminal ammonia and plasma urea N concentrations. It does not account for the amount of N that is effectively incorporated by ruminal microbes or include measured flux rates of urea N. The objective of the current paper was to develop equations to predict the amount of recycled N that is used by ruminal microbes and retained in the body. Meta-regression analysis of literature data, based on the dual-labelled urea isotopic approach, was used to derive the equations.
MATERIALS AND METHODS
Description of the database
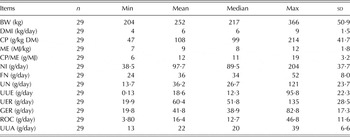
Table 1 contains data obtained from nine studies (1 = Archibeque et al. Reference Archibeque, Burns and Huntington2001; 2 = Archibeque et al. Reference Archibeque, Burns and Huntington2002; 3 = Marini & Van Amburgh Reference Marini and Van Amburgh2003; 9 = Wickersham et al. Reference Wickersham, Titgemeyer, Cochran, Wickersham and Gnad2008a ; 7 = Wickersham et al. Reference Wickersham, Titgemeyer, Cochran, Wickersham and Moore2008b ; 4 = Huntington et al. Reference Huntington, Magee, Matthews, Poore and Burns2009; 8 = Wickersham et al. Reference Wickersham, Titgemeyer, Cochran and Wickersham2009; 6 = Brake et al. Reference Brake, Titgemeyer, Jones and Anderson2010; 5 = Bailey et al. Reference Bailey, Titgemeyer, Olson, Brake, Jones and Anderson2012), in which the dual-labelled urea technique was used in growing cattle to estimate urea kinetics as described by Lobley et al. (Reference Lobley, Bremner and Zuur2000). Huntington et al. (Reference Huntington, Magee, Matthews, Poore and Burns2009) reported the values of their results adjusted for a covariate (i.e., N intake, NI); therefore, the average of the treatment means was used. Dry matter intake (DMI), metabolizable energy (ME) concentration (MJ/kg DM) and the ratio of crude protein (CP, g/kg DM) to ME concentration (CP : ME) were included in the database. The CP : ME was included to provide descriptive information; however, because it is a ratio and reflects changes in either CP or ME or both variables it was not included as an independent variable in the analyses. In studies where DMI was not reported, it was estimated from organic matter intake and reported or assumed (i.e., NRC 2000) ash concentration. Metabolizable energy concentration was estimated from NRC (2000) tabular values if it was not reported in the paper. Metabolizable energy intake (MEI) was estimated from DMI and ME concentration. Most of the diets were predominantly forage-based, but two experiments (studies 3 and 6) included several high-concentrate diets. Cattle were in positive N balance for all treatments except one (Wickersham et al. Reference Wickersham, Titgemeyer, Cochran, Wickersham and Gnad2008a ). Treatments that included infusion of energy sources or intermittent inclusion of a ruminal protein source were not included in the analysis. Since animals were in positive N balance, treatment means for which urea N entry rate (UER) exceeded NI were also excluded. The one treatment in which animals were in negative energy balance had NI (g/day) greater than UER (g N/day). Table 1 has the descriptive statistics of the database.
Descriptive statistics of the database

BW, body weight; DMI, dry matter intake; CP, crude protein; ME, metabolizable energy; NI, nitrogen intake; FN, faecal N; UN, urinary N; UUE, urinary urea N excretion; UER, urea N entry rate (urea produced in the liver); GER, gastrointestinal urea N entry rate; ROC, urea N recycled to the ornithine cycle; UUA, urea N used for anabolism (incorporated into microbial products of ammonia, such as protein that is digested, absorbed and incorporated into body protein; and mammalian products of ammonia).
Model development
Urea produced in the body, mainly in the liver, is either excreted in urine or recycled to the GIT. Urea N recycled to the GIT is hydrolysed by microbial urease, producing ammonia. The ammonia is returned to the ornithine cycle, excreted in faeces or used for anabolism. The fraction that is used for anabolism includes N from ammonia incorporated into amino acids of microbial protein that are digested, absorbed and incorporated into body protein, and anabolic reactions of ammonia in the body. Urea N used for anabolism (UUA) is calculated by difference and appropriate collection of urine and faeces are important for valid estimates of UUA. Errors associated with this method, particularly incomplete collection of urine, will result in overestimation of UUA (Lobley et al. Reference Lobley, Bremner and Zuur2000; Zuur et al. Reference Zuur, Russell, Lobley, McNamara, France and Beever2000). Excretion of 15N in the urine in forms other than urea, subsequent to recycling to the GIT, would also result in overestimation of UUA (Wickersham et al. Reference Wickersham, Titgemeyer, Cochran, Wickersham and Gnad2008a ). It is expected that this would be minor because of the low probability of incorporating 15N into other urinary products.
Equations (1) and (2) show the basic concept and variable relationships that were assumed in developing the equations to predict N metabolism and transactions into the GIT and the amount of recycled N that was used for anabolic processes (i.e., UUA) (Lobley et al. Reference Lobley, Bremner and Zuur2000).
 $$UER = UUE + GER$$
 $$GER = ROC + UFE + UUA$$
where UER is urea N entry rate (g/day); UUE is urinary urea N excretion (g/day); GER is gastrointestinal urea N entry rate (g/day); ROC is urea N recycled to the ornithine cycle (g/day); UFE is N from urea excreted in the faeces (g/day); and UUA is urea N used for anabolism (g/day).
The UFE or UUA values for some studies (Archibeque et al. Reference Archibeque, Burns and Huntington2001, Reference Archibeque, Burns and Huntington2002; Huntington et al. Reference Huntington, Magee, Matthews, Poore and Burns2009) were not available. Because the UFE to GER ratio of the complete dataset (n = 20) was 0·0925 ± 0·011, it was assumed that UFE was about 0·10 of GER and UUA was calculated as 0·9 × GER minus ROC by rearranging Eqn (2).
The UER, GER, GER : UER, UUA : GER and UUA : UER were regressed on NI, MEI and NI × MEI using meta-regression linear analysis. The NI × MEI interaction was not significant (P > 0·05) for any of these dependent variables. The N × MEI interaction term was removed from the model and the effects of NI and MEI on UER, GER, GER : UER, UUA : GER and UUA : UER were reassessed. Urea potentially available for anabolism (i.e., UUA) was estimated in two ways: (1) the relationship between UUA : UER and NI or dietary CP concentration and (2) the relationship between UUA : GER and NI or dietary CP concentration.
Statistical analyses
Linear and nonlinear regressions
Statistical analyses were conducted with R version 3.1.2 (R Core Team 2014). Graphics were generated with the ggplot2 package of R (Wickham Reference Wickham2009). Figures show study-adjusted data. The ordinary least square (OLS) linear regressions were obtained with the lm function of R (R Core Team 2014). The generalized least squares (GLS) method was used to perform the meta-regression analysis. Unfortunately, because of the limited sample size of the current dataset, the use of nonlinear mixed models was not possible; therefore, nonlinear fixed model regressions were obtained with the nls function (Bates & Chambers Reference Bates, Chambers, Chambers and Hastie1993) of R, using the Gauss–Newton algorithm and study sample size as a weight variable.
Meta-analysis with generalized least squares statistical regressions
The meta-regression analysis was obtained with random coefficient regression models, in which studies were assumed to be random effects. The study sample size was used as a weight variable for OLS and GLS methods. The parameter estimates of random coefficient regression models were obtained with the generalized linear mixed-effects regressions using the lme function of the nlme package for R (Pinheiro et al. Reference Pinheiro, Bates, DebRoy and Sarkar2014), assuming restricted maximum likelihood (REML) estimation. To determine the influence of study random effects, three variance–covariance (var–covar) matrix structures were evaluated in the following sequence: unstructured (UN) with intercept and slope estimates, variance components (VC) with intercept and slope variance estimates when their covariance estimated by the UN var–covar was not different from zero (VCis), and VC with intercept variance estimated only (VCi) when the slope variance estimate from the VCis var–covar was not different from zero. In R, the VC of the random coefficient models (i.e., study and uncontrolled random errors) was estimated using a diagonal positive-definite matrix constructor.
Variance partitioning coefficient
The fraction of the total variance associated with study (i.e., between study variation), when only the intercept was subjected to study effects, was calculated as
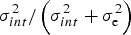 $\sigma _{int}^2 /\left( {\sigma _{int}^2 + \sigma _{\rm e}^2} \right)\; $
, in which
 $\sigma _{int}^2 $
is the intercept variance and
 $\sigma _{\rm e}^2 $
is the uncontrolled error variance. The calculation of the fraction of the total variance associated with study when the slope was subjected to study effects is more complicated because it depends on the independent variable (e.g., NI or CP in this case) (Goldstein et al.
Reference Goldstein, Browne and Rasbash2002). In this case, when the UN or VCis var–covar matrixes were used, the variance associated with study was computed as:
 $\sigma _{Study}^2 = \sigma _{int}^2 + {X^2} \times \sigma _{slope}^2 + 2 \times X \times Cov(int,slope)$
in which X is the independent variable and Cov is the covariance between the random intercept and random slope estimates that was calculated from their correlation (ρ) as
 $Cov\left( {int,slope} \right) = \rho \left( {int,slope} \right) \times \sqrt {\sigma _{int}^2 \times \sigma _{slope}^2} $
. The fraction of the total variance assigned to study was then computed as
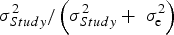 $\sigma _{Study}^2 /\left( {{\rm} \sigma _{Study}^2 + {\rm \;} \sigma _{\rm e}^2} \right)$
and because a value is obtained for each level of the independent variable (i.e., X), the minimum and maximum values were reported. Analysis of variance (ANOVA) and the corrected Akaike Information Criterion (AIC) were used to statistically compare the differences between these var–covar matrixes and to select the most adequate statistical model using the REML method. However, the maximum likelihood (ML) method was used when statistical models had different fixed effects so the corrected AICML values were used to select the most adequate statistical model.
Corrected (study adjusted) response variable
The dependent variable (i.e., response variables) corrected for study effects (Y
c) was computed as the sum of fixed effects and the residuals. A proximate coefficient of determination (
 $\tilde r_{\rm c}^2 $
) for Y
c was obtained by regressing Y
c on the independent variable using the lm function of R (R Core Team 2014).
RESULTS
Prediction of urea nitrogen entry rate and gastrointestinal urea nitrogen entry rate
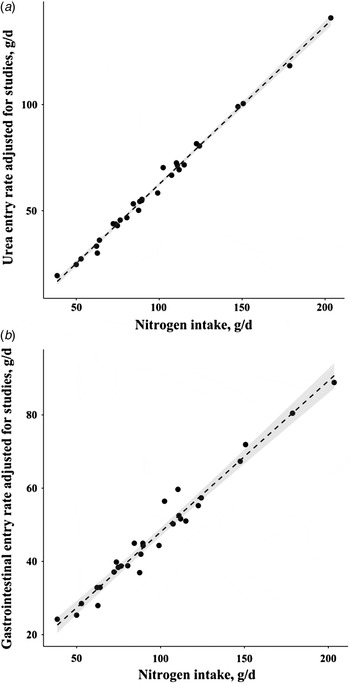
The GLS regression of UER on NI and MEI indicated that MEI (P = 0·41) was not important in explaining UER (g/day). Similarly, MEI (P = 0·23) did not explain a significant portion of GER. Figure 1 depicts the relationship between UER and NI (panel (a)) or GER and NI (panel (b)) for the complete database (i.e., all studies). There was a stronger linear relationship between study-adjusted UER and NI than study-adjusted GER and NI. Considerable variation existed among studies and NI accounted for only 0·20 of the total variation in GER using OLS regression (GER = 20·4 + 0·21 × NI; r
2 = 0·198). The study-adjusted GLS regression was GER = 6·72 + 0·413 × NI;
 $\tilde r_{\rm c}^2 $
= 0·969). Because of a more clearly defined relationship between UER and NI, no further analysis was performed for the regression of GER and NI.
Relationship between (a) urea N entry rate (UER, g N/day) or (b) gastrointestinal urea N entry rate (GER, g N/day) adjusted for study effects v. N intake (NI, g/day). Equations are (a) UER = 0·745 × NI − 11·98 and (b) GER = 6·72 + 0·413 × NI. The dashed lines represent the linear regression and the shaded areas represent the 95% confidence interval of the linear regression.

The OLS regression between UER and NI indicated that for each increment in NI, about 0·70 appeared as UER. The meta-regression analyses between UER and NI indicated that the UN var–covar matrix had significantly better fitting than VCis (P = 0·011) and VCi (P = 0·003) var–covar matrixes. Thus, a random intercept model using the UN var–covar structure for the random factor (i.e., study) was selected and Eqn (3) has the fixed effect solution. The
 $\tilde r_{\rm c}^2 $
was 0·994 and the root of mean square error (RMSE) (i.e., residual standard error; RSE) was 4·64 g/day. The study effects were responsible for 0·82 (ranging from 0·77 to 0·95) of the total variance.
 $$UER = 0 {\cdot} 745 \times NI - 11 {\cdot} 98$$
where UER (g/day); and NI (g/day).
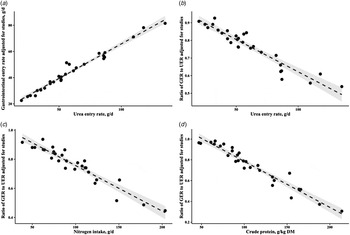
An important issue for ruminant animals is, which portion of the urea N produced by the liver is recycled into the GIT and used for anabolism. Figure 2 has the relationship between study-adjusted GER and UER as well as the study-adjusted ratio of GER to UER v. UER (g N/day), NI (g/day) or CP (g/kg DM). The ANOVA for the linear v. quadratic meta-regressions of GER on UER was not significant (P = 0·34); hence the linear form was used to compare UN and VC var–covar matrixes. The UN var–covar was different (P = 0·0013) from VC var–covar matrices and was selected for further analysis. Equation (4) has the solution for the fixed effects (
 $\tilde r_{\rm c}^2 $
of 0·971 and RMSE of 5·75 g/day), while study accounted for 0·55 (0·07–0·96) of the total variance. In contrast, for GER : UER against UER, the UN and VCis var–covar matrixes were not different (P = 0·64), but VCis had better fitting statistics (P = 0·0012) than VCi and, therefore, VCis was used to obtain the parameter estimates. Equation (5) has the solution for the fixed effects of the linear meta-regression of GER : UER on UER (
 $\tilde r_{\rm c}^2 $
of 0·887 and RMSE of 0·0825).
 $$GER = 12 {\cdot} 76 + 0 {\cdot} 5298 \times UER$$
 $$GER:UER = 0 {\cdot} 989 - 0 {\cdot} 00369 \times UER$$
where GER (g/day); and UER (g/day).
Relationship between (a) gastrointestinal urea N entry rate (GER, g N/day) adjusted for study effects and urea N entry rate (UER, g N/day); (b) GER to UER ratio adjusted for study effects v. UER; (c) GER to UER ratio adjusted for study effects v. NI (g/day) and (d) GER to UER ratio adjusted for study effects v. CP (g/kg DM). Equations are (a) GER = 12·76 + 0·5298 × UER, (b) GER : UER = 0·989 − 0·00369 × UER, (c) GER : UER = 1·066 − 0·00311 × NI and (d) GER : UER = 1·228 − 0·00444 × CP. The dashed lines represent the linear regression and the shaded areas represent the 95% confidence interval of the linear regression.

Figure 2(a) and Eqn (4) suggested that on average 0·53 of the UER was recycled in the GIT, but this was not constant (Fig. 2(b) and Eqn (5)). As UER increased, the GER : UER decreased at approximately 0·37% per increment of UER. This dependency of the proportion of N being recycled to the GIT to the UER is because of the significant intercept in Eqn (4) that increases the GER : UER ratio at lower levels of UER and decreases the GER : UER ratio at higher levels of UER. The GLS regression of GER : UER on NI (P < 0·001) and MEI (P = 0·004) indicated that these two variables had opposing effects. Increased NI decreased the portion of UER that enters the GIT, whereas increasing MEI increased the portion of UER that enters the GIT although study variation was quite large.
For the regression between GER : UER and NI, the fitting statistics of the VCis var–covar were not different from the UN var–covar (P = 0·32), but it had better fitting statistics than the VCi (P = 0·004). In contrast, the VCi var–covar was the only var–covar structure that was fitted to the GER : UER v. CP meta-regression. Equation (6) has the fixed effect solution for GER : UER v. NI (
 $\tilde r_{\rm c}^2 $
of 0·892 and RMSE of 0·0896) and study accounted for 0·64 (0·41–0·87) of the total variance. Similarly, Eqn (7) yielded
 $\tilde r_{\rm c}^2 $
of 0·926, RMSE of 0·114 and study accounted for 0·08 of the total variance.
 $$GER:UER = 1 {\cdot} 066 - 0 {\cdot} 00311 \times NI$$
 $$GER:UER = 1 {\cdot} 228 - 0 {\cdot} 00444 \times CP$$
where GER (g/day); UER (g/day); NI (g/day); and CP (g/kg DM).
Prediction of usable urea nitrogen for anabolism
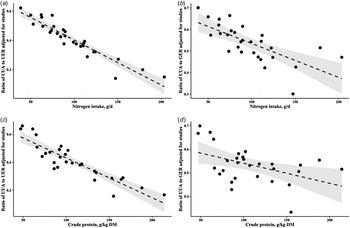
The final issue was to predict the proportion of GER that was used for anabolic purposes (UUA). Metabolizable energy intake (P = 0·87) was not significant in explaining UUA : GER. Similarly, MEI (P = 0·86) did not explain UUA : UER. Figure 3 shows the relationships between the study-adjusted ratio of UUA : UER or UUA : GER and NI or CP for all studies. The relationships for UUA : UER (panels (a) and (c) in Fig. 3) had less scatter than the relationships for UUA : GER (panels (b) and (d) in Fig. 3) regardless of the independent variable (i.e., NI or CP). Because the slope of the study-unadjusted OLS linear regression was not different from zero (P = 0·49), this suggested a constant value for UUA : GER. The average of UUA : GER in the current database is 0·54 and the average of UUA divided by the average of GER is 0·52 (Table 1). However, after study variation was accounted for through a meta-regression analysis, it was found that UUA : GER declined significantly as NI (P < 0·001) or CP (P < 0·001) increased (Figs 3(b) and (d); Eqns (8) and (9)).
Relationship between the (a) ratio of urea N used for anabolism (UUA, g N/day) to urea N entry rate (UER, g N/day) adjusted for study effects and N intake (NI, g/day); (b) ratio of UUA to gastrointestinal urea N entry rate (GER, g N/day) adjusted for study effects and NI; (c) ratio of UUA : UER adjusted for study effects and CP, g/kg DM and (d) ratio of UUA : GER adjusted for study effects and CP, g/kg DM. Equations are (a) UUA : UER = 0·709 − 0·00307 × NI, (b) UUA : GER = 0·696 − 0·00159 × NI, (c) UUA : UER = 0·7222 − 0·002895 × CP and (d) UUA : GER = 0·634 − 0·00091 × CP. The dashed lines represent the linear regression and the shaded areas represent the 95% confidence interval of the linear regression.

For the meta-regressions of UUA : GER on NI (Fig. 3(b)) or CP (Fig. 3(d)), the ANOVA between UN and VC var–covar matrixes indicated that the UN did not differ from VCis (P = 0·096) and VCis var–covar had similar fitting statistics (P = 0·05) to VCi in predicting UUA : GER from NI (Fig. 3(b)). Similarly, no difference was found between UN and VCis (P = 0·085) and VCis and VCi (P = 0·42) in predicting UUA : GER from CP (Fig. 3(d)). Thus, the VCis was used for both situations. Equation (8) had an
 $\tilde r_{\rm c}^2 $
of 0·50 and RMSE of 0·132, while Eqn (9) had an
 $\tilde r_{\rm c}^2 $
of 0·245 and RMSE of 0·145. The VCis analyses indicated that study effects accounted for 0·17 (0·03–0·46) and 0·24 (0·06–0·55) of the total variance in Eqns (8) and (9), respectively.
 $$UUA:GER = 0 {\cdot} 696 - 0 {\cdot} 00159 \times NI$$
 $$UUA:GER = 0 {\cdot} 634 - 0 {\cdot} 00091 \times CP$$
where UUA (g/day); GER (g/day); NI (g/day); and CP (g/kg DM).
Because the original (i.e., study unadjusted) data for Figs 3(b) and (d) tended to have a quadratic pattern, the ANOVA and AICML values of the linear (UUA : GER on CP) and quadratic (UUA : GER on CP and CP2) meta-regressions were compared. The ANOVA analysis indicated that there was a difference between linear and quadratic regressions (P = 0·003) and the AICML values were −44·3 and −49·5, respectively. Visually, it is likely that study #3 may have influenced this outcome. In fact, when study #3 was removed and the linear and quadratic meta-regressions were compared, the AICML values (−39·3 and −38·5, respectively) slightly favoured the linear regression. Because only one study was highly influential to the quadratic pattern, the linear meta-regression was adopted and study #3 was kept; additional data points are needed at higher NI to confirm the linear or quadratic pattern. Based on Eqn (9), for a diet containing 70 g CP/kg DM (i.e., 0·07 of DM), approximately 0·57 of the GIT recycled N would be used for anabolism. Similarly, for a diet containing 130 g CP/kg DM, only 0·52 of the GIT recycled N would be UUA. There was large variation among studies (up to 0·55 depending on the CP content of the diet), especially regarding the direction of the slope of UUA : GER on CP. Because the relationships between UUA : UER and NI or CP were less variable (Figs 3(a) and (c)) than UUA : GER and NI or CP (Figs 3(b) and (d)), the UUA : UER was evaluated further.
The general pattern of the relationships of UUA : UER v. NI or UUA : UER v. CP was that the fraction of N used for anabolism for UER decreases linearly as NI (g/day) or CP (g/kg DM) increases. Because there were no differences in the fitting statistics of the meta-regression analysis using either UN or VC var–covar matrixes for UUA : UER on NI (P > 0·12) or UUA : UER on CP (g/kg DM) (P > 0·21), the simplest var–covar matrix (i.e., VCi) was adopted.
The fixed effect solution of the regression of UUA : UER on NI is shown in Eqn (10). The
 $\tilde r_{\rm c}^2 $
was 0·875, the RMSE was 0·096 and the study accounted for 0·30 of the total variance. Similarly, Eqn (11) has the solution for the fixed effects of regressing UUA : UER on CP (g/kg DM). The
 $\tilde r_{\rm c}^2 $
was 0·81, the RMSE was 0·13 and study variation was only 0·13 of the total variance. Although studies were responsible for a greater proportion of the total variance for the UUA : UER × NI meta-regression compared with the UUA : UER × CP meta-regression, their variance was 0·001765 and 0·002388, respectively. Therefore, these analyses suggested that UUA : UER regressed on NI (g/day) had slightly better fitting statistics than UUA : UER regressed on CP (g/kg DM), AICML was −66·7 and −59·3, respectively, favouring Eqn (10). However, these equations indicated that the ratio of UUA to UER would become negative for animals consuming more than approximately 230 g N/day or 250 g CP/kg DM. Although these values are extreme for the current database and practical feeding conditions, to prevent negative predictions of UUA : UER (e.g., for optimization purposes), nonlinear functions were fitted assuming the exponential decay form as it does not yield negative values. Equation (12) has the nonlinear relationship between UUA : UER and NI, with an
 $\tilde r_{\rm c}^2 $
of 0·724 and RMSE of 0·076 and Eqn (13) has the nonlinear relationship between UUA : UER and CP, with an
 $\tilde r_{\rm c}^2 $
of 0·731 and RMSE of 0·075. Analysing Eqns (12) and (13), animals consuming diets with 230 g N/day or 250 g CP/kg DM would have predicted UUA : UER of 0·15 or 0·10, respectively. The least predicted UUA : UER for Eqn (12) is 0·0988 (NI tends to infinity) and Eqn (13) is zero (CP tends to infinity) because the intercept (−0·1113) was not different from zero.
 $$UUA:UER = 0 {\cdot} 709 - 0 {\cdot} 00307 \times NI$$
 $$UUA:UER = 0 {\cdot} 7222 - 0 {\cdot} 002895 \times CP$$
 $$UUA:UER = 0 {\cdot} 0988 + 0 {\cdot} 92 \times Exp( - 0 {\cdot} 0124 \times NI)$$
 $$UUA:UER = - 0 {\cdot} 1113 + 0 {\cdot} 996 \times Exp( - 0 {\cdot} 00616 \times CP)$$
where UUA (g/day); UER (g/day); NI (g/day); CP (g/kg DM); and Exp is the exponential function.
Reynolds & Kristensen (Reference Reynolds and Kristensen2008) also developed nonlinear equations to predict UUA : UER from CP (g/kg DM). Their equation, however, was based on the logarithm of dietary CP content: UUA : UER = 1·161 − 0·329 × Ln(CP/10).
Equations (12), (13) and the equation developed by Reynolds & Kristensen (Reference Reynolds and Kristensen2008) (above) can be re-arranged to predict UUA directly, if they are multiplied by their respective equation that predicts UER, resulting in Eqns (14)–(16), respectively. Additionally, the equation developed by the NRC (1985) and adopted by the NRC (1996; 2000) is shown in Eqn (17). A mechanistic approach was adopted in combining these equations to show their intended relationships and UUA was computed by grouping them and solving for UUA. One could have empirically developed UUA regression from NI or CP. Preliminary analysis indicated no additional improvements in using the empirical approach over the mechanistic one, thence, the mechanistic approach was retained.
 $$\eqalign{UU{A_{NI}} &= \left[ {0 {\cdot} 0988 + 0 {\cdot} 92 \times Exp( - 0 {\cdot} 0124 \times NI)} \right] \cr & \quad\times \left[ {0 {\cdot} 745 \times NI - 11 {\cdot} 98} \right]}$$
 $$\eqalign{UU{A_{CP}} &= \left[ { - 0 {\cdot} 1113 + 0 {\cdot} 996 \times Exp( - 0 {\cdot} 00616 \times CP)} \right] \cr & \quad\times \left[ {0 {\cdot} 745 \times NI - 11 {\cdot} 98}\right]}$$
 $$\eqalign{UU{A_{RK}} & = \left[ {1 {\cdot} 161 - 0 {\cdot} 329 \times Ln(CP/10)} \right] \cr & \quad \times \left[ {0 {\cdot} 7 \times NI - 13 {\cdot} 74} \right]}$$
 $$\eqalign{U{R_{NRC}} & = \big[ \big( 121 {\cdot} 7 - 1 {\cdot} 201 \times CP + 0 {\cdot} 003235 \cr & \quad\times C{P^2} \big)/100 \big] \times NI}$$
 $$NI = \left( {CP/1000/6 {\cdot} 25} \right) \times DMI \times 1000$$
where Exp is the exponential function; UUA (g/day); NI (g/day); CP (g/kg DM); UR is urea N recycled to the rumen (g/day); and DMI (kg/day).
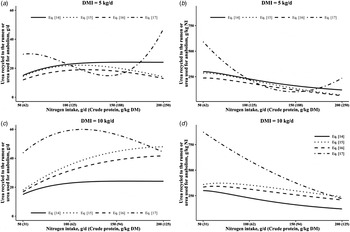
Figure 4 has the predicted UUA or UR (g/day and g/kg NI) v. NI (g/day) using Eqns (14)–(17). Two intake levels are shown that approximate the upper and lower DMI in the data set. Note that because of the different DMI (5 and 10 kg/day) the CP concentration varies and this is also shown on the X-axes. The NI was identical for both simulations (i.e., 5 and 10 kg/day) and varied from 50 to 200 g/day. Identical patterns were obtained when plotting UUA against NI, g/day at both DMI. Equations (15) and (16) yielded similar patterns, but different absolute values, for both 5 and 10 kg of DM/day. Equation (14) systematically predicted more UUA than Eqns (15) and (16) for lower DMI (i.e., 5 kg/day) and less UUA than Eqns (15) and (16) for greater DMI (i.e., 10 kg/day). The equation developed from Reynolds & Kristensen (Reference Reynolds and Kristensen2008) (Eqn (16)), and Eqn (15) had a quadratic behaviour for the interval of 50–200 g NI/day when predicting UUA, g/day, for low DMI, whereas Eqn (14) tended to maintain a more constant predicted UUA at higher NI for low (Fig. 4(a)) or high (Fig. 4(c)) DMI. The equation developed by the NRC (1985) (Eqn (17)) had inconsistent prediction patterns and a peculiar pattern for the low DMI scenario. The description of this equation suggested it predicted urea N recycled to the rumen. Equations (15) and (16) were developed from dietary CP content whereas Eqn (14) was based on N flux (i.e., NI, g/day). Therefore, for the same NI, Eqn (14) will predict the same amount of UUA (g/day) although the dietary CP content varies.
Relationship between urea N used for anabolism (UUA) or urea N recycled to the rumen (panels (a) and (c) as g/day or panels (b) and (d) as g/kg N intake) and N intake, g/day (dietary CP, g/kg DM) using the following Eqn (14) (UUA, solid line, UUA NI = [0·0988 + 0·92 × Exp( − 0·0124 × NI)] × [0·745 × NI − 11·98]); (15) (UUA, dotted line, UUA CP = [ − 0·1113 + 0·996 × Exp( −0·00616 × CP)] × [0·745 × NI − 11·98]); Eqn developed by Reynolds & Kristensen (Reference Reynolds and Kristensen2008) (16) (UUA, dashed line, UUA RK = [1·161 − 0·329 × Ln(CP/10)] × [0·7 × NI − 13·74]); and the NRC (1985) Eqn (17) (urea N recycled to the rumen, dash-dot line, UR NRC = [(121·7 − 1·201 × CP + 0·003235 × CP 2)/100] × NI) for two DMI (5 and 10 kg/day).

DISCUSSION
Estimates of urea N flux in the current analysis confirmed the quantitative significance of urea N in overall N use by ruminants. The meta-regression analysis, after removing study variation, indicated that on average the best unbiased estimate of the proportion of NI that is associated with an increase in UER is 0·75 (Eqn (3)). A similar value (0·70) was obtained by Reynolds & Kristensen (Reference Reynolds and Kristensen2008) as their equation was UER = 0·7 × NI − 13·74. Their equation did not take into account study variation and yet provided a similar value to the current meta-regression, likely because of the similar pattern across studies. An estimate of urea production by the liver, based on net hepatic flux measurements in cattle, also showed the large portion of NI that is associated with urea synthesis. Hepatic urea N synthesis, g N/day, was 0·91 × NI − 32 (Lapierre & Lobley Reference Lapierre and Lobley2001). The net flux analysis did not include any of the studies used in the current analysis.
Results of a meta-analysis (Martineau et al. Reference Martineau, Sauvant, Ouellet, Côrtes, Vernet, Ortigues-Marty and Lapierre2011) indicated net flux of urea N to the PDV was linearly related to NI and represented 0·28 of NI for growing or finishing cattle and dairy cows. This estimate (Martineau et al. Reference Martineau, Sauvant, Ouellet, Côrtes, Vernet, Ortigues-Marty and Lapierre2011) includes urea N transferred through the wall of the GIT from the arterial circulation but does not include salivary input of urea N to the GIT. In the current meta-analysis urea N transferred to the GIT, which includes urea N transferred through the wall of the GIT and via saliva, represented 0·41 of NI. A decrease in the proportion of UER recycled to the GIT was observed previously as dietary CP concentration increased (Reynolds & Kristensen Reference Reynolds and Kristensen2008). The current analysis confirmed that GER : UER decreased as NI (g/day) or CP (g/kg DM) increased. These data support conservation of urea N by recycling a greater proportion of the urea N produced at low NI.
Metabolizable energy intake did not influence the amount of urea N transferred to the GIT in relation to NI, but it promoted recycling of urea N relative to the UER. Based on a meta-analysis including data from growing and finishing cattle, sheep and dairy cows (Martineau et al. Reference Martineau, Sauvant, Ouellet, Côrtes, Vernet, Ortigues-Marty and Lapierre2011) few covariates influenced the effect of NI on transfer of urea N to the PDV. Energy factors, such as dietary total digestible nutrient concentration and non-fibre carbohydrate intake, promoted urea N recycling to the GIT. Neutral detergent fibre (NDF) intake promoted recycling but had a quadratic relationship. These observations (Martineau et al. Reference Martineau, Sauvant, Ouellet, Côrtes, Vernet, Ortigues-Marty and Lapierre2011) relate only to transfer of urea N through the PDV wall. Because factors in addition to NI affect urea N recycling, changes in dietary energy or NDF in addition to NI confound the response to NI.
The portion of UER used for anabolic purposes (i.e., UUA) decreased as NI or CP increased, similar to the observations of Reynolds & Kristensen (Reference Reynolds and Kristensen2008). The portion of the GER that is used for anabolic purposes has been suggested previously to be approximately 0·50 (Lapierre & Lobley Reference Lapierre and Lobley2001) and 0·54 (Reynolds & Kristensen Reference Reynolds and Kristensen2008). In contrast with previously published analyses, the current results suggested that both UUA : UER and UUA : GER decline as NI or CP (g/kg DM) increases and a constant fraction of UUA : GER cannot be used for growing cattle. The current findings suggest that as NI (g/day) or CP (g/kg DM) increased, proportionately less recycled N was used for anabolism. Increasing NI would increase N available in the rumen and dilute recycled N. Conversely, animals fed low-protein diets recycle more N proportionally, suggesting an inherent ability of ruminant animals to salvage N during periods of short supply (i.e., low N diets).
Because there was no data set similar to the one used for equation development, the potential to extrapolate the current equations beyond the development data set was evaluated using data from dairy cows fed a mixed forage and concentrate diet (Ouellet et al. Reference Ouellet, Berthiaume, Holtrop, Lobley, Martineau and Lapierre2010), in which N kinetics were evaluated and UUA was estimated to be 57 g/day. Equation (14) under-predicted UUA (28 g/day) by 0·52, whereas Eqns (15)–(17) over-predicted UUA (87, 76 and 77 g/day) by 0·53, 0·34 and 0·36, respectively. These estimates emphasize the need for more studies at greater DMI and with diets containing more concentrate.
Evaluation of the equations used for simulation showed that Eqn (14) had consistent prediction patterns at both DMI. Equation (15) had consistent prediction patterns when compared with Eqn (16) for both DMI scenarios. Because Eqn (15) was developed using meta-regression analysis, the unbiased parameter estimates are expected to yield more likely predictions of true UUA. It is therefore recommended for future use with growing cattle diets. The portion of UER used for anabolism decreased as NI increased. In contrast, at greater NI the absolute amount of UUA was predicted to show a slight increase. Intake and fermentable energy supply limit microbial growth at low DMI. Once the requirement for fermentation has been reached, any additional urea N from GER will be hydrolysed, absorbed as ammonia and returned to the ornithine cycle. Increased DMI may provide more fermentable substrate in the rumen and increase microbial growth and consequently allow greater UUA (g/day) at the same NI. At the same time, increasing NI also increases dietary rumen degradable protein (RDP) which increases the rumen N pool and therefore, N available for microbial growth. Microbes that ferment structural carbohydrate use either ammonia or amino acids as a N source although the proportion of microbial N derived from ammonia is greater than that of amino acids; and use of amino acids is greater than peptides (Atasoglu et al. Reference Atasoglu, Newbold and Wallace2001). Microbes that ferment non-structural carbohydrate use either ammonia or peptides and amino acids as a N source (Russell et al. Reference Russell, O'Connor, Fox, Van Soest and Sniffen1992). The RDP would provide additional N sources. The fact that UUA is around 0·50–0·54 of GER in the current analysis, as well as others, suggests a limit to use was reached, perhaps related to energy supply for bacterial growth and the total RDP supply (Kennedy & Milligan Reference Kennedy and Milligan1980). Increasing RDP supply would dilute recycled N and decrease the probability that a given N molecule would be used by microbes. In addition, UUA estimates microbial protein that is digested, absorbed and incorporated into body protein; and anabolic reactions of ammonia in the body. A limit to use could reflect the capacity for protein anabolism.
Some concerns remain regarding the development of equations to predict UUA. An advantage to the approach used in the studies in the current database is that UUA can be estimated from GER and ROC. However, UUA is estimated by difference and is subject to cumulative errors. Additionally, the GIT is considered as a single compartment and only urea N that enters the rumen or small intestine will lead to anabolic metabolites that can be absorbed and used by the animal. Faecal urea N was estimated to correct GER for urea N transferred to the large intestine and incorporated into microbial N, but this microbial N from GER could originate anywhere in the GIT. Ammonia produced in the large intestine would contribute to ROC. Both microbial products of ammonia, such as amino acids and mammalian products of ammonia, such as those produced by amination reactions, contribute to UUA by the animal. Other reactions in the body could contribute to overestimation of UUA; however, the probability of incorporation of 15N-amino acids or ammonia v. 14N compounds is not known (Lobley et al. Reference Lobley, Bremner and Zuur2000).
Bacterial N derived from urea has been estimated from ruminal bacterial 15N enrichment and estimated bacterial N yield. Studies that included estimates of both UUA, as described here, and bacterial N derived from urea N show variable agreement. In some cases, they were similar (Wickersham et al. Reference Wickersham, Titgemeyer, Cochran, Wickersham and Gnad2008a , Reference Wickersham, Titgemeyer, Cochran and Wickersham2009) although UUA was greater than bacterial N from urea in some treatments and less than bacterial N from urea in other treatments. In other studies, the values for UUA were greater (Ouellet et al. Reference Ouellet, Berthiaume, Holtrop, Lobley, Martineau and Lapierre2010; Bailey et al. Reference Bailey, Titgemeyer, Olson, Brake, Jones and Anderson2012) and the difference increased as NI increased (Marini & Van Amburgh Reference Marini and Van Amburgh2003). Each estimate has limitations related to methodology. In general, errors will tend to overestimate UUA as noted previously (Zuur et al. Reference Zuur, Russell, Lobley, McNamara, France and Beever2000). In addition, UUA includes post-absorptive use of metabolites.
The current data set contains most of the available information for growing cattle consuming high-forage diets. The impact of high-concentrate diets on GER, the efficiency of use of GER and therefore changing the UUA is not certain. As more fermentable substrate is available in the rumen when high-concentrate diets are fed, one could speculate that the efficiency of microbial growth increases up to a maximum and hence a larger portion of the GER is used for microbial anabolism. Increased ruminal volatile fatty acids or carbon dioxide (CO2) could promote transfer of urea N to the rumen (Abdoun et al. Reference Abdoun, Stumpff and Martens2006). Ruminal microbes might be more efficient in capturing recycled N because of faster degradation of carbohydrate and energy is not limiting. The use of recycled N would also depend on dietary NI. Implants or β-adrenergic agonists change post-absorptive use of N, increase N deposition and may alter UUA (Titgemeyer et al. Reference Titgemeyer, Spivey, Parr, Brake and Jones2012).
The proposed equation improves the previous NRC's (1985) prediction equation by incorporating subsequent data from studies in growing beef cattle in which urea N fluxes were measured. The current analysis, however, did not address factors that regulate urea N recycling. The ratio of GER to UER declined as NI increased suggesting adaptive changes in both kidney and GIT are responsible for coordinated regulation of urea N recycling and urinary N excretion. Increased ruminal ammonia N is associated with decreased GER (Harmeyer & Martens Reference Harmeyer and Martens1980; Kennedy & Milligan Reference Kennedy and Milligan1980; Abdoun et al. Reference Abdoun, Stumpff and Martens2006). Further study should refine the contribution of urea N recycling to ruminal N requirements and N metabolism under a broader array of feeding systems, incorporating a wide range of NI, to contribute to more mechanistic modelling. Optimizing the use of recycled N may contribute to increased efficiency of N use by ruminants.
The authors thank Drs Gerald Lobley and Normand St-Pierre for their helpful comments on the manuscript.