Introduction
Dental microwear is the product of a three-body wear system involving food and teeth (Pickles Reference Pickles2006). Most dental microwear studies test hypotheses about diet by focusing on how the physical characteristics of food and other ingested particles (e.g., silica dust) cause dental wear (Semprebon and Rivals Reference Semprebon and Rivals2007; Solounias et al. Reference Solounias, Rivals and Semprebon2010; Calandra et al. Reference Calandra, Schulz, Pinnow, Krohn and Kaiser2012; Desantis et al. Reference DeSantis, Schubert, Scott and Ungar2012; Ungar et al. Reference Ungar, Scott, Curran, Dunsworth, Harcourt-Smith, Lehmann, Manthi and McNulty2012; Grine et al. Reference Grine, Ungar, Teaford and El-Zaatari2013; Tütken et al. Reference Tütken, Kaiser, Vennemann and Merceron2013; Rivals et al. Reference Rivals, Takatsuki, Albert and Maciá2014). However, the role that consumers themselves play in the formation of microwear has not factored prominently in the discussion among workers concerned with ungulate dental microwear. Different frequencies of microwear features (pits and scratches), or surface textures resulting from these features, result from diets with different abrasive properties (e.g., browsing and grazing). However, strictly speaking, we must realize that the shapes of microwear features are partly dependent on the animal. A scratch requires translational movement where a hard particle is dragged between tooth surfaces, whereas a pitted surface requires only vertical occlusal pressure exerted on a hard particle. Therefore, microwear, in the sense that it measures frequencies of pits and scratches, or pitted and scratched landscape textures, is not purely a consequence of dietary particles. Variables intrinsic to the consuming organism that impact dental microwear are largely consequences of phylogenetic history and adaptation. Microwear is dependent upon the size and orientations of occlusal facets (morphology), dynamics of the mastication process (occlusal vectors and forces), and the mechanical properties (e.g., hardness, fracture toughness) of dental tissues relative to ingested particles (Gordon Reference Gordon1982, Reference Gordon1988; Maas Reference Maas1991, Reference Maas1994; Gügel et al. 2001; Unger et al. 2010, Ungar and Sponheimer Reference Ungar and Sponheimer2011; Campbell et al. Reference Campbell, Cuozzo, Sauther, Sponheimer and VL.2012; Constantino 2012; Koenigswald et al. 2013; Lucas et al. Reference Lucas, Omar, Al-Fadhalah, Almusallam, Henry, Michael, Thai, Watzke, Strait and Atkins2013). Also, variations in body size, digestive physiologies, behaviors, and other biological traits (Clauss et al. Reference Clauss, Frey, Kiefer, Lechner-Doll, Loehlein, Polster, Rössner and Streich2003; Clauss and Hummel Reference Clauss and Hummel2005; Clauss et al. Reference Clauss, Kaiser and Hummel2008; Duncan and Poppi Reference Duncan and Poppi2008; Searle and Shipley Reference Searle and Shipley2008) that influence diet may impact microwear.
While much work has been done to document variables among ungulates that are relevant to diet and feeding such as occlusal morphology, masticatory dynamics, and mechanical properties of dental tissues (Janis Reference Janis1979; Rensberger and Koenigswald Reference Rensberger and Koenigswald1980; Fortelius Reference Fortelius1981; Boyd and Fortelius Reference Boyde and Fortelius1986; Popowics and Fortelius Reference Popowics and Fortelius1997; Archer and Sanson Reference Archer and Sanson2002; Kaiser et al. Reference Kaiser, Fickel, Streich, Hummel and Clauss2010; Heywood Reference Heywood2010; Koenigswald et al. 1997, Reference Koenigswald, Holbrook and Rose2011, 2013; Erickson 2013; Fraser and Rybcznski Reference Fraser and Rybczynski2014), the degree to which the phylogenetic diversity of these traits effects the distribution of microwear features across a dentition is poorly understood for ungulates. Our present understanding of dental microwear and its relationship to diet in ungulates and other large herbivores is largely based on patterns observed within extant databases composed mostly of ruminant species (Solounias and Semprebon Reference Solounias and Semprebon2002; Merceron et al. Reference Merceron, Blondel, Brunet, Sen, Solounias, Viriot and Heintz2004, Reference Merceron, Bonis, Viriot and Blondel2005a) within which there is a significant statistical association between dental microwear patterns and browsing and grazing diets. Inferences of paleodiet in extinct species based on patterns observed in extant species depend upon a catholic relationship of microwear and diet across species (Semprebon et al. Reference Semprebon, Godfrey, Solounias, Sutherland and Jungers2004a; Rivals et al. Reference Rivals, Mihlbachler, Solounias, Mol, Semprebon and de Vos2010; Christensen Reference Christensen2014; Fraser and Theodor Reference Fraser and Theodor2013).
We question whether dental microwear patterns of ruminants are good models for the dental microwear of extinct ungulates and ungulate-like mammals such as Notoungulata (Townsend and Croft Reference Townsend and Croft2008; Billet et al. Reference Billet, Blondel and de Muizon2009) and other clades that exhibit diminished levels of extant diversity such as Proboscidea (Green et al. Reference Green, Semprebon and Solounias2005; Palombo et al. Reference Palombo, Filippi, Iacumin, Longinelli, Barbieri and Maras2005; Calandra et al. Reference Calandra, Göhlich and Merceron2008, Reference Calandra, Göhlich and Merceron2010; Todd et al. 2007), Camelidae (Semprebon and Rivals Reference Semprebon and Rivals2010; Rivals et al. Reference Rivals, Rindel and Belardi2013), Suina (Hunter and Fortelius Reference Hunter and Fortelius1994; Bishop et al. 2006; Schmidt Reference Schmidt2008), Hippopotamidae (Boisserie et al. Reference Boisserie, Zazzo, Merceron, Blondel, Vignaud, Likius, Mackaye and Brunet2005) and Perissodactyla. Perissodactyls are one of few non-ruminant ungulate clades with sufficient numbers of extant species and a sufficient degree of dietary diversity across the browser-grazer continuum for which dental microwear can be investigated (Owen-Smith Reference Owen-Smith1988; Prothero and Schooch Reference Prothero and Schooch2002). If microwear-diet relationships within this continuum differ between ruminants and perissodactyls, possibly as a consequence of differences between the animals rather than strictly differences in diets, it suggests that dental microwear is not a truly ‘taxon free’ method as it has been previously treated (Andrews and Hixson Reference Andrews and Hixson2014).
To minimize sources of error, most dental microwear studies sample dental microwear from a single homologous cusp, loph or wear facet. One current problem with dental microwear analysis involves the relationship of sampling sites with occlusion, the mastication cycle, and localized dental material properties. All mammals, including ungulates, have evolved a wide variety of complex occlusal patterns and sophisticated multi-phase chewing cycles (Rensberger Reference Grenet, Martin-Rosset and Chenost1984; Archer and Sanson Reference Archer and Sanson2002; Kaiser et al. Reference Kaiser, Fickel, Streich, Hummel and Clauss2010; Heywood et al. 2010, Koenigswald et al. 2013; Evans and Janis Reference Evans and Janis2014) during which different parts of teeth are subjected to wear during different occlusal vectors, velocities and pressures. Also mechanical properties of dental materials, such as hardness and fracture toughness, vary between taxa and can even vary within a single tooth within a single tissue type (e.g., enamel) (Constantino et al. Reference Constantino, Lee-Thorp, Gerbig, Hartstone-Rose, Talebi, Lawn and Lucas2012; Campbell et al. Reference Campbell, Cuozzo, Sauther, Sponheimer and VL.2012; Erickson Reference Erickson2014; Hager et al. Reference Hager, Mihlbachler and Beatty2014). Therefore, for any given type of diet, microwear can be heterogeneous, not only between species, but within a single set of dentition or even an individual tooth (Gordon Reference Gordon1982).
The great variation in mammalian masticatory apparatuses prevents complete standardization of microwear sampling sites (Christensen Reference Christensen2014), most obviously for mammals with highly autapomorphous dentitions (Green and Resar Reference Grine, Sponheimer, Lee-Thorp and Teaford2012; Fahlke et al. Reference Fahlke, Bastl, Semprebon and Gingerich2013; Strait Reference Strait2014). Even if a standardized sampling site were possible, it is doubtful that data equivalency would be guaranteed because of potential variation in occlusal patterns and masticatory dynamics. To develop expectations about what types of microwear features are likely to be formed for a particular type of feeding ecology, it is important to consider what portion of the tooth has been sampled, site-specific mechanical properties of dental tissue, and how it participates in the mastication/occlusion cycle in each taxon studied. The few dental microwear studies that simultaneously sample multiple types of wear facets in suids (Hunter and Fortelius Reference Hunter and Fortelius1994), primates (Gordon Reference Gordon1982; Merceron et al. Reference Merceron, Blondel, De Bonis, Koufos and Viriot2005b; Krueger et al. Reference Krueger, Scott, Kay and Ungar2008) and proboscideans (Palombo et al. Reference Palombo, Filippi, Iacumin, Longinelli, Barbieri and Maras2005; Todd et al. 2007; Calandra et al. Reference Calandra, Göhlich and Merceron2008), show facet-specific microwear patterns. However, for most ungulates no tests have been undertaken to determine if one part of a tooth is preferable over other possible sites from which dental microwear could be sampled, if the dental microwear from any homologous area has a constant relationship with diet across species, or if dental microwear sampled from multiple sites on a single tooth might produce heterogeneous microwear.
Most microwear studies involving ruminants sample the lingual band of enamel of the paracone (A2 in Fig. 1) (Solounias and Semprebon Reference Solounias and Semprebon2002; Rivals and Deniaux Reference Rivals and Deniaux2003; Merceron et al. Reference Merceron, Blondel, Brunet, Sen, Solounias, Viriot and Heintz2004, Reference Merceron, Bonis, Viriot and Blondel2005a, 2010a,b; Semprebon et al. Reference Semprebon, Godfrey, Solounias, Sutherland and Jungers2004a,Reference Semprebon, Janis and Solouniasb; Merceron and Ungar Reference Merceron and Ungar2005; Rivals and Solounias Reference Rivals and Solounias2007; Rivals et al. Reference Rivals, Solounias and Mihlbachler2007, Reference Rivals, Schulz and Kaiser2008, 2009, Reference Rivals, Mihlbachler, Solounias, Mol, Semprebon and de Vos2010, Reference Rivals, Solounias and Schaller2011, Reference Rivals, Rindel and Belardi2013, Reference Rivals, Takatsuki, Albert and Maciá2014; Semprebon and Rivals Reference Semprebon and Rivals2007, 2012; Ungar et al. Reference Ungar, Merceron and Scott2007; Reference Ungar, Scott, Curran, Dunsworth, Harcourt-Smith, Lehmann, Manthi and McNulty2012; DeMiguel et al. Reference DeMiguel, Fortelius, Azanza and Morales2008; Novello et al. Reference Novello, Blondel and Brunet2010; Solounias et al. Reference Solounias, Rivals and Semprebon2010; Rivals and Semprebon Reference Rivals and Semprebon2012; Scott Reference Scott2012). Dental microwear studies of equine horses (subfamily Equinae) sample the same area (A2) (Hayek et al. Reference Hayek, Bernor, Solounias and Steigerwald1992; MacFadden et al. Reference MacFadden, Solounias and Cerling1999; Solounias and Semprebon Reference Solounias and Semprebon2002; Semprebon et al. Reference Semprebon, Godfrey, Solounias, Sutherland and Jungers2004a, Reference Semprebon, Sise and Coombs2011; Schultz et al. Reference Schultz, Fahlke, Merceron and Kaiser2007; Schulz and Fahlke Reference Schultz and Fahlke2009; Rivals et al. Reference Rivals, Mihlbachler, Solounias, Mol, Semprebon and de Vos2010; Rivals et al. in press; Solounias et al. Reference Solounias, Rivals and Semprebon2010; Wolf et al. Reference Wolf, Nelson, Schwartz, Semprebon, Kaiser and Bernor2010; Rivals and Semprebon Reference Rivals and Semprebon2012; Fraser and Theodor Reference Fraser and Theodor2013; Tütken et al. Reference Tütken, Kaiser, Vennemann and Merceron2013). However standardization of the sampling area is more challenging when working with non-equine perissodactyls. There are fewer dental microwear studies on non-equine perissodactyls (rhinos, tapirs, brachydont equids, brontotheriioids, chalicotherioids). Among these, the sampling locations are unstandardized and not always completely described (Solounias and Semprebon Reference Solounias and Semprebon2002; Semprebon et al. Reference Semprebon, Godfrey, Solounias, Sutherland and Jungers2004a, Reference Semprebon, Sise and Coombs2011; Schulz et al. Reference Todd, Falco, Silva and Sanchez2007; Joomun et al. Reference Joomun, Hooker and Collinson2008; Rivals et al. Reference Rivals, Mihlbachler, Solounias, Mol, Semprebon and de Vos2010; Solounias et al. Reference Solounias, Rivals and Semprebon2010; Rivals and Semprebon Reference Rivals and Semprebon2012; Fraser and Theodor Reference Fraser and Theodor2013). Tapir molars are bilophdont; A2 is an arbitrary point along the protoloph, is not part of a discrete cusp, and is not homologous to A2 in ruminants. In rhino molars, the portion of the tooth that is positionally equivalent to A2 does not form part of the functional paracone, the localized enamel is thin and often damaged, and its role in comminution of food is probably non-homologous to that of ruminants. For similar reasons, other perissodactyl clades such as Brontotheriioidea, Chalicotherioidea and other early perissodactyls also lack a sampling area homologous to A2, either because the enamel is lost, worn away rapidly, or too thin for study (Joomun et al. Reference Joomun, Hooker and Collinson2008; Semprebon et al. Reference Semprebon, Sise and Coombs2011; Homchaudhuri et al. Reference Homchaudhuri, Mihlbachler and Solounias2010).
Occlusal areas of enamel sampled for dental microwear analysis. Areas A1, A2, and A4 represent the regions of the teeth where microwear sites were chosen. We attempted to sample A3 but were unable to collect sufficient data from that area with the present methods (see methods).

Drawing from these concerns, we investigate the degree to which phylogenetic origin influences microwear data in browsing and grazing Ruminantia and Perissodactyla, the degree of intradental heterogeneity of dental microwear in molars of these groups, and we discuss the potential effects the intrinsic differences between these two clades may have on dental microwear data and its association with browsing and grazing diets. Four basic questions are investigated: (1) How is dental microwear distributed across ruminant and perissodactyl molars? (2) Do some microwear sampling sites or combinations of sampling sites predict diet better than others? (3) To what extent does clade membership influence dental microwear data? (4) What phylogenetically linked heritable variables (e.g., occlusal complexity, enamel hardness) cause differences in dental microwear patterns between artiodactyls and perissodactyls?
Materials and Methods
Specimen selection
We selected four species from Perissodactyla and four species of Ruminantia for microwear analysis. For each group we sampled two specialized browsers and two grazers. Perissodactyls include grazers, white rhino (Ceratotherium simum) and zebra (Equus quagga), and browsers, black rhino (Diceros bicornis, browser), and tapir (Tapirus terrestris). Ruminants include browsers, moose (Alces alces) and giraffe (Giraffa camelopardalis), and grazers, bison (Bison bison) and wildebeest (Connochaetes taurinus). Specimens chosen were dental adults with well-developed wear surfaces, but not dentally senescent. We focused on large species because quality microwear data is more easily recorded from larger teeth with thicker enamel bands.
For simplicity, and to minimize ambiguity in the results, we excluded mixed feeders (diets with mixtures of graminoids and non-graminoids). The sample consists of wild collected specimens in the American Museum of Natural History Department of Mammalogy collection. We included additional wild specimens of white and black rhinos from the Smithsonian collection (Supplementary Table 1). For the remaining species we sampled up to 20 specimens, but due to high rejection rates did not always achieve the target sample size.
Only specimens that appeared to have undamaged occlusal surfaces with no obvious macroscopic signs of postmortem degradation (e.g., surface weathering) were molded (King et al. Reference King, Andrews and Boz1999; El-Zaatari Reference El-Zaatari2010). Specimens with poorly developed wear facets, due to young or old age, were not molded. Additional specimens were rejected during analysis under the microscope due to postmortem degradation of the occlusal surfaces (chemical weathering, types of mechanical damage inconsistent with dental microwear morphology, and chemical residues covering the occlusal surface). Other specimens were excluded because appropriate photographs could not be taken due to irregularities in the shape of the tooth and/or cast that undermined the required lighting regime. The entire study is comprised of 202 specimens and 493 individual microwear surfaces examined with sample sizes ranging from 14–53 individuals per taxon. These sample sizes are normal for dental microwear studies (Rivals et al. Reference Rivals, Solounias and Mihlbachler2007, Reference Rivals, Mihlbachler, Solounias, Mol, Semprebon and de Vos2010; Merceron et al. Reference Merceron, Blondel, Brunet, Sen, Solounias, Viriot and Heintz2004, Reference Merceron, Kaiser, Kostopoulos and Schultz2010; Semprebon and Rivals Reference Semprebon and Rivals2010; Desantis et al. Reference DeSantis, Schubert, Scott and Ungar2012; Ungar et al. Reference Ungar, Scott, Curran, Dunsworth, Harcourt-Smith, Lehmann, Manthi and McNulty2012; Donohue et al. Reference Donohue, DesSantis, Schubert and Ungar2013; Munzel et al. Reference Munzell, Rivals, Pacher, Doppes, Rabeder, Conard and Bocherens2013; DeMiguel et al. Reference DeMiguel, Alba and Moyá-Solá2014).
Microwear Analysis
Methods of dental microwear analysis follow Mihlbachler et al. (Reference Mihlbachler, Beatty, Caldera-Siu, Chan and Lee2012) with modifications to digital resolution following Mihlbachler and Beatty (Reference Mihlbachler and Beatty2012). A brief summary of those methods is provided here, but the reader is referred to these references for a full explanation of molding, casting, photographic methods, resolution, digital enhancements, and other manipulations made to the images. Grayscale photomicrographs of dental wear surfaces were taken from the clear epoxy casts under a stereomicroscope with an insight Spot 4 megapixel camera using light reflected from a white surface positioned below the specimen (Fig. 2). Although digital resolution and optical magnification are non-analogous, the digital resolution of the original images is roughly equivalent to 100× optical resolution, with each pixel representing 0.742 µm of tooth surface (Mihlbachler and Beatty Reference Mihlbachler and Beatty2012). The resolution of these images was artificially reduced by resampling them in Adobe Photoshop with 20% of the original pixel density. In the resampled images each pixel represents 3.702 µm of tooth surface. Mihlbachler and Beatty (Reference Mihlbachler and Beatty2012) found reproducibility of results to be greater at this resolution for large microwear features compared to both higher and lower resolutions.
Photomicrographs of dental microwear surfaces from clear epoxy casts. Each photo is a physical area of 150 μm×150 μm.
We counted the four largest of the six microwear variables of Mihlbachler et al. (Reference Mihlbachler, Beatty, Caldera-Siu, Chan and Lee2012), wide scratches (≥5 µm ≤20 µm width), very wide scratches (≥20 µm width), large pits (≥20 µm ≤50 µm maximal diameter), and very large pits (≥50 µm maximal diameter) within each 400 µm × 400 µm (106×105 µm) sampling area. Small microwear features, including narrow scratches (<5 µm width) and small pits (<20 µm maximal diameter) were ignored because observer repeatability for these features was found to be low with this methodology (Mihlbachler and Beatty Reference Mihlbachler and Beatty2012).
Microwear features were identified and traced directly on the images by superimposing standardized circles (for pits) and lines (for scratches) in Adobe Illustrator meant to represent different categories of microwear features. The images used in this study were randomly ordered and mixed in with several hundred other microwear images that were being used in another microwear study. Therefore the observer (MM) was blind to the taxon, the area of tooth being sampled, and even to what study the particular image was being used for. The entire series of images was examined three times by a single observer, saving the images each time. Evaluating the images a second and third time eliminates the diminishing effects of observer fatigue by allowing the observer to identify features that were missed in earlier passes. By the third pass, very few additional microwear features were identified (one or two per image).
Sampling areas
The right second upper molar (RM2) was preferentially sampled, but left upper M2s were sampled when the RM2 did not match our inclusion criteria. In some instances upper M1s and upper M3s were sampled for the same reason. We sampled microwear in three areas of each tooth (Fig. 1). For ruminants, areas sampled include the labial band of enamel of the paracone (A1), the lingual band of enamel of the paracone (A2), and the lingual edge of the protocone (A4). We attempted to sample the labial edge of the protocone (A3) but abandoned this approach because the enamel was often too thin, damaged, or not sufficiently flat. Homologous areas were sampled in zebra. For rhinos we were only able to sample A1 and A4 consistently. The enamel in A2 was often too thin and broken and was therefore excluded. For tapir teeth we sampled three positions along the protoloph equivalent in position to A1, A2, and A4. In instances when the tooth was incomplete or did not fully meet our inclusion criteria, we sampled the available areas. These incompletely sampled specimens were included when possible, but because of missing data, are by necessity excluded from some of the statistical tests.
Statistical analysis
Numerous statistical tests were run on various combinations of the microwear data. To simplify and reduce the number of statistical tests, the WS (wide scratches) and VSW (very wide scratches) data were combined into a single variable, TS (total scratches). Likewise, the LP (large pits) and VLP (very large pits) data were combined into a single variable, TP (total pits). A third variable, TM (total microwear), was calculated as the sum of all of the microwear features (TS+TP). The TS, TP, and TM variables were used in all statistical tests except the discriminant function analyses, where the four raw variables (WS, VWS, LP, VLP) were used (Supplementary Table 1). All statistical analyses were run in SPSS v.22.
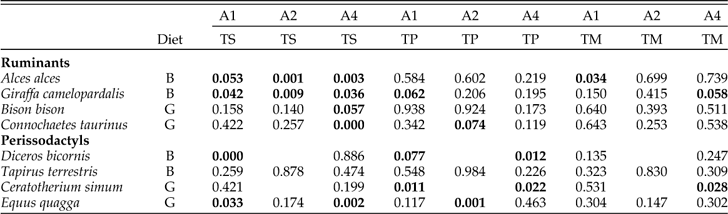
Shapiro-Wilk tests were first run to determine which statistical methods (parametric or non-parametric) were most appropriate (Table 1). The null hypothesis of the Shapiro-Wilk test is that the data are normally distributed (Hammer and Harper Reference Hammer and Harper2006). Because normal distributions are an assumption of parametric statistical methods, the Shapiro-Wilk tests are unusual in that non-rejection of the null hypothesis is the desired outcome. Therefore, for this series of analyses, Bonferroni corrections were avoided. Additionally, the alpha value of the test was raised to P=0.1. These measures increase the likelihood for significant results and decrease the probability of Type I error (accepting the null when the null is false), thereby ensuring parametric statistical methods are not chosen when they are inappropriate. Ultimately, as explained in the results, the analysis indicated that much of the data are not normally distributed, therefore non-parametric statistical methods were used in the remainder of the analysis.
P values for Shapiro Wilk Tests of normality for microwear data. Bold values indicate significant deviations from a normal distribution (P≤0.1).
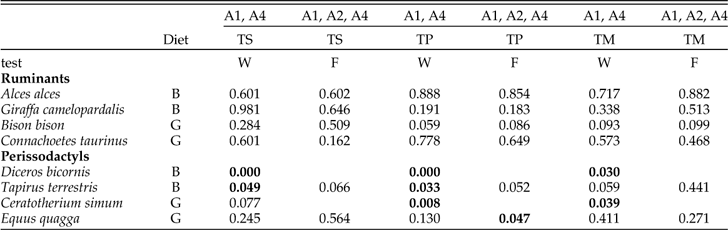
To test for intratooth differences in the frequency of scratches and the frequency of pits in different sampling areas we used two non-parametric tests. Related Samples Wilcoxon Signed Rank Test was use for tests comparing sampling areas A1 and A4. These series of tests include rhinos. Tests involving all three sampled areas (A1, A2, and A4), which excludes rhinos, uses Friedman’s Two Way Analysis of Variance by ranks (Table 2). For all of these tests, the alpha level was set at P=0.05.
P values for non-parametric tests comparing pit and scratch counts in different sampling areas using related samples Wilcoxon signed rank test (W) and Friedman’s two way analysis of variance by ranks (F). Bold values indicate a significant test (P≤0.05).
Microwear data have relatively high coefficients of variation compared to traditional morphological data and therefore statistical tests of dental microwear data are at greater risk of type II error (non-rejection of the null hypothesis when the null is actually false) when sample sizes are small. Bonferroni correction attempts to minimize type I error but at the expense of excessive risk of type II error (Perneger Reference Perneger1998). Although we report Bonferroni corrections, the discussion and conclusion draws from the uncorrected results that are reflected in all data tables. Due to the potential for error of any single test, we focus our conclusions on the distribution of significant tests among the results rather than placing emphasis on the results on any individual test.
Discriminant function analyses (DFAs) were performed to evaluate the success rate of microwear data in assigning individual teeth to browsing and grazing groups. We ran DFAs for the individual sampling areas and with multiple sampling areas combined. Because A2 was not available for rhinos, rhinos were excluded for any analysis involving A2. Secondly, DFAs were run on ruminants and perissodactyls separately. Finally, we ran a third set of DFAs to evaluate the ability of dental microwear data to predict clade membership (either Ruminantia or Perissodactyla). The final series of analyses examines the extent to which phylogenetic background influences microwear data irrespective of diet.
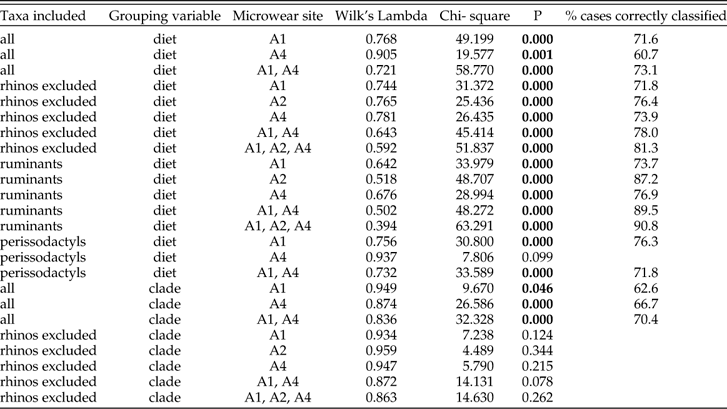
Discriminant function analyses results are reported in Table 3. Wilk’s Lambda indicates the power of the discriminant function to distinguish between the groups (either diet group or phylogenetic affinity) with lower values indicating a more powerful DFA. The chi-square statistic corresponds to Wilk’s Lambda and, if statistically significant, indicates a significant relationship between the dependent groups and the independent variables. For those DFAs with a significant Wilk’s Lambda, we report the percentage of correctly classified specimens. Although, there is not a direct relationship between Wilk’s Lambda and the accuracy of the classifications based on the discriminant functions, both are potentially good measures of the power of the DFA. Tables 4–6 provide the canonical loadings for DF1 resulting from each analysis.
Results of discriminant function analysis using the microwear data to predict both diet (browser or grazer) and clade membership (Ruminantia or Perissodacytla). Bold values indicate a significant test (P≤0.05)
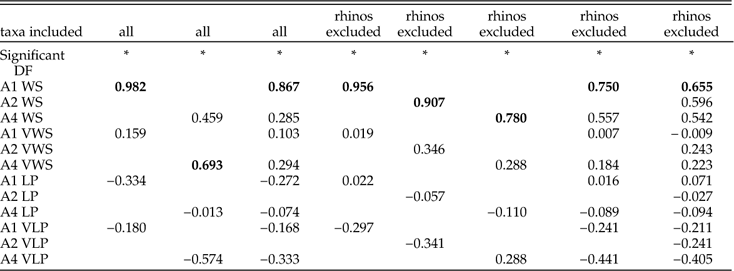
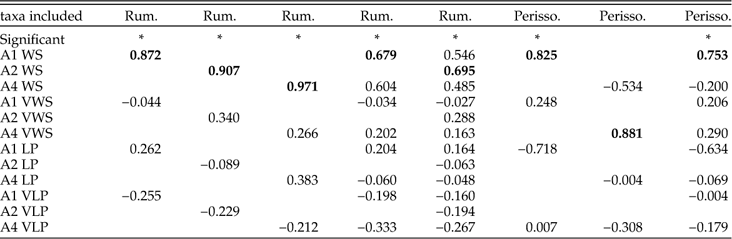
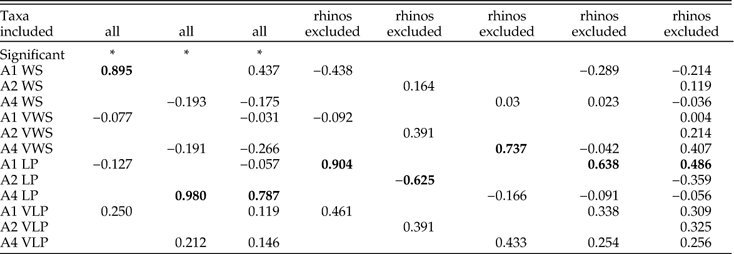
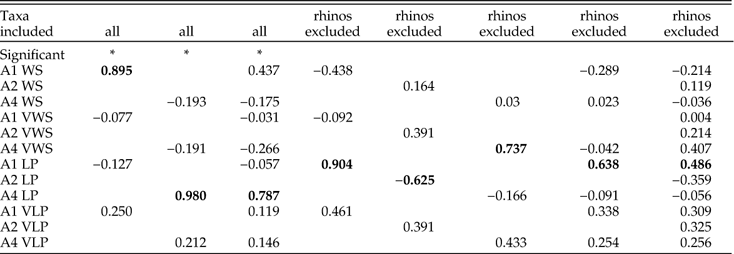
Canonical loadings for DF1 when diet is used as the grouping variable. This table includes loadings for analyses with all taxa included and for the second series of analyses with rhinos excluded. Loadings are shown for analyses on the individual sites and analyses with the sites combined. The most heavily loaded variable per analysis is indicated in bold.
Canonical loadings for DF1 when diet is used as the grouping variable. This table includes loadings for analyses treating ruminants and perissodactyls separately. Loadings are shown for analyses on the individual sites and analyses with the sites combined. The most heavily loaded variable per analysis is indicated in bold.
Canonical loadings for DF1 when clade membership is used as the grouping variable. This table includes loadings for analyses with all taxa included and with rhinos excluded. Loadings are shown for analyses on the individual sites and analyses with the sites combined. The most heavily loaded variable per analysis is indicated in bold.
Results
Shapiro-Wilk Tests
Sixty six Shapiro-Wilk tests were run to test the null hypotheses of normal distributions for the frequencies of numbers of scratches and pits in the sampled areas of all 8 species (Table 1). Twenty-one (32%) of these tests were significant, suggesting that non-normal distributions frequently occur in dental microwear data. There were non-normal distributions among scratch (TS), pit (TP), and combined (TM) variables, however more than half of the significant results (N=11 significant tests) were among the TS data, with fewer numbers of significant tests among TP (N=7) and TM data (N=3). The distribution of significant results suggests that scratch data may more often have a slightly less normal distribution in comparison to pits. Significant results were similarly distributed among artiodactyls and perissodactyls with roughly one third of the data significantly deviating from normality in both groups. Non-normal distributions may be slightly more common among browsers (N=12) than grazers (N=9).
Non-Parametric Tests
Related Samples Wilcoxon Signed Rank Test and Friedman’s Two Way Analysis of Variance tested for intratooth heterogeneity in microwear feature frequency (Table 2). All of the significant results were among perissodactyls (eight of 18 tests) with four additional tests among perissodactyls approaching significance (0.05<P<0.1). Bonferroni corrections reduced the number of significant tests to three between the two rhinos (scratches in A1 vs. A4 in Diceros and pits in A1 vs. A4 in both Ceratotherium and Diceros). None of the tests among the ruminants were significant although the majority of comparisons among Bison approached statistical significance. Figure 3 provides more insights into overall intratooth microwear heterogeneity. Mean values for different sampling areas are most widely spaced for tapir and black rhino suggesting that browsing perissodactyls have the most microwear heterogeneity. Grazing perissodactyls and ruminants of all dietary types show lesser degrees of intratooth heterogeneity.
Means and standard errors of the mean for total numbers of scratches (TS) and pits (TP).
DFAs with diet as the grouping variable
Discriminant function analyses run with all species included, using diet as the grouping variable, were significant regardless of which sampling area or combination of sampling areas were included in the analysis (Table 3). However, inclusion of both A1 and A4 into a single DFA resulted in better correct assignment of individual specimens to dietary group (73.1%) than DFAs that analyzed microwear from any single area. Exclusion of rhinos (for which the A2 data are missing) improved success rates in dietary assignment. The DFA including A1, A2, and A4 had an 81.3% correct assignment rate.
DFAs ran separately for ruminants and perissodactyls revealed that microwear is a better predictor of diet in ruminants. The single best DFA for a ruminant analysis, in which all the sampling areas were included, produced a 90.8% success rate for assignment of individual ruminant teeth to diet (Table 3). In contrast, correct assignment rates in perissodactyls were weaker overall and never higher than 76.3% (for A1). The microwear from A4 in perissodactyls did not yield a significant DFA, suggesting that microwear on the lingual side of perissodactyl teeth is not related to browsing or grazing diets.
In the vast majority of DFAs, WS had the highest canonical loadings on DF1, indicating that scratch frequency is more strongly related to diet than pit frequency (Table 4). In analyses of ruminants alone, scratch variables from all three sampling areas had much higher canonical loadings than pits (Table 5). For perissodactyl DFAs in which the results were significant, scratch frequency from the ectoloph (A1) was the only variable with high canonical loadings.
DFAs with clade membership as the grouping variable
Discriminant function analyses with clade membership used as the grouping variable produced a mixture of significant and insignificant results (Table 3). When all species were included, the DFA was significant, suggesting that clade membership exerts influence on microwear. Correct assignment of individual specimens to phylogenetic group ranged from 62.5%–70.4%, depending on which microwear sites were included. These results were similar to the correct assignment rates to diet (60.7%–73.1%), suggesting that phylogeny may influence dental microwear about as much as does diet. However exclusion of rhinos from the DFAs rendered all of the DFAs insignificant suggesting that dental microwear of the remaining species is not nearly as sensitive to clade membership as are rhinos.
Canonical loadings of the significant DFA’s indicate the number of pits on the lingual side of the tooth (A4) is strongly impacted by clade membership and to a lesser extent, the number of scratches on the labial side (A1) (Table 6).
Discussion
How is dental microwear distributed across ruminant and perissodactyl molars?
Solounias and Semprebon (Reference Solounias and Semprebon2002) reported that A2 has an intermediate number of dental microwear features compared to the lingual and labial sides of the molars although our data do not agree with this observation. Dental microwear in ruminant molars appears to have a homogenous distribution across the tooth. The absolute differences in frequencies of pits and scratches between sampling sites (A1, A2, A4) within any ruminant species is insignificant (Table 2). Browsing and grazing ruminants form two discrete clusters in Figure 3 and are widely separated by scratch frequency regardless of from which part of the molar the data are taken. Standardization of sampling area in ruminants may not be important.
Unlike ruminants, some aspect of dental microwear was found to be heterogeneous in all perissodactyls (Table 2). All perissodactyls have similar patterns of microwear feature distribution with a more pitted ectoloph and more scratched surfaces on areas lingual to the ectoloph (Fig. 3). The degree of intratooth heterogeneity in perissodactyls may be associated with diet. Both grazing perissodactyls, Equus and Ceratotherium, have homogenous scratch distributions and only minor heterogeneity in pit distribution with more pits distributed labially. The two browsing perissodactyls, Diceros and Tapirus, show more extreme degrees of pit and scratch heterogeneity with more pits distributed labially (A1) and more scratches and fewer pits in more lingual sampling locations (A2, A4). Microwear data in perissodactyls, but not ruminants, appears to be highly sensitive to the part of the tooth from where the microwear data is sampled.
Do some microwear sampling sites or combinations of sampling sites predict diet better than others?
For ruminants, scratch density sampled from any region of the tooth had a very close association with diet. Pit data has no clear association with diet in browsing and grazing ruminants. The best performing ruminant-specific DFA involved all three sampling areas and correctly assigned individual teeth to browsing or grazing diets 90.8% of the time. With these results, even a rather modest sample would successfully predict the diet of a browsing or grazing ruminant species using observer blind light microscope methods. Inclusion of mixed feeders might diminish the success of dietary predictions for individual teeth; nonetheless, the data demonstrate that grazing and browsing diets produce consistently different microwear patterns on the molars of ruminants.
We found significant differences in the microwear of grazing and browsing perissodactyls, although the strength of the relationship and the overall pattern of the relationship were not like ruminants. The best performing perissodactyl-specific DFA involved only A1, and accurately assigned individual teeth to diet 76% of the time. Mean values and standard errors of the mean calculated for A1 microwear show a separation between browsers and grazers although not to the same degree of separation seen in ruminants (Fig. 3). Although these results are poorer than for ruminants, accurate predictions of perissodactyls diets based on A1 microwear data are possible with adequate statistical samples. Unlike ruminants, where grazers and browsers differ only in the number of scratches, browsing and grazing perissodactyls differ in the numbers of scratches and pits. Microwear derived from the lingual-ward sites (A2, A4) have no clear relationship with diet in perissodactyls.
To what extent does clade membership bias dental microwear data?
Dental microwear analysis is most often treated as a taxon-free method (Andrews and Hixson Reference Andrews and Hixson2014), meaning that the data are assumed to be a consequence of the physical characteristics of food and not heavily biased by intrinsic heritable properties of the consumers. Christenson (Reference Christensen2014) found dental microwear between ecologically equivalent extant placental and marsupial mammals to be statistically indistinguishable and concluded that microwear can be used to broadly infer diet across Mammalia. However, others have noted that methods adopted by the Christensen (Reference Christensen2014) study (derived from Solounias and Semprebon Reference Solounias and Semprebon2002 and Semprebon et al. Reference Semprebon, Godfrey, Solounias, Sutherland and Jungers2004a) are not observer blind and may have poor repeatability (Grine et al. Reference Grine, Sponheimer, Lee-Thorp and Teaford2012; Mihlbachler et al. Reference Mihlbachler, Beatty, Caldera-Siu, Chan and Lee2012). Facet selection has an effect on microwear data (Gordon Reference Gordon1982; Hunter and Fortelius Reference Hunter and Fortelius1994; Merceron et al. Reference Merceron, Blondel, De Bonis, Koufos and Viriot2005b; Palombo et al. Reference Palombo, Filippi, Iacumin, Longinelli, Barbieri and Maras2005; Calandra et al. Reference Calandra, Göhlich and Merceron2008; Krueger et al. Reference Krueger, Scott, Kay and Ungar2008). The sampling areas of the Christenson (Reference Christensen2014) study were unstandardized due to the great variety of tooth morphologies and chewing mechanisms in Mammalia. Intratooth microwear heterogeneity and the non-observer blind aspect of the methodology may have allowed biased site selection for individual teeth.
As seen in some perissodactyls (Fig. 3) microwear features are not evenly distributed and conclusions about diet could vary depending on what part of the tooth is sampled. Two studies of the microwear of the extinct perissodactyl clade Chalicotheriidae (Schulz et al. Reference Todd, Falco, Silva and Sanchez2007; Semprebon et al. Reference Semprebon, Sise and Coombs2011) produced conflicting paleodietary interpretations with the former suggesting some amount of mixed feeding and the later suggesting strictly browsing. Given the potential for intratooth microwear heterogeneity in perissodactyls, the differing results could be related to unstandardized locations of microwear sites. For similar reasons, paleodietary interpretations of other non-ruminant ungulates and ungulate-like mammals based on a ruminant-biased extant observations are problematic (Boisserie et al. Reference Boisserie, Zazzo, Merceron, Blondel, Vignaud, Likius, Mackaye and Brunet2005; Green et al. Reference Green, Semprebon and Solounias2005; Palombo et al. Reference Palombo, Filippi, Iacumin, Longinelli, Barbieri and Maras2005; Todd et al. 2007; Calandra et al. Reference Calandra, Göhlich and Merceron2008; Reference Calandra, Göhlich and Merceron2010; Townsend and Croft Reference Townsend and Croft2008; Billet et al. Reference Billet, Blondel and de Muizon2009; Semprebon and Rivals Reference Semprebon and Rivals2010; Rivals et al. Reference Rivals, Mihlbachler, Solounias, Mol, Semprebon and de Vos2010; Fraser and Theodor Reference Fraser and Theodor2013).
It is convenient to compare the relative influences of clade membership and diet on dental microwear by comparing the results of separate DFA’s using clade and diet as grouping variables. For most ruminants and for non-rhino perissodactyls (Equus, Tapirus), DFA was more successful at assigning individual teeth to diet than to clade, suggesting that microwear in these species contains relatively little phylogenetic ‘noise’ (Fig. 4). Rhinos appear to have been the primary cause of the significant association of microwear and clade membership. DFAs were far more successful at predicting clade membership than diet for rhino molars (Fig. 4). This nature of the distinctive ‘phylogenetic’ signal in rhino microwear is uncertain. It does not appear related to intratooth heterogeneity; intratooth heterogeneity is quite high for Diceros but the degree of heterogeneity in Ceratotherium is low and similar to Equus (Fig. 3). Moreover, Tapirus exhibits significant microwear heterogeneity, although tapirs and rhinos did not perform similarly in the DFAs; tapir teeth were correctly assigned to diet with much greater frequency than they were assigned to clade, suggesting clade membership had little influence on tapir microwear (Fig. 4).
Percent of correct group assignment resulting from DFAs using all four microwear variables and sampling areas A1 and A4. The white and black columns represent correct assignment to clade (either ruminant or perissodactyl) and diet (browsing or grazing), respectively when all taxa are included in the analysis. The grey bars are the correct assignment to diet when artiodactyls and perissodactyls are analyzed separately.
Examination of ruminants alone improved the ability of DFA to correctly predict diet for ruminant molars in three out of four species (Fig. 4). While dietary assignments of ruminants are more accurate when statistical ‘noise’ from perissodactyls is removed, the opposite proved to be true for perissodactyls. For three of the four species of perissodactyls, teeth were more often accurately assigned to diet when ruminants and perissodactyls were analyzed together that when perissodactyls are analyzed alone.
What heritable variables influence microwear patterns?
The weaker relationship between diet and microwear in perissodactyls could relate to: (1) differences in occlusal patterns and masticatory dynamics, (2) differences in structure and mechanical properties of enamel, and finally, (3) differences in digestive biology between ruminants and non-ruminants. Each of these hypotheses is considered below.
In a generalized mammal, the masticatory power stroke has two phases (Butler Reference Butler1952; Kay and Hiiëame Reference Kay and Hiiëmae1974; Krueger et al. Reference Krueger, Scott, Kay and Ungar2008; Koenigswald et al. 2013). Phase I occurs as the crests move past one another creating a shearing action. Phase II occurs as the cusps come into centric occlusion, resulting in crushing and grinding. Phase I facets and phase II facets in suids (Hunter and Fortelius Reference Hunter and Fortelius1994), primates (Merceron et al. Reference Merceron, Blondel, De Bonis, Koufos and Viriot2005b; Krueger et al. Reference Krueger, Scott, Kay and Ungar2008) and proboscideans (Palombo et al. Reference Palombo, Filippi, Iacumin, Longinelli, Barbieri and Maras2005; Todd et al. 2007; Calandra et al. Reference Calandra, Göhlich and Merceron2008) produce facet-specific microwear patterns, suggesting that specific types of facets provide different types of information about feeding ecology and have different relationships with diet. We might expect species that retain highly differentiated phase I and phase II facets to have more heterogeneous microwear. Likewise, among species where mastication phases have become more homogenized we might expect to find more homogenous microwear.
Grazing ruminants (Bison, Connochaetes and perissodactyls (Equus, Ceratotherium) have evolved a predominantly single-phase transverse shearing motion with flat occlusal planes (Fortelius Reference Fortelius1981; Rensberger et al. Reference Rensberger, Forsten and Fortelius1984; Fortelius and Solounias 2000; Koenigswald et al. 2013). The insignificant and/or minor amount of dental microwear heterogeneity in these species is consistent with expectations for a simplified power stroke. Browsing ruminants (Giraffa, Alces) and browsing rhinos (Diceros) retain distinct steeply inclined labial phase I facets and less steeply inclined lingual phase II facets (Koenigswald et al. 2013) and are expected to have more heterogeneous microwear patterns than grazers. However, these species show a mixture of homogenous (browsing ruminants) and highly heterogeneous (Diceros) microwear. Finally, Tapirus has only steeply inclined Phase I occlusal facets (Koenigswald et al. 2013; Koenigswald Reference Koenigswald2014). A more homogenous microwear pattern is expected, but the microwear of tapirs is among the most heterogeneous of the species sampled.
The traditional phase distinctions in the ungulate masticatory power stroke may oversimplify actual masticatory processes that effect microwear formation. Even for species that have a single phase stroke, occlusal pressure, and the size and shape of the food particles may change from beginning to end of the power stroke. As food is comminuted, the degree to which it disrupts tooth-tooth contact may change throughout the power stroke. These and related factors may influence dental microwear in complex ways that contribute to differential microwear on the labial and lingual sides of the molars of perissodactyls.
Secondly, variation in the structure of enamel and/or its mechanical properties may explain why ruminant microwear is more homogenous and more strongly associated with diet than perissodactyl microwear. Ruminants have a horizontal Hunter-Shreger band arrangement (Koenigswald Reference Koenigswald1997). Perissodactyls exhibit a greater variety of enamel structures. Equids retain horizontal Hunter-Shreger bands while tapir and rhino have curved and vertical Hunter-Shreger bands that produce harder and more abrasion resistant enamel (Rensberger and Koenigswald Reference Rensberger and Koenigswald1980; Fortelius Reference Fortelius1984; Boyde and Fortelius Reference Boyde and Fortelius1986; Koenigswald et al. Reference Koenigswald, Holbrook and Rose2011). Differential abrasion resistance in perissodactyl enamel may mean than particular particles have different potentials for generating microwear features depending on Hunter-Shreger band orientation. More uniform enamel structure among ruminants may mean that particular types of particles generate similar types of microwear patterns in all ruminants, resulting in a more catholic microwear-diet relationship.
Ruminants and perissodactyls show variations in enamel hardness but a clear relationship with microwear patterns is elusive. Browsing and grazing ruminants have softer enamel with hardness values ranging from 285–315 Vickers hardness units (HV) (Hager et al. Reference Hager, Mihlbachler and Beatty2014). Perissodactyl enamel is harder overall (320–380 HV) (Hager et al. Reference Hager, Mihlbachler and Beatty2014). Among perissodactyls, horse (Equus) enamel is the softest (322–324). Rhinocerotids and tapirs have harder enamel (334–380 HV). The enamel of the ectoloph (labial side of the molar) in rhinos examined is significantly harder than the lingual side by up to 13% (Hager et al. Reference Hager, Mihlbachler and Beatty2014). Significant differences in labial and lingual enamel hardness may explain the differences in labial and lingual microwear in rhino molars, but do not explain why horses and tapirs, who have more homogenous hardness values, have significantly heterogeneous microwear.
Thirdly, differences in digestive biology may contribute to differences in ruminant and perissodactyls microwear. Hind-gut fermenters consume higher quantities of food and select food in a more coarse-grained fashion than ruminants (Janis Reference Janis2008) and consequently may consume increased concentrations of inorganic abrasive particles. Inorganic particles appear to be significant contributor to ungulate dental wear (Healy and Ludwig 1965; Ludwig et al. Reference Ludwig, Healy and Cutress1966; Damuth and Janis Reference Damuth and Janis2011, Reference Damuth and Janis2014; Madden 2015; Hoffmann et al. Reference Hoffmann, Fraser and Clementz2015). Even though it is not yet clear what roles inorganic grit and food particles play in microwear formation (Lucas et al. Reference Lucas, Omar, Al-Fadhalah, Almusallam, Henry, Michael, Thai, Watzke, Strait and Atkins2013, Reference Lucas, van Casteren and Al-Fadhalah2014; Rabenold and Pearson Reference Rabenold and Pearson2014), high concentrations of sand or dust may overpower any wear signal from food. Perissodactyls must orally process food with all of its contaminants (dust, sand) from its raw state upon initial ingestion while cud-chewing ruminants orally process food to a much finer degree than perissodactyls, resulting in smaller particles, but only after the food has been predigested in the rumen, making it softer and more uniform in texture than the original food (Fortelius Reference Fortelius1981; Grenet et al. Reference Grenet, Martin-Rosset and Chenost1984; Van Soest Reference Van Soest1996; Clauss and Lechnew-Doll 2002). Denser inorganic particles may also settle in the rumen and may not be regurgitated to the same degree as organic food particles. In this sense, ruminant food may be pre-cleaned to some degree before it is orally processed.
The more homogenous nature of dental microwear in individual ruminant molars may relate to preprocessing of food particles in the rumen prior to oral processing. Ruminant microwear shows the stronger overall relationship with browsing and grazing. Perhaps cud-chewing causes a stronger microwear-diet relationship, since predigestion, comminution to finer particles, and possibly settling out of dense inorganic particles would lead to wear patterns that are more strictly related to the abrasive properties of food. If more indiscriminate ingestion of abiogenic contaminants (e.g., quartz dust) and mastication of food in its raw state has greater influence on perissodactyl microwear, how this might lead to more heterogeneous intratooth microwear patterns is unclear. Fortelius (Reference Fortelius1981) suggested that non-ruminants use higher occlusal pressures. Domestic horses adopt different masticatory cycles with different diets (Bonin et al. Reference Bonin, Clayton, Lanovaz and Johnston2007). Perhaps the greater heterogeneity of perissodactyl microwear relates to more extreme changes in occlusal pressures throughout the power stroke and perhaps these vary with browsing and grazing diets.
Conclusion
Although it is difficult to pinpoint the cause, dental microwear in ruminants differs systematically from perissodactyl microwear in the degree of intratooth heterogeneity and in the relative strength of a microwear-diet relationship. Ruminant microwear is uniformly distributed across individual ruminant molars and is strongly predictive of browsing and grazing diets. Perissodactyls are prone to higher rates of intratooth microwear heterogeneity. A significant microwear-diet relationship exists in perissodactyls but it is weaker compared to ruminants and only found on enamel of the ectoloph, on the shearing (phase I) labial edge of the occlusal surface. These results contrast with studies on primates (Krueger et al. Reference Krueger, Scott, Kay and Ungar2008) and suids (Hunter and Fortelius Reference Hunter and Fortelius1994) that found microwear on phase II (grinding) facets to have a stronger relationship with diet that phase I facets. Researchers should sample microwear from multiple sites rather than adhering to a single standardized homologous area (e.g.,A2) when investigating the dental microwear of non-ruminant ungulates in order to determine the degree of heterogeneity and to what degree, if any, extant species, are appropriate models for deriving conclusions about paleodiets or feeding ecology.
Ruminants may not be good models for dental microwear in perissodactyls and other rare and extinct non-ruminant ungulates and ungulate-like mammals such as Proboscidea (Green et al. Reference Green, Semprebon and Solounias2005; Palombo et al. Reference Palombo, Filippi, Iacumin, Longinelli, Barbieri and Maras2005; Calandra et al. Reference Calandra, Göhlich and Merceron2008, Reference Calandra, Göhlich and Merceron2010; Todd et al. 2007), Suina (Hunter and Fortelius Reference Hunter and Fortelius1994; Bishop et al. 2006; Schmidt Reference Schmidt2008); Camelidae (Rivals and Semprebon 2010; Rivals et al. Reference Rivals, Rindel and Belardi2013) Hippopotamidae (Boisserie et al. Reference Boisserie, Zazzo, Merceron, Blondel, Vignaud, Likius, Mackaye and Brunet2005), Notoungulata (Townsend and Croft Reference Townsend and Croft2008; Billet et al. Reference Billet, Blondel and de Muizon2009) and a menagerie of other extinct groups whose microwear can potentially be studied. Concerns with using extant ruminants as models for non-ruminant species include: (1) different occlusal morphologies and masticatory dynamics, (2) different mechanical properties of dental tissues, and (3) other phylogenetically linked biological processes such as rumination that may influence dental microwear. Dental microwear data are capable of grouping individual teeth according to their respective clades (perissodactyl or ruminant) with nearly the same degree of accuracy as they can group teeth according to diet (grazing and browsing) suggesting that intrinsic heritable properties of the consumers may affect microwear as much as the food being consumed. Dental microwear data seem to contain more phylogenetic noise for some groups (rhinos) than others. Future studies should consider the use of phylogenetic comparative methods (Garemszegi Reference Garamszegi2014) in dental microwear analysis.
Acknowledgments
We thank the New York Institute of Technology, College of Osteopathic Medicine Department of Anatomy and Office of Research for continued support. We thank D. Lunde (National Museum of Natural History, Washington, D.C.), E. Westwig (American Museum of Natural History) and their respective institutions for access to collections. We thank B. Beatty and N. Solounias for fruitful discussion leading up to this research.
Supplementary Material
Supplemental materials deposited at Dryad: doi: 10.5061/dryad.j2d35