Introduction
The general factor of intelligence (g) is reflected in the positive manifold of correlations among measures of various mental abilities. Spearman’s g is best understood as a measure of cognitive complexity: tests demanding higher cognitive complexity have high g loadings, and tests demanding lower cognitive complexity have low g loadings (Gottfredson, Reference Gottfredson1997). The g construct originated from the realm of psychometric tests, and it becomes more interesting when it is shown to be clearly related to variables outside of this area. There is now a nomological net of theoretically and practically important variables to which g is related (Jensen, Reference Jensen1998).
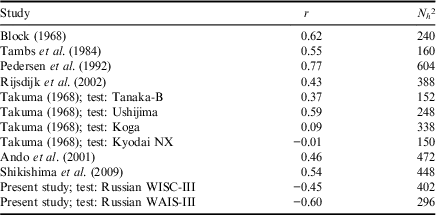
One of the means of identifying variables that are associated with g is to use the method of correlated vectors (Jensen, Reference Jensen1998). This involves calculating the correlation between: (a) the column vector of the g factor loadings of the subtests of an intelligence test or similar battery, and (b) the column vector of the relation of each of those same subtests with the variable in question. Te Nijenhuis et al. (Reference te Nijenhuis, Kura and Hur2014) reviewed five independent studies of heritability (h 2) in which the method of correlated vectors had been used. Jensen et al. (Reference Jensen, Glover and Ronning1987) showed that g loadings of tests correlate highly with their heritabilities in two datasets using the WAIS. Spitz (Reference Spitz1988) reported g loadings of subtests, and heritability coefficients, but did not actually compute the correlation between g and h 2. However, the data in the paper suggest the correlation most likely is high. Pedersen et al. (Reference Pedersen, Plomin, Nesselroade and McClearn1992) reported a correlation of 0.77 between h 2 and g using Swedish data, whereas Rijsdijk et al. (Reference Rijsdijk, Vernon and Boomsma2002) reported a value of 0.43 using Dutch data. In a meta-analysis of Japanese studies, a mean weighted correlation of 0.38 from six studies was found (te Nijenhuis et al., Reference te Nijenhuis, Kura and Hur2014). Thus, the correlations between h 2 and g vary from large to substantial.
Although prior studies showed positive correlations between g and h 2, the size of correlations was variable and the number of studies was limited. Furthermore, prior investigations were based exclusively on Western and Japanese samples. The present study addressed the question of whether the correlation between h 2 and g found in Western and Japanese samples is replicable in the Russian population.
Methods
The study was based on two datasets of Russian twins: 13-year-olds (Group 1) and 16-year-olds (Group 2), who were tested with the Russian versions of the Wechsler Intelligence Scale for Children, 3rd edition (WISC-III), and the Wechsler Adult Intelligence Scale, 3rd edition (WAIS-III), respectively. Parameters of the ACE twin model were estimated for each subscale of each IQ battery. The g loadings and correlations between loadings and heritabilities were also computed.
Samples
Group 1 included 113 monozygotic (MZ) and 88 dizygotic (DZ) Russian same-sex twin pairs (mean age 12.82 years, SD=0.97 years, 54% male). Group 2 included 78 monozygotic and 70 dizygotic Russian same-sex twin pairs (mean age 16.05, SD=0.35, 54% male). The datasets belonged to a longitudinal study, so they were not independent. The overlap between datasets was 135 twin pairs. As the participants took the WISC-III at age 13 and the WAIS-III at age 16 the data were sufficiently different.
Tests
Group 1 was tested with the Russian version of the WISC-III (Panasyuk, Reference Panasyuk1973). Group 2 was tested with the Russian version of the WAIS-III (Filimonenko, Reference Filimonenko1995; based on the adaptation of the Bechterev Psychoneurological Research Institute performed in 1956). The authors did not report the results of their reliability analysis. All subscale scores were adjusted by age and sex of participants to avoid bias (McGue & Bouchard, Reference McGue and Bouchard1984) and standardized.
Computation of heritability coefficients
A univariate twin model (ACE) was applied to all subscale scores in Groups 1 and 2. The ACE model estimates the contribution of genes (A, h 2, heritability), shared environment (C) and non-shared environment (E) to the phenotype. For each component 95% confidence intervals were obtained. To check that the ACE model fitted the data well it was compared against a saturated model using a chi-squared test (the approach used is described in detail in Rijsdijk & Sham, Reference Rijsdijk and Sham2002). Nested models (AE, CE, E) were not fitted and not used for the heritability estimates from the ACE model because the size of the sample was insufficient to estimate moderate or small (under 30%) effects of shared environment. This might increase the probability of type II error and lead to selection of an incorrect model. Still, it was possible to suggest the best fitting model on the basis of 95% confidence intervals.
Computation of g loadings
To compute g loadings, a principal-axis factor analysis was applied to the raw data and loadings of the subtests on the first unrotated factor were used. Finally, Pearson correlations between h 2 and g loadings were computed. All analyses were performed in the R environment for statistical computing (R Core Team, 2012). Modelling was performed by means of the OpenMx package (Boker et al., Reference Boker, Neale, Maes, Wilde, Spiegel and Brick2011).
Results
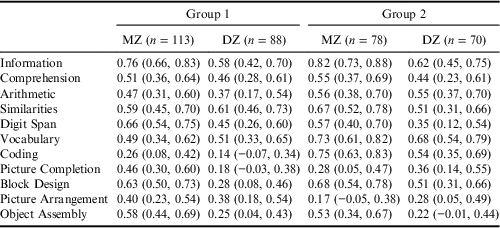
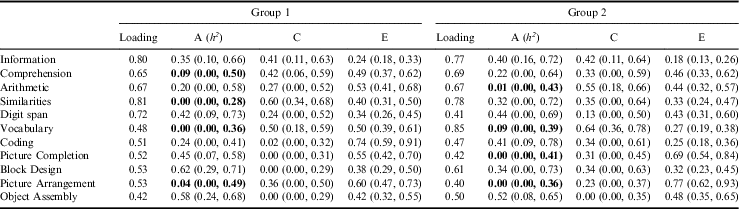
Cross-twin correlations for Groups 1 and 2 are presented in Table 1. Variance components obtained from the ACE model and factor loadings for Groups 1 and 2 are provided in Table 2.
MZ and DZ correlations for Wechsler sub-test scores in two groups of Russian twins (with 95% confidence intervals)
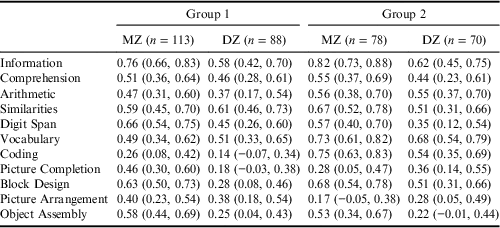
Group 1: 13-year-olds; Group 2: 16-year-olds.
Factor loadings and variance components for two groups of Russian twins (with 95% confidence intervals)
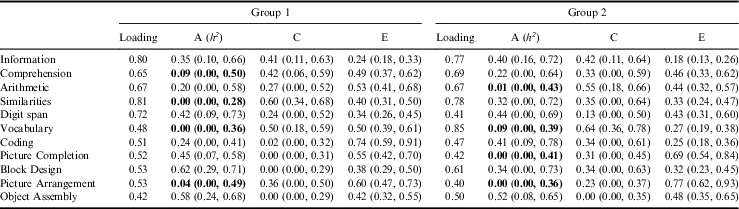
Group 1: 13-year-olds; Group 2: 16-year-olds.
The heritabilities that were excluded and not correlated with factor loadings are in bold.
Heritability analyses
Heritabilities of the Russian WISC-III subtests (Group 1) vary from 0% (Similarities and Vocabulary) to 62% (Block Design), and the mean heritability is 27%. Confidence intervals suggest that additive genetic factors have statistically significant effects on Information, Digit Span, Picture Completion, Block Design and Object Assembly scores. Shared environment has statistically significant effects on Information, Comprehension, Similarities and Vocabulary scores. On average, shared environmental effects explain 26% of the phenotypic variance. The minimum effect is 0% (Picture Completion, Block Design, Object Assembly); the maximum is 60% (Similarities). The variance accounted for by non-shared environmental factors varies from 24% (Information) to 74% (Coding) and is 47% on average.
Heritabilities of the Russian WAIS-III subtests (Group 2) vary from 0% (Picture Completion, Picture Arrangement) to 52% (Object Assembly). Mean heritability is 25%. According to the confidence intervals, additive genetic effects have a statistically significant effect on Information, Coding and Object Assembly scores. Shared environmental factors have a statistically significant effect on Information, Arithmetic and Vocabulary scores. The average shared environmental effect is 33%. The minimum effect is 0% (Object Assembly); the maximum is 64% (Vocabulary). The variance accounted for by non-shared environmental factors varies from 18% (Information) to 77% (Picture Arrangement) and is 42% on average.
Correlation between heritabilities and g loadings
Correlations between heritabilities and factor loadings are −0.27 for the Russian WISC-III, and −0.03 for the Russian WAIS-III. As many researches show that g is highly heritable, it was decided to compute correlations excluding subtests with zero heritability or a heritability close to zero; these very low values most likely reflect a large amount of measurement error (the heritabilities of such subtests are in bold in Table 2; see te Nijenhuis et al., Reference te Nijenhuis, Kura and Hur2014, for a similar choice and discussion). This yielded correlations between heritabilities and loadings of −0.45 for the Russian WISC-III, and −0.60 for the Russian WAIS-III.
Additional meta-analysis
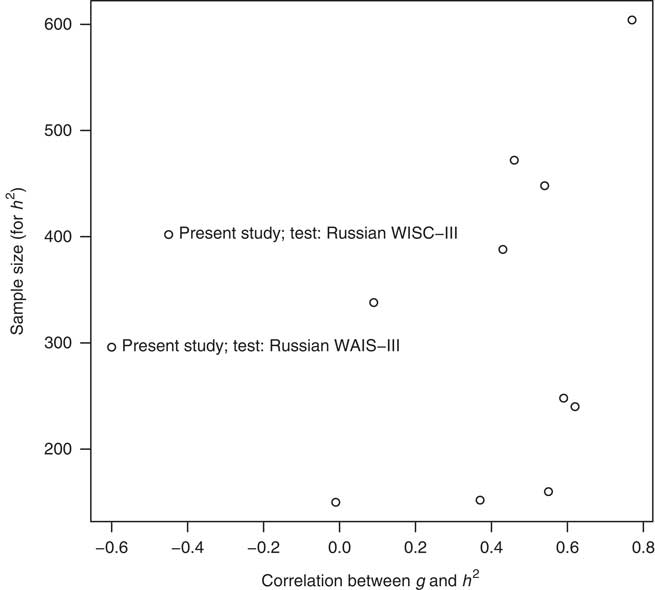
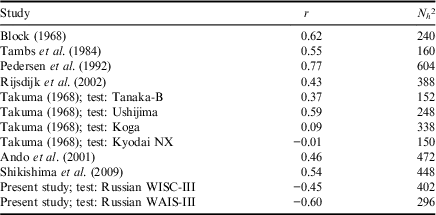
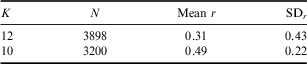
A meta-analysis generally shows that the study with the largest sample size is closest to the theoretically predicted outcome, because there is the least sampling error. Studies with smaller sample sizes have more sampling error and therefore are expected to show the theoretically expected outcome less clearly and also show more variability. Table 3 shows all published studies on r(g×h 2) and Fig. 1 shows a scatter plot of outcomes of all studies on r(g×h 2), including the two present studies, by sample size. It shows that both Russian data points, despite their substantial sample size, do not show the same substantial positive correlation as do most other samples with comparable sample size; the two Russian data points are clear outliers. A bare-bones meta-analysis (correcting only for sample size) was run using the software developed by Schmidt and Le (Reference Schmidt and Le2004). Table 4 shows that for the twelve data points in the meta-analysis the mean-weighted correlation is 0.31. Leaving out the Russian WAIS-III data points leads to a substantial improvement of the mean-weighted correlation, which now has a value of 0.49, confirming that the data point is an outlier.
Scatter plot of g×h 2 correlations against sample sizes from the studies included in the meta-analysis.

Published studies on r(g×h 2 ) with r and N
Bare-bones meta-analytical results for correlations between g loadings and heritabilities
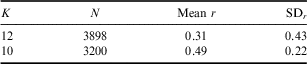
K=number of correlations; N=total sample size; mean r=mean weighted vector correlation; SD r =standard deviation of observed correlation.
Discussion
Previous studies have shown positive correlations between g loadings and heritabilities, but also clear variability in the outcomes. As prior studies were based only on Western samples, a study on Russian twins was carried out. The Russian studies yielded correlations of r=−0.45 and r=−0.60. A scatter plot of a meta-analysis of all studies of correlations between g loadings and heritabilities shows that both Russian data points are clear outliers. So, both data point increase the variability in the meta-analytical collection of data points.
Why do the present findings differ so strongly from the rest of the literature? It may be because of two uncommon patterns in the data. First, the effects of shared environment are unusually persistent with age. As the main component of shared environment is family effects, one could hypothesize that the effects of Western families are different from the effects of Russian families. For example, there is evidence that the influence of family on cognitive abilities is more persistent in France than in the US. Second, although there are exceptions, the trend in the data is for the magnitude of the effects of shared environment to decline with age (Plomin et al., Reference Plomin, DeFries, Knopik and Neiderhiser2013). However, in the present dataset the magnitude of family effects rises in roughly half of the subtests. This seems highly unlikely as family loses out to school and peers (which are highly correlated with genes) as the child ages. It is hard to think of a scenario in which family would tend to gain (progressively outweigh genes) as children age.
The negative correlation between heritability and g loadings is unexpected. It could be hypothesized that complex abilities tend to be ones where non-genetic effects (family effects) are less persistent. For example, Coding (low g loading) is more affected by family than subtests above it on the g-loading scale (for instance Block Design) (see Flynn, Reference Flynn2007, Reference Flynn2012, Reference Flynn2013). Russia could be different in this regard, which is to say that young children and their parents interact cognitively in a way very different from in Western homes. Various studies have shown that there are cultural differences between the West and Russia (Huntington, Reference Huntington1996; Hofstede, Reference Hofstede2001; see also Cavalli-Sforza et al., Reference Cavalli-Sforza, Menozzi and Piazza1994). Future research using Russian twin samples should show whether the present findings are replicated. Other existing studies based on non-Western twins could be checked for comparable findings.
Many genetically sensitive studies of individual differences in cognitive ability have reported the following developmental pattern: the impact of genes rises from 20% in childhood up to 85% in adulthood (Bouchard, Reference Bouchard2013). Inversely, the impact of shared environment drops from 55% to zero. The pattern of variance components in the present study does not correspond with the results of previous studies. Three out of eleven sub-scales show a substantial decrease in heritability between ages 13 and 16; five out of eleven sub-scales show a substantial increase in the effect of shared environmental factors.
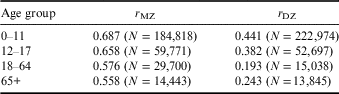
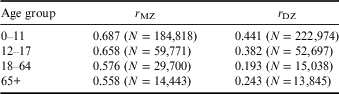
Generally, the increase in heritability and the decrease in shared environmental effects in twin studies reflect the ratio of MZ and DZ twin correlations: the within-pair similarity of MZ twins remains the same whereas the similarity of DZ twins drops. A large meta-analysis of twin studies reported MZ and DZ correlations for cognitive abilities of 0.69 and 0.44 at 0–11 years, 0.66 and 0.38 at 12–17 years, and 0.58 and 0.19 at 18–64 years (Table 5; Polderman et al., Reference Polderman, Benyamin, de Leeuw, Sullivan and van Bochoven2015). The meta-analysis of behaviour genetic research of intelligence shows similar results: the similarity of MZ twins after 4 years remains at the same level (0.85), and the similarity of DZ twins drops from 0.70 to 0.55 by the age of 15 (Bouchard, Reference Bouchard2013). As a result, the estimates of genetic effects rise and the estimates of shared environmental effects drop.
MZ and DZ twin correlations for cognitive abilities across age groups (based on Polderman et al., Reference Polderman, Benyamin, de Leeuw, Sullivan and van Bochoven2015)
This pattern is most commonly explained by gene–environment correlation, which means that children are exposed to environmental effects in a non-random manner depending on their genotypes (Plomin et al., Reference Plomin, DeFries and Loehlin1977). In childhood this process can occur passively when parents adjust the environment according to the child's behaviour (e.g. Tucker-Drob & Harden, Reference Tucker-Drob and Harden2012). Gene–environment correlation amplifies later in adolescence when children can actively choose their educational environment and activities that correspond with their abilities and interests. Under gene–environment correlation MZ twins are exposed to similar environments, so their similarity remains the same through development. The DZ twins are exposed to different environments and become less similar. Certain environmental characteristics – parenting and socioeconomic status – demonstrate a substantial genetic component (20–40%: Ulbricht & Neiderhiser, Reference Ulbricht and Neiderhiser2009; Trzaskowski et al., Reference Trzaskowski, Harlaar, Arden, Krapohl, Rimfeld, McMillan and Plomin2014; Marioni et al., Reference Marioni, Davies, Hayward, Liewald, Kerr and Campbell2014).
The process of gene–environment correlation requires diverse environmental opportunities. Under poor environments children are exposed to the same environmental effects independently of their genetic predispositions. That is why the heritability of cognitive ability in poor families is low compared to wealthy families (Tucker-Drob et al., Reference Tucker-Drob, Briley and Harden2013; Turkheimer & Horn, Reference Turkheimer and Horn2014). The study of Hanscombe et al. (Reference Hanscombe, Trzaskowski, Haworth, Davis, Dale and Plomin2012) also shows a negative relationship between socioeconomic status and the effect of shared environmental factors on intelligence.
In the present study no rise in dissimilarity in DZ twins was observed, similar to other studies, and the most probable reason for this is the descent of the gene–environment correlation. The data were collected in 1994–1997 and 1997–2000 when Russia was passing through a substantial set of socioeconomic reforms. The wealth of people all across Russia dropped dramatically along with access to educational resources within the family. The funding and educational conditions at schools also decreased substantially. This most likely impaired the mechanism of gene–environment correlation, which usually manifests in an increase in heritability and decrease in shared environmental effects.
At the same time Malykh et al. (Reference Malykh, Iskoldsky and Gindina2005) reported substantial genetic effects on Verbal, Performance and Full-Scale IQ in the sample of adult Russian twins (86%, 89% and 89%, respectively). These twins were studying in the 1980s under highly standardized educational programmes. The diversity of educational environment increased only after 2000 when diverse educational programmes and resources appeared and additional education became affordable. The data on primary-school-age twins collected in 2009–2012 show a high impact of genetic factors on general cognitive ability measured by means of Raven’s Standard Progressive Matrices (89%; Davydova et al., Reference Davydova, Ismatullina, Voronin, Ovcharova, Sabirova and Malykh2013).
Another possible explanation for the present results is the low reliability of the sub-scales scores. In a twin study the reliability of the phenotype measure manifests itself in MZ twin correlations: the discrepancy in intelligence in MZ twins after the age of 3 corresponds to measurement error of intelligence tests (about 15%). In this study MZ correlations vary from 0.17 to 0.82. High error variance may bias the estimates of heritability and impact of shared environment.
It is concluded that both Russian data points are not in line with established findings. It may be that the link between g loadings and heritabilities is more complex than previously thought.
Acknowledgments
This work was supported by the Russian Scientific Fund (I. V. and S. M., grant number 14-18-03764). Thanks go to Philipp Barsky for his help in making the collaboration on this project possible, and to Jim Flynn for his constructive feedback.