


Introduction
Agriculture depends on the ability of seeds to survive until the next growing season under ambient conditions. This may have been a factor for which our modern crops were chosen for domestication, thousands of years ago. Normally it would not be have been important that those seeds should survive over decades, but in the case of natural disasters seeds would only be useful if they were still able to germinate after the incident. Priestley et al. (Reference Priestley, Cullinan and Wolfe1985) have shown that different crops are able to maintain 50% of their germination even in different storage locations (e.g. Australia, Russia) at least for 2 years. But most of this investigated material showed a longer half-viability period. Plants with high agricultural utilization but which could not produce long-living seeds (e.g. onion), have never obtained the same agronomical importance as wheat, rice and maize. The agronomical trait ‘seed longevity’ was not considered highly relevant until the beginning of the 20th century. At that time the Russian botanist and ecologist Nicolai I. Vavilov was one of the first to recognize that our plant genetic resources are in particular danger and need to be conserved for the future (Maxted et al., Reference Maxted, Ford-Lloyd and Hawkes1997). These efforts were followed by the establishment of modern genebanks around the world (Linington and Pritchard, Reference Linington, Pritchard and Levin2001), which led to an increasing interest in the storage behaviour of seeds. Haferkamp et al. (Reference Haferkamp, Smith and Nilan1953) showed that germination of open-stored seeds decreased with increasing seed age, but many seeds, including barley, wheat, oat, alfalfa, pea and maize, remained viable after storage for as long as 31–33 years. Moreover, different discoveries have demonstrated that under certain conditions seeds can survive for hundreds of years.
A famous example of extreme longevity is provided by the seeds of a date palm (Phoenix dactylifera L.). These seeds were discovered beneath a Heriodin fortress in Israel in 1965 and, after four decades in storage, one seed germinated. The radiocarbon dating of the remaining seeds revealed an age of 2000 years (Sallon et al., Reference Sallon, Solowey, Cohen, Korchinsky, Egli, Woodhatch, Somchoni and Kislev2008). Furthermore, a deliberate long-term cereal seed-storage experiment, involving wheat, barley, rye and oats, was initiated in November 1877 by F. Haberland at the Universität für Bodenkultur in Vienna. The seeds were maintained at 10–15°C, and after 90 years of storage, 3.5% of the wheat seeds were still viable (Ruckenbauer, Reference Ruckenbauer1971). After a further 20 years, the remaining vials were opened, and while the rye seeds no longer germinated, 81% and 90% of the oat and barley seeds, respectively, were still viable (Steiner and Ruckenbauer, Reference Steiner and Ruckenbauer1995). In addition, the seeds from five weed species (Sinapis arvensis L., Vaccaria hispanica (Mill.) Rauschert, Agrostemma githago L., Sinapis alba L. and Lolium temulentum L.) present in the oat sample as impurities, were also able to germinate.
However, the seeds of the above-mentioned discoveries were all found and stored under ultra-dry conditions; even the samples of Haferkamp et al. (Reference Haferkamp, Smith and Nilan1953) were stored in a dry continental climate zone. Is it possible to have comparable longevities in a temperate zone? Seed companies, breeders, farmers and many seed banks store their material under open storage conditions. How long can this material survive in terms of high germination (>80%)? The following study on genebank accessions addresses these questions. The plant material was planted, harvested and stored in central Germany, where the 10-year average relative humidity is 80.4 ± 1.5% and the average temperature is 9.8 ± 0.5°C. The seeds belonged to the ex situ genebank for agricultural and horticultural crop plants in Gatersleben, which houses some 150,000 accessions, covering over 3000 species within 890 genera. In general, orthodox seeds are conserved at − 15°C, while vegetatively reproduced plant materials are maintained by in vitro culture and cryo-conservation. Seed storage accounts for about 90% of the stored material (Börner, Reference Börner2006). In addition to the long-term cold-storage facilities, reserve seeds are routinely stored in paper bags under room-temperature conditions. These seeds are provided for the enquiries of different users during the first years after harvest.
Our aim was to assess the longevity of this reserve seed. In comparison with standard papers by Walters et al. (Reference Walters, Wheeler and Grotenhuis2005), Priestley et al. (Reference Priestley, Cullinan and Wolfe1985), Roberts (Reference Roberts1972) and Ellis and Roberts (Reference Ellis and Roberts1980), we investigated the seed from 18 crop species, which had been stored under ambient conditions for 6–26 years. We addressed the following questions: (1) How long can seeds survive in ambient but uncontrolled storage? (2) How much variation exists within species? (3) Does crop year make a difference? (4) Do laboratory tests of longevity correspond to field emergence? (5) How long can the seeds be stored, maintaining germination over 80%?
Materials and methods
Plant material
Seeds were obtained from various plantings performed between 1980 and 2005. The 18 test species included starchy-seeded cereals: oat (Avena sativa L.), barley (Hordeum vulgare L.), bread wheat (Triticum aestivum L.), rye (Secale cereale L.), triticale ( × Triticosecale Wittm.) and maize (Zea mays L.); proteinaceous legumes: lupin (Lupinus albus L.), common bean (Phaseolus vulgaris L.), pea (Pisum sativum L.) and common vetch (Vicia sativa L.); oilseeds: collard (Brassica oleracea L.), sunflower (Helianthus annuus L.), linseed (Linum usitatissimum L.) and poppy (Papaver somniferum L.); and miscellaneous species, including chives (Allium schoenoprasum L.), cucumber (Cucumis sativus L.), carrot (Daucus carota L.) and lettuce (Lactuca sativa L). All seeds were kept in paper bags in a room where the temperature was maintained at 20.3 ± 2.3°C, and the relative humidity (RH) at 50.5 ± 6.3%. Three to five different accessions per crop species were chosen randomly from almost every harvest year between 1980 and 2005, giving a total of 30–148 accessions per crop, ranging from 1 to 26 years in age (Table 1). The species were classified into cereals, legumes, oil crops and miscellaneous crops.
Numbers of harvest years (HY) and accessions (Acc.), averaged amount (% of dry mass) of carbohydrates (CH), proteins and oil, and 1000 kernel weight (g) taken from data by Earle and Jones (Reference Earle and Jones1962), Jones and Earle (Reference Jones and Earle1966) and Sinclair and DeWit (Reference Sinclair and DeWit1975) with respect to the species and crop group investigated

Seed germination
All samples were germinated in 2006, using 50 seeds for each accession, according to ISTA rules (ISTA, 2005). Depending on their size, the seeds were placed either over or between moistened filter papers on a Jacobsen apparatus, which provided a temperature regime of 25 ± 2°C during the day and 23 ± 2°C during the night. Germination percentage was based on the number of seedlings with a normal appearance. A parallel field experiment tested seed material derived from a subset of accessions (Table 1). Seeds were sown in September 2006 in the form of two replicated rows of 25 seeds each. The sowing depth was adjusted to seed size, with small seeds being placed at a depth of 1–2 cm, and large ones at 3–5 cm. The number of emerged seedlings was counted after 2 and 4 weeks.
Longevity calculations
The age of each seed sample was taken as the number of years that had elapsed since their harvest. Based on the germination of the five accessions per reproduction cycle, a probit analysis was performed. A transformation of cumulative, normally distributed germinabilities converts the expected sigmoid germination curve to a linear one which can be described by equation (1), where ν is probit percentage viability at storage time p and its initial probit percentage viability K i, whereas σ is the standard deviation of the distribution of deaths in time (Ellis and Roberts, Reference Ellis and Roberts1980).

In addition, the half-viability period (P50) was calculated in equation (2) by setting ν = 0 (equal to 50% germination) and transforming p to P50:

In some cases, extrapolation was required and conducted on the basis of the slope ( − 1/σ) and the intercept (K i) of the seed survival curve, as given in equation (1). Probit parameters and uncertainty of P50 values are given as confidence interval in Table 2.
Calculated longevity parameters (intercept, slope) in accordance with the longevity equation ν=K i −(1/σ)p including the time for the level of germination to fall to 50% (P50). [ν=probit viability; K i=initial germination (probit); −1/σ=slope; p=storage time (years); SE=standard error]

Ø, crop average.
Statistical analysis
Based on the three to five accessions per harvest year and species, arithmetic mean and standard deviation (SD) were calculated. Intraspecific variation was evaluated on the basis of these SDs. Correlations between absolute longevities, which define the storage period until the last year of seed germination, and P50 values, and also between germinations and field emergence, were calculated using the software program SPSS 17.0 (SPSS Inc., Chicago, Illinois, USA, 2008). Correlations are expressed by coefficient of determination (R 2). Relationships between absolute longevities, P50 values (Table 3), chemical composition and 1000 kernel weight (Table 1) are based on data by Priestley et al. (Reference Priestley, Cullinan and Wolfe1985), Walters et al. (Reference Walters, Wheeler and Grotenhuis2005), Earle and Jones (Reference Earle and Jones1962), Jones and Earle (Reference Jones and Earle1966) and Sinclair and DeWit (Reference Sinclair and DeWit1975). P50 values (Table 3) of barley, wheat, maize, bean, pea, sunflower, flax and lettuce seeds were also calculated using Ellis's viability equation (Ellis and Roberts, Reference Ellis and Roberts1980). Coefficients were reported by Liu et al. (Reference Liu, Eastwood, Flynn, Turner and Stuppy2008), the storage temperature was assigned as 20.3°C (average storage temperature) and water content was calculated by using average storage RH (50.5%), average temperature (20.3°C) and oil contents provided by Liu et al. (Reference Liu, Eastwood, Flynn, Turner and Stuppy2008). The initial germination was assigned as intercept based on the longevity calculation (Table 2).
Comparison of seed longevity values (in years) for each species as represented by absolute longevities, analysed P50 results and P50 values by Ellis's viability equations, Priestley et al. (Reference Priestley, Cullinan and Wolfe1985) and Walters et al. (Reference Walters, Wheeler and Grotenhuis2005)

Ø, crop average.
Results
Viability after 1–26 years of storage was assessed among the different crop species. Most crops showed high germination when germinated within 2 years post harvest, but germination of most species declined to nearly 0% after 20 years, except for barley, maize, lupin, common bean and pea. Final germination was not available for lupin, poppy, linseed, cucumber and carrot. A correlation between germination and field establishment was considered significant at R 2 of 0.60 (P < 0.001).
Cereals
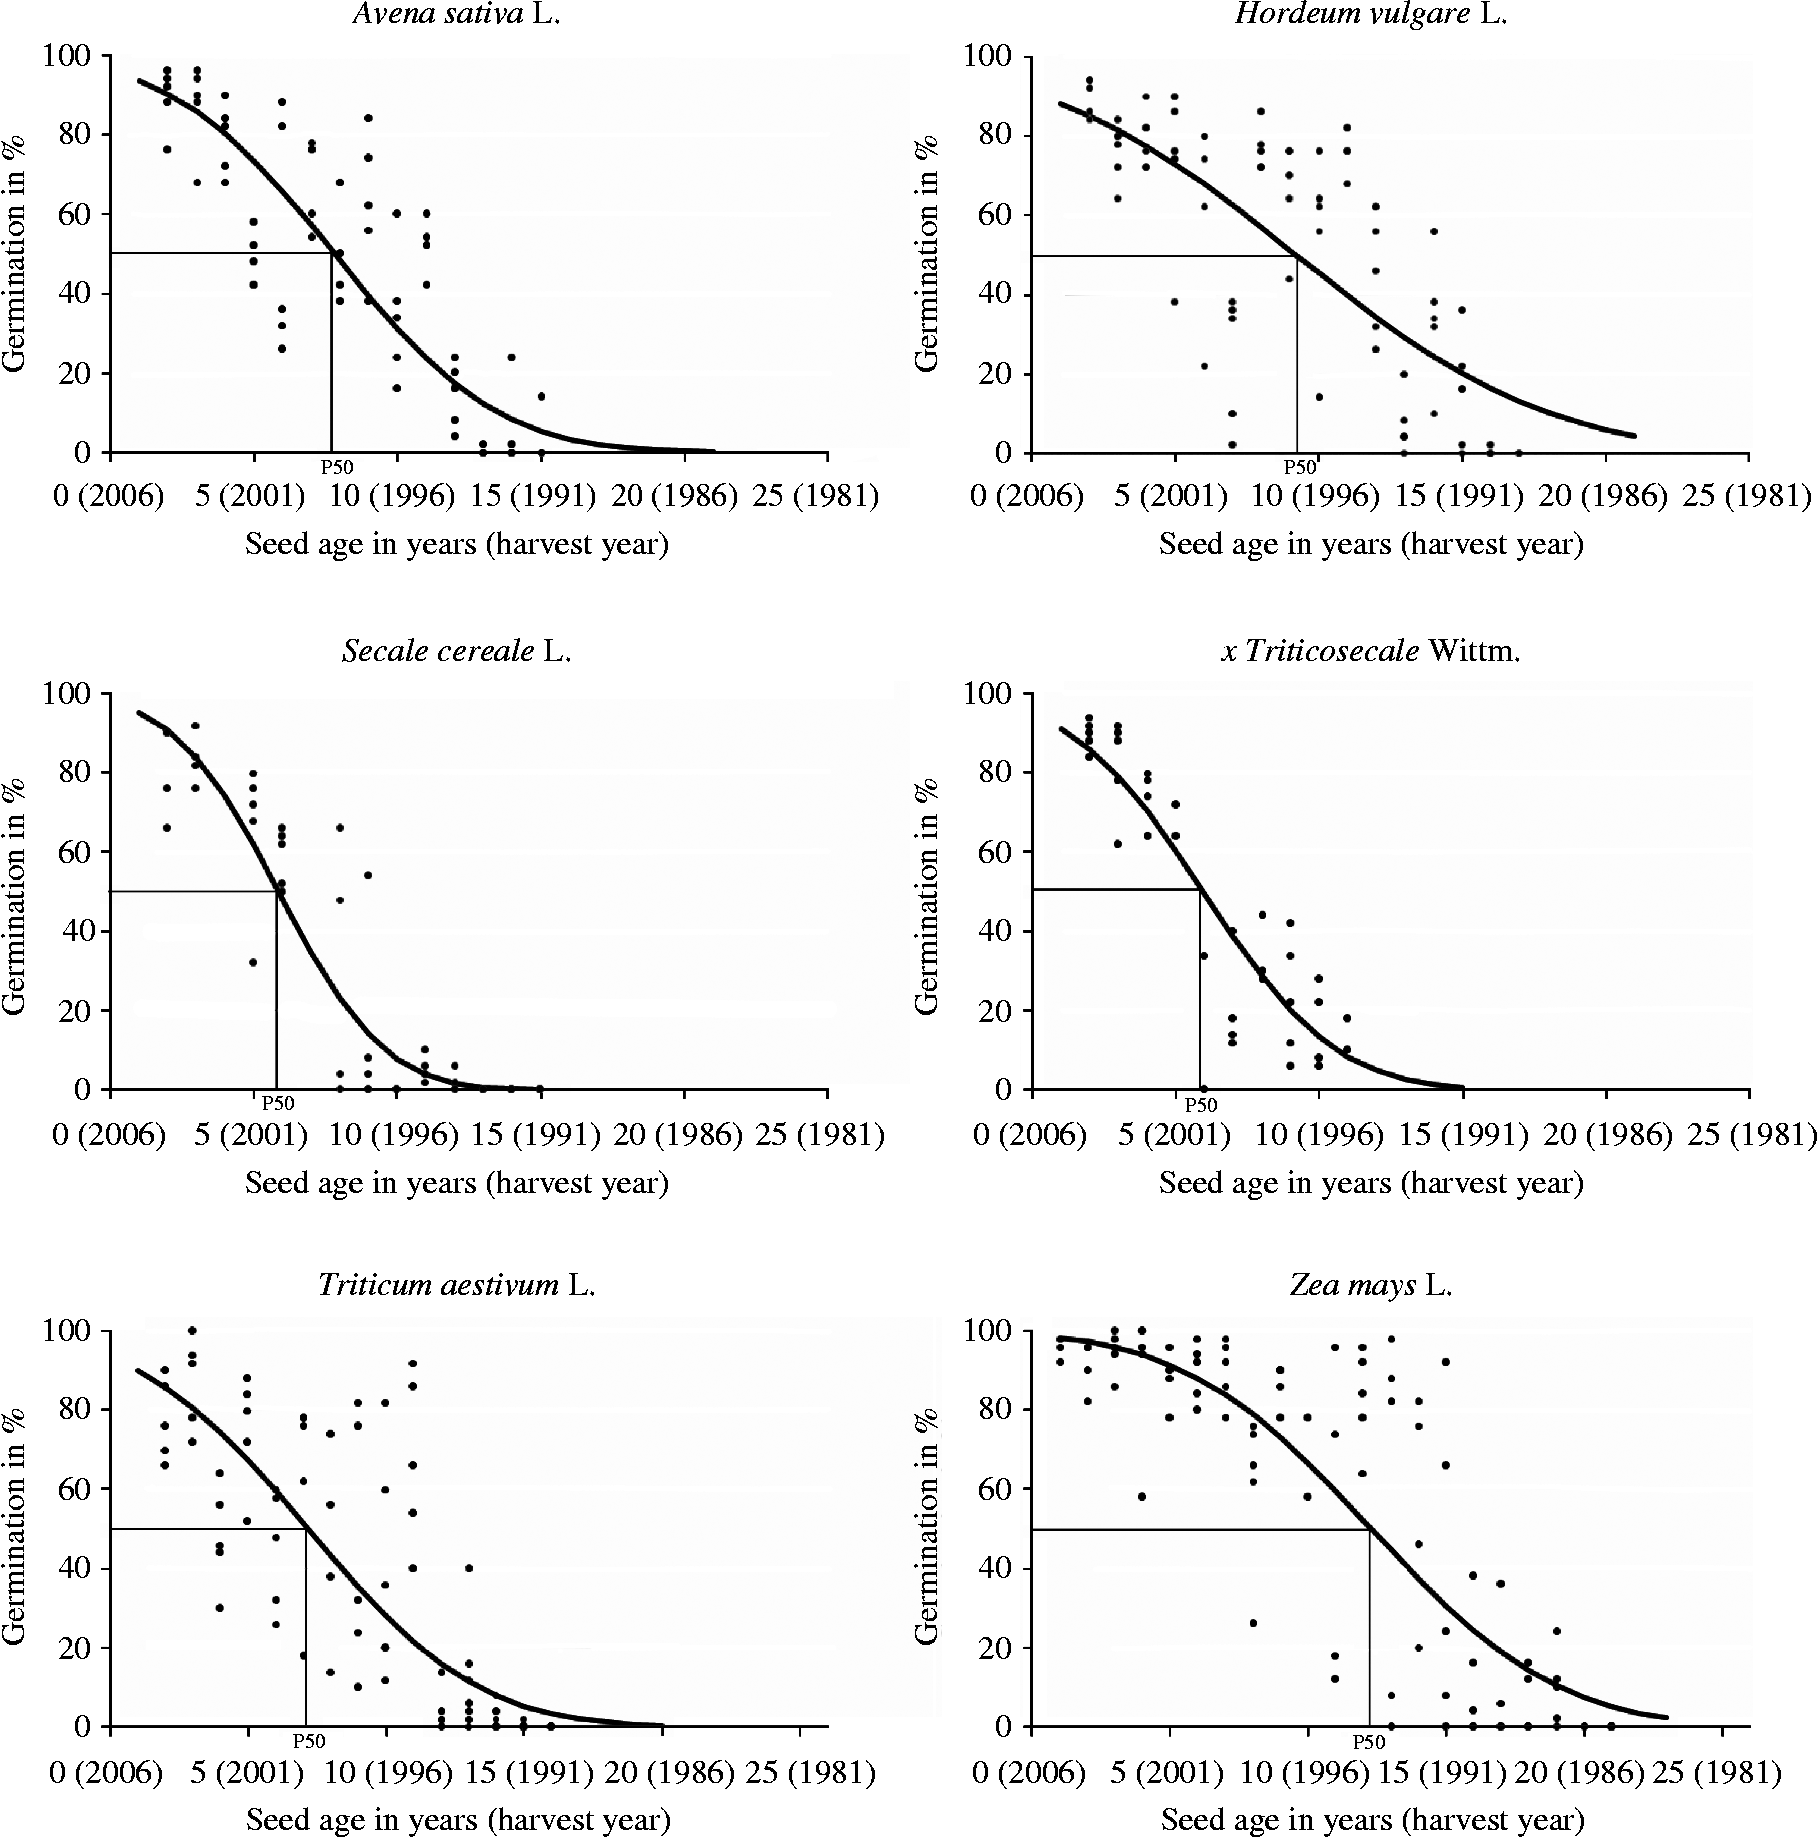
Maize was the most robust of the cereals. After 12 years of storage, germination was still over 80% (82.8 ± 12.6%) but it decreased to 55.2% with an increasing variability (SD: ± 47.2%) after 13 years, and germination only ceased after year 20 of storage (Fig. 1). In the field the highest variability of emergence (28.4 ± 18.2%) could be detected in year 14, whereas the correlation between germination and the field emergence was 0.73 (R 2; P < 0.001). On the basis of the single lab germination, the half-viability period (P50) was computed and resulted in 12.3 years in the case of maize. In barley, P50 was 9.2 years but the germination percentage remained above 80% only during the first 4 years of storage (4 years: 80.4 ± 6.8%), falling thereafter to 44.1 ± 30.7%, including the highest variability within this species, by year 7, and to zero by year 17. In the field, year 13 of the four tested years presented the highest variability (34.8 ± 27.6%) and field emergence correlated highly with lab germination (R 2 = 0.75; P < 0.001). Oat showed the same results in this relation (R 2 = 0.76; P < 0.001). The mean germination of oat remained close to 80% (79.2 ± 9.0%) after 4 years of storage, but fell to 52.8% by year 6, showing the highest standard deviation ( ± 29.7%), just as in the field emergence (67.2 ± 25.2%). After 16 years, oat germination dropped to zero and the half-viability period was calculated to be 7.8 years. In bread wheat, the behaviour was noticeably variety-dependent, falling to 4.4% by year 12, and to zero by year 16. Its SD increased between 2 years (77.6 ± 10.2%) and 9 years (44.8 ± 32.3%) and decreased after 10 years (42.0 ± 28.9%), which was also detectable in the field (3 years: 86.4 ± 5.5%; 9 years: 24.8 ± 19.8%; 13 years: 0.8 ± 1.0%). There was a strong correlation between germination and field emergence (R 2 = 0.82; P < 0.001). The half-viability was reached after 7.2 years. Rye seed viability declined rapidly after 5 years of storage (65.6 ± 19.3%), reached the highest SD in the lab (29.5 ± 32.6%) and in the field (38.5 ± 44.4%) after 8 years, falling to zero by year 13. The correlation (R 2) between both traits was 0.54 (P < 0.01). Triticale behaved in a similar fashion, decreasing from 89.6 ± 3.8% in year 2, 68.0 ± 5.6% in year 5 and 17.0 ± 24.0% in year 6 to 14.0 ± 5.7% in year 11. However, the correlation of lab germination and field emergence was much better (R 2 = 0.89; P < 0.001). P50 of both species was reached after 5.9 years. Ranking the cereals along their P50 values, the species with the longest-living seeds was maize followed by barley, oat and wheat. Rye and triticale were the species with the shortest-living seeds.
Percentage germination of six cereal species including the calculated probit curve as a function of storage time (harvest year). ·, Germination (%) per accession; —, calculated probit curve; P50, half-viability period.
Legumes
The longest-living seeds among the legumes were those of pea, in which >80% germination was maintained for 11 years (11 years: 82.0 ± 16.2) (Fig. 2). From this time point on, the accessions behaved less consistently, and by year 16 the germination dropped to 43.6%, the SD increased to 40.4% but the overall mean germination decreased, reaching zero by year 24. In the field, the germination decreased from year 1 (96.0 ± 3.7%) to year 12 (58.8 ± 40.5%) and showed an increasing SD. But older seeds, by year 16, revealed a decreasing SD (16.0 ± 14.7%). The similar germination behaviour in the lab and in the field led to a significant high correlation (R 2 = 0.71; P < 0.001). Furthermore, probit analysis showed that pea seeds performed the best, with P50 = 13.9 years, followed by lupin with P50 = 13.5 years. Lupin germination percentage varied between 80 and 100% over the first 7 years (7 years: 83.6 ± 10.4%), dropping thereafter in some accessions, but being maintained at a high value in others (10 years: 44.0 ± 32.7%). The oldest available seed stock was 17 years (39.6 ± 28.9%), so the storage time before germinability was completely lost could not be established. The germination variability of genotypes in the field was high over all tested harvest years (SD: ± 12.4 to ± 23.5) but the correlation with lab germination appeared to be lower (R 2 = 0.33; P < 0.01). Common vetch accessions maintained their germinability at ~95% for 7 years (7 years: 94.8 ± 4.8%), thereafter behaving much like pea. The variability of germination between the genotypes rose in year 11 (48.0 ± 30.0%) and dropped until year 18 (0.55 ± 1.3%). Only the behaviour in the field changed such that the highest SD could be detected in year 4 (79.2 ± 33.4%) and correlation between field and lab behaviour was low (R 2 = 0.16). Probit analysis revealed that the half-viability period of common vetch was 10.8 years. For common bean, 70–90% lab germination was maintained over 9 years (9 years: 76.8 ± 26.6%), after which it fell gradually and reached its highest SD in year 12 (lab: 32.4 ± 39.8%; field: 21.6 ± 40.7%), whereas germination ceased by year 22. Germination and field emergence were highly correlated (R 2 = 0.77; P < 0.001). On the basis of the lower initial germination, P50 of common bean was calculated to be 9.8 years. Corresponding to germination, the half-viability period of the different legume seeds could be ranked with pea seeds as longest-living, followed by lupin, common vetch and common bean seeds.
Percentage germination of four legume species including the calculated probit curve as a function of storage time (harvest year). ·, Germination (%) per accession; —, calculated probit curve; P50, half-viability period.

Oil crops
Linseed retained an average germination of around 90% during the first 8 years of storage (Fig. 3) (8 years, lab: 90.4 ± 3.8%; field: 84.9 ± 13.9%), which dropped to ~10% by years 13 (lab: 5.2 ± 11.6%) and 16 (lab: 10.8 ± 8.6%). After this storage period the germination in the field was better (16 years: 27.2 ± 17.5%) but corresponded very well with the lab germination (R 2 = 0.88; P < 0.001). No seed older than this was available for testing. The half-viability period P50 was 10.4 years, which made linseed the best performing oil crop. Poppy seeds followed with a P50 of 8.2 years but included a high uncertainty between 6.6 and 25.8 years due to missing germination results in older harvest years. The mean germination of poppy seeds fell from 92.4 ± 7.3% to 62.0 ± 44.3% between years 4 and 9, and the highest variability of genotypes was reached in year 9. Older seeds than these were not available for testing. In the field, poppy seeds performed worse than in the lab, resulting in a correlation (R 2) of 0.63 (P < 0.001). Collard seeds maintained a high germination rate for 5 years (lab: 86.8 ± 11.5%; field: 84.8 ± 14.4%), the standard deviation increased in 11 years (28.8 ± 35.7%) thereafter decreasing to 4.4 ± 4.6% by year 13. The appearance of the seedlings in the lab was similar to those in the field and was highly correlated (R 2 = 0.87; P < 0.001). On the basis of these lab germination results, the half-viability period of collard was 7.3 years followed by sunflower with P50 = 4.3 years. For the latter crop large differences between accessions were noted but the mean germination rate fell rapidly from year 1 (90.0 ± 10.6%) to 32.4 ± 26.7% in year 6, reaching zero by year 10. In the field the performance of sunflower seeds was only 77.0 ± 18.4% germination after 1 year of storage, and after 7 years 49.2 ± 28.8% germinated, but the results corresponded well with lab germination (R 2 = 0.73, P < 0.01). The P50 values of the oilseeds were inferior to those of the legume seeds and could be ranked from long-living linseed to poppy and collard seeds. Sunflower seeds appeared to be short-living in this experiment.
Percentage germination of four oil crop species including the calculated probit curve as a function of storage time (harvest year). ·, Germination (%) per accession; —, calculated probit curve; P50, half-viability period.

Miscellaneous crops
Cucumber seed germination was maintained between 70 and 100% over 12 years of storage (12 years: 70.4 ± 42.7%) (Fig. 4). In year 13 the variation of genotypes rose to 50.4 ± 44.1%, falling to 49.3 ± 42.8% by year 16 and ceasing in year 17. For further tests in field performance no seeds were available. On the basis of the lab germinations P50 was 14.9 years with a slightly higher uncertainty between 13.5 and 17.3 years. In contrast, carrot seed half-viability was more than half shorter and calculated to be 6.1 years. Carrot seed germination declined slowly from 75.2 ± 7.8% (2 years) to 15.5 ± 28.4% by year 9 and reached highest standard deviation by year 5 (46.4 ± 31.2%). The same behaviour was detectable in the field: germination dropped from year 3 (64.8 ± 6.6%) to year 9 (8.5 ± 17.0%) and reached highest SD in year 6 (49.2 ± 18.5%). The results in the field correlated with the lab germination at R 2 = 0.61 (P < 0.01). A considerably shorter survival curve was presented by lettuce, falling from 98.0 ± 2.5% (2 years) to 26.0 ± 32.0% by year 5 and 0% by year 8. In the field it already reached 64.8 ± 6.6% in year 3 and declined to 0.8 ± 1.1% in year 6, thus a high correlation was found between both experiments (R 2 = 0.79, P < 0.001). The least storable seed of all the test species were those of chives, for which germination started at 62.4 ± 22.9% (1 year), the SD was increased in year 3 (23.6 ± 29.6%) and reached zero by year 6. In the case of the field experiment, germination was detected only in the first storage year (24.4 ± 10.1%) and the correlation resulted in R 2 = 0.63 (P < 0.001). Lettuce and chive seeds behaved in a similar fashion and their survival curves resulted in a half-viability period of 4.6 years and 1.9 years, respectively. Finally, the longest-living miscellaneous crop seeds were cucumber followed by carrot and lettuce. The lowest P50 value was associated with chive seeds.
Percentage germination of four miscellaneous species including the calculated probit curves as a function of storage time (harvest year). ·, Germination (%) per accession; —, calculated probit curve; P50, half-viability period.

Discussion
We have determined longevity for seeds from 18 crop species, which were stored under ambient conditions (average temperature: 20.3 ± 2.3°C; average RH: 50.5 ± 6.3%) for up to 26 years. Viability remained relatively high for at least the first 2 years after harvest but declined to 0 within 5–23 years, giving an average P50 among all species of 8.6 ± 3.6 years.
As has been documented by Roberts (Reference Roberts1972), germination decreased over storage time in a sigmoid fashion whereby the parameters of these curves seemed to be species specific. Despite the fact that the probit analysis method is sensitive to deviation with regard to the shape of the survival curve (Moore and Roos, Reference Moore and Roos1982), the correlation between P50 and absolute longevities resulted in a high R 2 (0.90; P < 0.001). A higher uncertainty was only seen for those species (lupin, poppy, cucumber, carrot) that did not have available seeds of older harvest years (Table 2). When germination results of a whole survival curve were available, the half-viability period P50 proved to be a valuable parameter for evaluation of seed longevity and may give information about seed storage behaviour under ambient conditions.
On the basis of P50 values, seeds of maize, lupin, common vetch, pea, linseed and cucumber (P50>10 years) tended to be relatively long-living, whereas those of sunflower, chives and lettuce (P50 < 5 years) were not. According to the results of Walters et al. (Reference Walters, Wheeler and Grotenhuis2005) seeds of maize, common vetch, pea and lettuce were equally classified. In contrast, sunflower and linseed seeds were defined as medium, cucumber seeds as medium long, whereas chive and lupin seeds were not included. On the whole, the hypothesis that seed deterioration behaviour is species characteristic is supported by significant correlations among different seed ageing experiments (Tables 3 and 4). In relation to this fact, the absolute longevity correlated significantly with results by Priestley et al. (Reference Priestley, Cullinan and Wolfe1985), whereas P50 correlated with data by Walters et al. (Reference Walters, Wheeler and Grotenhuis2005) (Table 4). The viability equation by Ellis and Roberts (Reference Ellis and Roberts1980) also showed a significant R 2 (0.51, P < 0.05) but only by using a ranked correlation with P50. Due to open storage conditions, averaged temperatures and RH, Ellis's viability equations underestimated almost all calculated species, except pea. However, the equation is thought to predict seed longevity under controlled conditions in a range of temperatures from − 13°C up to 90°C. The validity of predicting, by extrapolation, longevities in the region of millennia for dry, cold-stored seeds is often criticized and overestimations are assumed (Pritchard and Dickie, Reference Pritchard, Dickie, Smith, Dickie, Linington, Pritchard and Probert2004). Viability equations would provide helpful tools for genebank managers but overestimation would end in a disaster of dead seeds. Underestimations, as shown here, are also of low value and involve higher management cost and higher risk for the material, considering intermixture, natural disasters and genetic drift. Nevertheless, referring to the coefficients of determination, they do not explain the whole variance. Therefore further factors of influence, e.g. harvest year, processing and storage conditions, are conceivable.
Correlations – (a) Pearson, (b) Spearman, ranked correlation – between P50, absolute longevities, Ellis's viability equations and literature data. Longevity values are given in Table 3. Correlation coefficients (R 2) are given for each linear regression, with the number of species considered given in parentheses
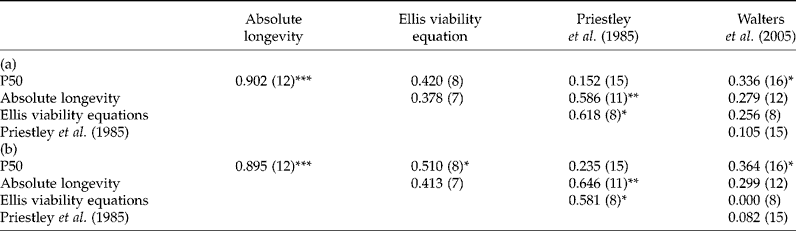
* Indicates a significant trend at P < 0.05; **, a significant trend at P < 0.01; ***, a significant trend at P < 0.001.
Besides an interspecific variation in seed longevity, a varying behaviour between different genotypes was indicated by the standard deviations. Over all species the mean SD was 9.9 ± 8.1% in the second year, increasing to 21.6 ± 11.4% in the year around the species-characteristic P50 value and attaining the highest SD value (32.1 ± 9.4%) after 9.3 ± 3.4 years. Chive and common bean seeds, particularly, showed an SD above 20% over the half-survival period. In the case of common bean seeds, unpublished data by Nagel and Börner revealed a clear variability among different coloured beans, which, apparently, played a part in contributing to that variation. Furthermore, collard, barley, lupin, poppy, wheat and maize seeds reached an SD above 10% in the same period and showed a higher inter-varietal difference than the other crops. Due to various harvest seasons of the different crops, genotypic differences cannot be associated with the harvest year. In addition, the experimental design did not allow an analysis of variance concerning the factors harvest year, species or genotype. But experiments on aged seeds belonging to double-haploid barley mapping populations outlined a high intraspecific variation, which is inherited quantitatively. Four quantitative trait loci (QTL) were detected and associated with genes controlling fertility, abiotic and biotic stress response, plant development and morphology (Nagel et al., Reference Nagel, Vogel, Landjeva, Buck-Sorlin, Lohwasser, Scholz and Börner2009). Debeaujon et al. (Reference Debeaujon, Léon-Kloosterziel and Koornneef2000) also showed an impact of structure and pigmentation on storability of Arabidopsis mutants. Therefore mainly the morphology and factors occurring during the vegetative period in a harvest year, as well as the ability of plants to respond to these factors, seem to influence the genotypic behaviour.
Furthermore, by calculating the mean P50 values among the crops, the results presume that the predominant seed storage compound (cereals = carbohydrates; legumes = proteins; oil crops = lipids) may determine seed longevity, with proteins >carbohydrates>lipids (Table 3). Average data by Priestley et al. (Reference Priestley, Cullinan and Wolfe1985) give the same ranking for longevities (P50) with proteins (13.1 years), carbohydrates (8.4 years) and lipids (7.1 years). However, data from Earle and Jones (Reference Earle and Jones1962) showed that legume species had a wide range of protein content from 12 to 55% and an oil content between 1 and 45%. A correlation between absolute longevity, P50 and averaged starch, protein and oil content data by Earle and Jones (Reference Earle and Jones1962), Jones and Earle (Reference Jones and Earle1966) and Sinclair and DeWit (Reference Sinclair and DeWit1975) revealed no significant relationship between the storability of seeds and the starch and protein content (Tables 1 and 5). Only the oil content appeared to have a strong influence (R 2 = 0.64; P < 0.01) on the absolute longevity but not on P50. At storage conditions of − 20°C and various RHs, Pritchard and Dickie (Reference Pritchard, Dickie, Smith, Dickie, Linington, Pritchard and Probert2004) could confirm a more rapid ageing in oily seed, but further proved that at a constant RH the dependence of predicted longevity on oil content is weak. A similar correlation was also found by Walters et al. (Reference Walters, Wheeler and Grotenhuis2005) but the relationship did not hold when families with varying chemical composition, such as legumes, were considered separately in those studies. Based on the findings of Priestley (Reference Priestley1986), Vertucci and Leopold (Reference Vertucci and Leopold1987), Gidrol et al. (Reference Gidrol, Serghini, Noubhani, Mocquot and Mazliak1989), Steadman et al. (Reference Steadman, Pritchard and Dey1996), Sun and Leopold (Reference Sun and Leopold1997), Medeiros et al. (Reference Medeiros, Probert, Sader and Smith1998) and Sinniah et al. (Reference Sinniah, Ellis and John1998), Pritchard and Dickie (Reference Pritchard, Dickie, Smith, Dickie, Linington, Pritchard and Probert2004) assumed that a major effect of chemical compounds on seed longevity is related to: (1) the sorption properties of seeds; (2) the potential sites for free radical attack; and (3) the presence of protective compounds and their activity. However, regarding the seed full survival curve, oil content seemed to influence longevity under open storage conditions, so further analysis will be necessary to clarify these mechanisms.
Correlations between P50, absolute longevities, chemical composition (% of dry mass) and 1000 kernel weight (weight/1000 in g) taken from data of Earle and Jones (Reference Earle and Jones1962), Jones and Earle (Reference Jones and Earle1966) and Sinclair and DeWit (Reference Sinclair and DeWit1975). Correlation coefficients (R 2) are given for each linear regression, with the number of species considered given in parentheses

* Indicates a significant trend at P < 0.05; **, a significant trend at P < 0.01; ***, a significant trend at P < 0.001.
Apart from the relationship between compositional and longevity data, a negative correlation between oil content and thousand kernel weight (R 2 = 0.49; P < 0.05) appeared. Assuming decreasing seed longevity with increasing oil content, a shorter survival curve could be estimated with lower seed weight. Except for non-existent correlations between these factors, a direct analysis between different seed mass and longevities in dry storage revealed no significant relationship (Pritchard and Dickie, Reference Pritchard, Dickie, Smith, Dickie, Linington, Pritchard and Probert2004).
Regarding field emergence, significant correlations (R 2>0.54, P < 0.01) with germination results appeared among all species except for lupin and common vetch. Improved germination performance under field conditions, as compared to controlled laboratory conditions, was found for oat, barley, common bean, pea, common vetch and sunflower seeds. It seems probable that the basis of this improvement lies in the activity of soil microflora, which can interact with moisture availability to promote germination (Powell, Reference Powell1988). This was especially marked in 1-year-old common bean seeds, which showed 90.4 ± 4.3% emergence in the field whereas the seeds in the lab gave only 66.4 ± 17.9% germination. In contrast, chive, carrot and lettuce seeds behaved worse in the field as compared with lab results, which could be an artefact of the design (standardized conditions for all species, timing) of the field experiment. However, the germination test reveals basic information about the seed behaviour in the field and provides important data about viability of seeds after long-term storage.
In general, the data contribute to a broader understanding of seed behaviour in storage. Although most genebanks are working on the basis of FAO/IPGRI Genebank Standards (FAO, 1994) with a recommended temperature of − 18°C and 3–7% seed moisture content, seed companies, breeders, farmers and genebanks store seed mostly under unfavourable conditions. Additionally, the ex situ genebank for agricultural and horticultural crop plants in Gatersleben includes a room designed for storing remnant seeds which are provided to users during the first years after harvest. Questions about duration of the provision of seeds may be answered by this study. For seed keepers in general, storage temperature and seed moisture content are important in dealing with seed longevity (Ellis and Roberts, Reference Ellis and Roberts1980). Considering the storage conditions of about 20.3 ± 2.3°C and 50.5 ± 6.3% RH, this study can be a useful guideline for viability estimations under these conditions. Therefore, Table 6 provides recommendations of storage times until germination falls to 80%. As previously assumed, genotypic differences and initial germination can provoke strong differences in germination behaviour and were taken into account for these recommendations. But for decision-making of genebank managers these factors need to be considered when a monitoring frequency is chosen.
Recommendations (in years) for various species stored under ambient conditions (20.3°C and 50.5% RH) and 95% confidence limits (in years) of storage period until germination drops to 80%

Acknowledgements
The authors wish to acknowledge past and current staff of the Gatersleben genebank who collected, regenerated, stored and monitored the seed material. Special thanks are due to Sibylle Pistrick, the head of the IPK germination testing laboratory. Finally, we are grateful to Professor Christina Walters, USDA-ARS, National Center for Genetic Resources Preservation, Fort Collins, USA, Professor Michael Kruse, University of Hohenheim, Germany and Professor Rolf Rauber, University of Göttingen, Germany, for their advice on statistical analysis and constructive comments.



