“You never saw a people more excited on the subject of politics than are the negroes of the South. They are perfectly wild.”
—John H. Parrish to Henry Watson, Jr., August 6, 1867“I do not hesitate to assert that the Southern Reconstruction Governments were the best governments those States ever had.”
—John R. Lynch, The Facts of Reconstruction (1913)The economic effects of black political leaders that followed from the unexpected enfranchisement of black men after the American Civil War has not been well studied in economic history. From essentially no black political participation in the United States before the Civil War, the dramatic entry of blacks into American political life led to more than 1,300 blacks holding offices ranging from local school boards to Governor from 1866 to 1880 in the South. Black officeholders faced competition for office, created and exploited local black political organizations and voter education efforts, and articulated a policy platform that was at odds with antebellum Southern institutions. What is not known is whether their involvement left any measurable impacts in a part of the United States with traditionally low levels of investment in public goods. In particular, did their time in service have any effects on local public finance, public goods provision, land reform, and socioeconomic outcomes?
There has been remarkably little economic analysis of the effects of this dramatic increase in black political participation. While Alston and Ferrie (Reference Alston and Ferrie1999), Naidu (Reference Naidu2012), Kousser (Reference Kousser1974), Wright (2006), Wright (Reference Wright1986), Margo (Reference Margo1990), Ransom and Sutch (Reference Ransom and Sutch2001), Pritchett (Reference Pritchett1985), Pritchett (1989), and others have detailed the links between political disenfranchisement and public goods after Reconstruction, few have considered the role of black politicians during Reconstruction. For example, Margo (Reference Margo1990) and Pritchett (1989) concentrate on schooling after Southern whites seized control of school boards and consolidated school financing at the state level. Naidu (Reference Naidu2012) and Kousser (Reference Kousser1974) concentrate on voting restrictions that were enacted after widespread voter intimidation limited black political participation. Alston and Ferrie (Reference Alston and Ferrie1999) and Ransom and Sutch (Reference Ransom and Sutch2001) focus on labor contracts in periods where blacks lacked access to organizations such as the Freedmen’s Bureau to negotiate contracts. Ager (Reference Ager2013), Larsen (Reference Larsen2015), and Acharya, Blackwell, and Sen (Reference Acharya, Blackwell and Sen2016) consider the persistence of political power, but the role of black political success during Reconstruction is not directly addressed in the existing scholarship.Footnote 1 Recently, Chacon and Jensen (Reference Chacon and Jensen2017) and Stewart and Kitchens (Reference Stewart and Karin2017) have analyzed the political consequences of military occupation during Reconstruction, but this work does not address black political involvement directly and views black political success as a function of occupation, while the narrative history describes much broader effects of black political involvement (Hahn Reference Hahn2005; Foner Reference Foner2014).
Part of this neglect may reflect the shifting historiography of Reconstruction, most recently described by Foner (Reference Foner2014). The earliest histories of Reconstruction were heavily influenced by the Dunning School, which held that Reconstruction was a failure, that black political participation led to incompetent leadership, and that federal influence in the former Confederacy was unwarranted and ultimately unsuccessful (Dunning Reference Dunning1907). While this narrative was first challenged by Du Bois (Reference Du Bois1935) and followed by several scholars in African American history (Bennett Reference Bennett1962, 1967; Franklin Reference Franklin1961), the narrative on Reconstruction and black policymakers has only recently been added to the mainstream historical narrative (Hahn Reference Hahn2005; Rabinowitz Reference Rabinowitz1982; Lynch Reference Lynch2012; Foner Reference Foner1996, 2014; Woodward Reference Woodward1971). The current consensus is that the Reconstruction governments were not as incompetent as previously believed. The efficacy of these governments, however, has not been documented quantitatively.
This paper is the first to estimate the effect of black politicians on Reconstruction-era public finance. Using a novel dataset on black political officeholders combined with county-level tax data in 1870, I find that the conditional correlation between county taxes per capita and the number of black politicians is positive and significant, with each additional black politician correlated with a $0.09 increase in per capita county tax revenue. While the conditional correlation between black officeholders and local public finance is inherently interesting and consistent with the narrative record, the confounders of political competition, local preferences for redistribution, white resistance, and black political mobilization could lead to biased or spurious estimates of the effect of black politicians on local tax revenue. Most importantly, black politicians could be endogenous to local political preferences, which would limit our ability to ascribe effects to black political leadership as opposed to voter preferences or other factors.
To overcome these endogeneity concerns, I use the within-state distribution of free blacks in 1860 as an instrument for black policymakers during Reconstruction. Intuitively, areas with more free blacks antebellum had a larger supply of potential officeholders during Reconstruction for reasons unrelated to local political preferences for redistribution. While well motivated by the historical literature, I check that this instrument satisfies the exclusion restriction via a number of supplementary empirical tests. I show that the within-state distribution of free blacks is not related to (1) the date of entry of black politicians, (2) the date of exit, (3) the average length of term in office, (4) Reconstruction-era voting outcomes, or (5) voter registration.
Instrumental variables (IV) estimates are twice as large as ordinary least squares (OLS) estimates, with each additional black politician increasing per capita county revenue by more than $0.20, which is more than a laborer’s hourly wage at the time. The IV estimates imply that a one-standard-deviation increase in the number of black officials increased Southern per capita county tax revenue by 0.62 standard deviations, a remarkably large effect. Results also show that the effect is not simply a product of black politicians representing majority black electorates. As an additional check to ensure that the result works through black officeholders and not community-level preferences for redistribution, I measure how local public finance changed after Reconstruction ended. Beginning in the mid-1870s, Southern whites began to restrict the political participation and influence of blacks, known as Redemption. By 1877, the vast majority of black officeholders had been replaced by whites. If the tax revenue effect in 1870 is driven by local electoral preferences for redistribution, then the result should be persistent even after black policymakers are out of office. I find, however, that the effect of black politicians entirely reverses—the same increase (which, after Reconstruction, is a decrease) in black politicians decreases tax revenue (1880–1870) by 0.86 standard deviations. Put another way, the tax effects of black policymakers left no lasting effects on local public finance.
Moving beyond the aggregate tax effects, I use the narrative record to show that black politicians had policy agreement on the use of taxes for two specific redistributive purposes—public education and land redistribution. To examine whether these tax revenue effects were related to outcomes, I analyze the effects of black politicians on land reform and education. I find that black politicians were related to increased tenant farming and decreased sharecropping in 1880, consistent with tax policy altering incentives for land use resulting in better labor contracts.Footnote 2 I also find large education effects for both blacks and whites exposed to black politicians. A back-of-the-envelope calculation shows that a one-standard-deviation increase in black politicians increased black male literacy by 2 percentage points.
This paper makes several contributions to the literature. First, this paper adds a quantitative assessment of black politics during Reconstruction. Scholars, such as Du Bois (Reference Du Bois1935), Foner (Reference Foner2014), Franklin (Reference Franklin1961), and Hahn (Reference Hahn2005), have sought to revise the role of black politicians during Reconstruction, but the effects have not been quantified. Second, the results here add to the growing literature on policymaker demographics and political outcomes (Beach and Jones 2017; Ferreira and Gyourko Reference Ferreira and Gyourko2009, 2014; Pande Reference Pande2003; Chattopadhyay and Duflo Reference Chattopadhyay and Duflo2004). This analysis shows that politician race affected outcomes over and above electoral preferences. Moreover, this work is consistent with the literature that finds large public finance effects for black enfranchisement (Cascio and Washington 2014), suggesting that political representation can strengthen the electoral effects of enfranchisement. While the existing literature has found that the racial composition of official governing boards matters more than individual demographics of members (Beach and Jones 2017; Ferreira and Gyourko Reference Ferreira and Gyourko2009, 2014), this paper’s results suggest that, historically, politician demographics mattered a great deal. Third, this paper fills an important gap in the political economy of Reconstruction. While black political participation and officeholding are well known, the effects of black officeholders are not. In addition, this work leverages the historical record to determine, ex ante, the specific areas of policy agreement among black officeholders and allows me to analyze whether specific policy goals were achieved, consistent with models of citizen candidates (Alesina Reference Alesina1998; Osborne and Slivinski Reference Osborne and Slivinski1996; Besley and Coate Reference Besley and Coate1997). Fourth, this paper speaks to the literature on American politics, labor, schooling, and institutional development. The majority of existing Reconstruction studies focus on specific states or biographies of specific leaders, not the broad policies advocated by black political leaders. The political gains during Reconstruction by blacks had real effects in a region of the country with traditionally low investment in public goods and human capital. The results here show that black political leadership is an important and omitted factor in black socioeconomic outcomes after the Civil War.
BLACK POLICYMAKERS AND RECONSTRUCTION POLITICS
The enfranchisement of black males in the South began in 1867 when Congress ordered Southern states to form new governments under suffrage laws that were racially neutral. More than one million black men were enfranchised and a significant number of blacks held office during Congressional Reconstruction. Though black officeholding was extensive, in proportion to the population, it still marked underrepresentation for blacks. More than 30 percent of the Southern population was black at the time. Nevertheless, the widespread election of Southern blacks was a striking revolution in both American and global political history.
One key issue facing any policymaker during Reconstruction was public finance. The antebellum tax base in some Southern states was predicated on slavery. In Louisiana, for example, slaves accounted for between one-third and one-half of the property tax base. Falling agricultural prices and the decline in black labor supply were only part of the problem. Given that the majority of Civil War battles were fought in the South, infrastructure repair placed additional demands on public finance. Even more, the humanitarian needs of the newly emancipated slaves were not fully addressed at the federal level and required local public support.
Bond (Reference Bond1938) argues that tax rate increases were driven by two factors between 1860 and 1870– a decrease in the value of assessed property and increased spending during Reconstruction. Thornton (2016) shows that tax increases were significant during Reconstruction and argues that tax increases were a key reason for Reconstruction’s failure. The self-assessment of property values came to an end with Reconstruction, where administrative offices were established to assess property values and where tax rates increased to finance an expanding range of public goods including infrastructure, education, and public assistance. Another issue was slavery itself—farm value was positively related to the extent of slaveholding within the South (Wright 2006). Lynch (Reference Lynch2012) details several officials whose duties included assessing taxes or collecting taxes at the local level. There was variation in the duties and the degree to which local officers could influence tax revenue under regulatory authority, but for the first time, blacks held these positions or otherwise held positions that would influence tax levels. Such titles included levee commissioner, collector of taxes, internal revenue assessor, auditor of the treasury, and tax assessor, in addition to offices that had legislative authority to tax.Footnote 3
The Political Ideology of Black Policymakers
Investigating potential effects of black officeholding is an empirical task as the relationship between politician race and policy is theoretically ambiguous. Before turning to estimates of the effect of black politicians, it is important to detail their political preferences and to highlight areas where they held broad agreement. Drawing on an extensive review of the primary and secondary historical record of Reconstruction, I used a narrative approach to establish areas of policy agreement among black policymakers. I adopted criteria to identify the policies. Specifically, (1) there had to be direct narrative evidence about a specific policy, (2) the policy and its reasoning had to be explicitly stated by policymakers at the time, (3) numerous examples of policy discussion had to be found over several states during Reconstruction, (4) no evidence of broad disagreement in the policy goals and objectives among black policymakers could be found, and (5) the policy had to be one whose efficacy could be empirically validated ex post. On this basis, there were two key issues that black political leaders thought most important—land redistribution and public education (Du Bois Reference Du Bois1935; Foner Reference Foner2014; Hahn Reference Hahn2005; Rabinowitz Reference Rabinowitz1982; Williamson Reference Williamson1965).Footnote 4
BLACK POLICYMAKERS AND LAND REFORM
Southerners of both races noted that the low taxes in the antebellum era encouraged the acquisition of unimproved land by wealthy landowners (Foner Reference Foner2014). While land productivity was high in the antebellum South, more than two-thirds of Southern farmland was unimproved in 1860 (Fogel and Engerman Reference Fogel and Engerman1974). During Reconstruction, black policymakers sought to use tax policy to induce the sale of unimproved land (Foner Reference Foner2014). The basic idea was not to use taxes on land to seize property for non-payment of taxes but rather to alter the opportunity costs of large landholding. Most states designed policy where land seized for taxes was to be sold in small lots, similar to lotteries in the antebellum era for land acquired through treaties with Native American tribes. As noted by Foner (Reference Foner2014), Abraham Galloway, an influential black politician in North Carolina, stated, “I want to see the man who owns one or two thousand acres of land, taxed a dollar on the acre, and if they can’t pay the taxes, sell their property to the highest bidder … and then we negroes shall become land holders” (p. 376).
The narrative record establishes that this policy was not restricted to a few black leaders in selected states. For example, Williamson (Reference Williamson1965) describes the case in South Carolina as “a heavy tax on unused land. This tax was expected to force owners of such lands either to bear the burden of the tax from their other resources, to put the land under cultivation and thus employ laborers or renters, or to allow the land to be sold…” (p. 148). He further notes that a black delegate to the South Carolina convention stated that the high tax rates “would force owners of large tracts of waste lands to sell and give us a chance” (p. 149). Similarly, Foner (Reference Foner1996) describes, “several officials, including Matthew Gaines of Texas … urged heavy taxation of unoccupied land, to force it onto the market” (p. xxvii). The system of taxation became the preferred means of land redistribution, as the emerging Southern leaders feared that confiscation would meet with negative reaction in the North.
It is important to distinguish this policy from land seizures for non-payment of property taxes. Land seizures were relatively common during Reconstruction, but they rarely resulted in significant land redistribution. Even at the time, policymakers of all political stripes noted the limited ability of public property sales for tax liens to redistribute land due to the potential of collusion in the land markets, making the prospects for land redistribution from taxes even less likely (Foner Reference Foner2014).Footnote 5 Overall rates of black landowning were relatively low, and while tax policy has been seen as an ineffective method of land redistribution, there have been few empirical tests for any effects (McPherson Reference McPherson1875).
BLACK POLICYMAKERS AND PUBLIC EDUCATION
The key issue for education was creating and financing a public education system that would serve both black and white students. Although there were Federal Freedmen’s Bureau schools, they educated relatively few black students. The public school system was far more important (Margo Reference Margo1990). As noted by Du Bois (Reference Du Bois1935) and others, the South did not invest heavily in human capital before the Civil War. Public education necessitated a drastic change in public financing in the South. From a base of essentially no investment in public education (Merritt Reference Merritt2017), one-fifth of local taxes were used to fund public education during Reconstruction (Du Bois Reference Du Bois1935). Attempts to use federal funds to finance public education were futile, although Senator Charles Sumner repeatedly attempted to have federal assistance for public schools.Footnote 6 While some advocated the sale of federal lands or unclaimed Civil War bounties to finance education, the use of poll taxes and property taxes proved more amenable to finance local public schools (Rabinowitz Reference Rabinowitz1982; Lynch Reference Lynch2012; Marszalek Reference Marszalek2008; Foner Reference Foner2014; Williamson Reference Williamson1965). Since these were administered at the county level, the county became the traditional boundary for Southern school districts.Footnote 7
The specific policy mechanisms advanced by black politicians for public education varied. In Alabama, a property tax was proposed; in Texas, the sale of public lands was offered; in Maryland, changes to the state tax code to allow local taxation were put forth; in South Carolina, Murray suggested that unclaimed Civil War bounties could be used; and North Carolina debated a specific consumer tax for education. Governor Harrison Reed’s plan in Florida was to increase land assessments to fund public goods, and this model was followed in other Southern states by black political leaders (Current Reference Current1988). Fitzgerald (Reference Fitzgerald2007) notes that property tax increases were the key drivers of tax revenue in Mississippi and Louisiana, while Valelly (Reference Valelly2004) also shows that poll taxes played a critical role. It was common during Congressional Reconstruction that state taxes were supplemented with local tax revenue. As Williamson (Reference Williamson1965) notes, “each county taxed its property owners for the administration of regular county affairs and for special purposes such as new buildings and roads. Furthermore, the school tax was often quoted separately” (pp. 150–51). Gillette (Reference Gillette1982) has argued that the prospects of federal land sales to finance education were an impetus for the federal Civil Rights Acts passed during Reconstruction. In general, the contemporary historical record has documented the primacy of public education in black policymakers’ decisions.
Southern Redemption
Beginning in the early 1870s, Southern whites began a widespread campaign to undo the Congressional Reconstruction process. Southern Redemption was concentrated on reducing the level of black political involvement and reestablishing antebellum social relations (Rable Reference Rable2007; Lemann Reference Lemann2007; Woodward Reference Woodward1971). The eventual establishment of Jim Crow and the de facto disenfranchisement after Reconstruction were not automatic but rather required Southern states to overturn Congressional Reconstruction policies. As such, Southern Redemption was predicated on the political events of Reconstruction.Footnote 8 One aspect of the racial nature of Redemption is that white Southern populists were vocal in their opposition to any black political power or enfranchisement. Fitzgerald (Reference Fitzgerald2007), Rable (Reference Rable2007), and Lemann (Reference Lemann2007) claim that political arguments over “excessive” taxation were related to increasing Ku Klux Klan activity and overt acts of racial intimidation, many of which were aimed at black voters and officeholders. Some resistance to taxes was due to the belief that high tax rates were keeping capital investment out of the South, even though tax rates in the South were relatively low (Hesseltine Reference Hesseltine1935). Woodward (Reference Woodward1971), Ayers (Reference Ayers1992), and Williamson (Reference Williamson1965) note that Redemption came with state policies that limited the ability of local bodies (such as school boards and boards of equalization) to levy taxes and even created systems where board members were selected by the governor as opposed to the local electorate. Despite the appeals to states’ rights, Redemption featured strong federalism in public finance when it limited black political prerogatives.
Fitzgerald (Reference Fitzgerald2007) notes that while some white officials sought to drastically reduce all education expenditures after Redemption, the popularity of public schooling among whites led to fewer reductions in educational expenditures for whites. When white Democrats petitioned Congress over the issue of increased tax rates, South Carolina’s governor instructed State Treasurer Francis Cardozo to issue an itemized response, which listed state and normal school expenses as two of the four largest categories of expenditure accounting for the growth in government outlays, which made dramatic cuts more politically difficult (Williamson Reference Williamson1965; Sterling Reference Sterling1994). Nevertheless, Woodward (Reference Woodward1971) and Valelly (Reference Valelly2004) describe how the average length of the school term declined by 20 percent and expenditures per pupil declined by 60 percent from 1871 to 1880. In Virginia, the governor promised planters that the property tax, which funded public schools, would not be enforced (McPherson Reference McPherson1992). Williamson (Reference Williamson1965), consistent with other histories, describes how black/white school funding ratios diverged considerably after Redemption. Du Bois (Reference Du Bois1935) notes the decrease in school enrollment from 1874 to 1876 when Democrats seized control of the Arkansas legislature. Political disenfranchisement was linked to education. White legislators justified the disenfranchisement of black citizens by arguing that it was not “incumbent” upon them to educate blacks and that, as uneducated citizens, they should not vote.
The narrative history of events after Reconstruction gives some important clues about the efficacy of black political leadership. While narrative histories stress voting and racial intimidation, public finance played a significant role as well. The tax policies adopted during Redemption are further suggestive evidence of the stark policy preference differences between black and white officeholders in the South after the Civil War.
DATA AND EMPIRICAL STRATEGY
Information on black policymakers comes from Foner (Reference Foner1996), which is the most comprehensive source of black officeholders during Reconstruction. While not a complete catalog of every black officeholder during Reconstruction, Foner (Reference Foner1996) contains the entries of all major officials and the vast majority of black officials (“all the major black officials at the national and state levels and a majority of local officeholders”).Footnote 9 As noted by Foner (Reference Foner1996), they had “control over such matters as public expenditures, poor relief, the administration of justice, and taxation policy, local officials had a real impact on the day-to-day lives of all Southerners” (p. xxvi).
One concern is selection in the officials appearing in Foner (Reference Foner1996), which could be correlated with their political efficacy. The historiography of Reconstruction, however, strongly suggests that this would not be the case. The existing scholarship about the known black politicians was often incorrect and narratives about the illiteracy and poverty of the black politicians was repeated in the historical narrative until the archival work in Foner (Reference Foner1996) and other histories were compiled. Indeed, the histories of Reconstruction that noted black officials often did so derisively. Coluter (Reference Coluter1968), for example, described black officials in Georgia as swindlers who could not read, although the majority were literate. Black officials were not included as examples of political effectiveness but most often as prime examples of incompetence and unfitness for office. The consensus of the ineffectiveness of black officeholders before the revisionism, all of whom are included in Foner (Reference Foner1996), suggests that the black officials in the historical record would not be selected due to their perceived effectiveness.
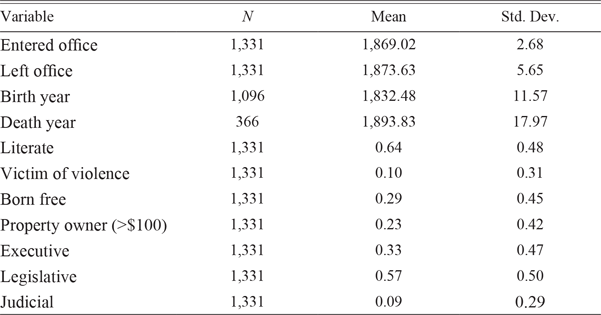
The data compiled by Foner (Reference Foner1996) include not only the name and position held but also the place of officeholding. I exclude those whose only elected office was a delegate to a state constitutional convention. (Given their small number, their inclusion does not alter the results.) All officeholders are matched to the county where they served. The information was compiled and classified by officeholder and type of office. There is a great deal of variation within states in the number of black officeholders.Footnote 10 Additional information on officeholders includes term in office occupation, literacy, and slave status at birth. Table 1 shows summary statistics for the black politicians.Footnote 11 Consistent with the narrative record, a disproportionate number of the officeholders were born as free blacks; more than 40 percent whose slave status at birth could be determined were born free. Of all of the officeholders, more than 20 percent were confirmed to have been born free. When considering the extent of manumission, this is a conservative estimate of the over-representation of free blacks among officeholders but establishes that free status was disproportionate among black officeholders. As a comparison, of the total U.S. black population of 1860, 10.7 percent were free, whereas in the South, less than 6 percent of the black population were free.
SUMMARY STATISTICS FOR BLACK OFFICIALS DURING RECONSTRUCTION

Note: Data are from Foner (Reference Foner1996) for each unique black officeholder.
Source: Author’s calculations.
Literacy is another dimension of their status. More than 60 percent of the officeholders overall are known to have been literate. Of those whose literacy status could be determined by matching them exactly to the census records, more than 80 percent were literate. This level of literacy is far above estimates of literacy for the black population as a whole. Margo (Reference Margo1990) estimates that less than 30 percent of the black population in 1880 was literate. Nearly a quarter of officeholders owned property valued at more than $100 at the time of census enumeration, at least an order of magnitude above the rate of property ownership for blacks in the late nineteenth century (Margo Reference Margo1984; Higgs Reference Higgs1984).
Occupations are another dimension of their elite status. Less than 25 percent of the officeholders were farmers or laborers, the most common occupations for Southern blacks at the time. Nearly 13 percent were ministers and more than 7 percent were merchants. In terms of the branch of government in which they served, more than half (56.7 percent) served in a legislative capacity and roughly one-third (33.5 percent) served in executive positions. The remaining 9 percent served in judicial offices.Footnote 12
County-level information comes from the 1870 and 1880 censuses as well as electoral return data at the county level (Haines and ICPSR Reference Haines2005; Clubb et al. Reference Clubb, William and Nancy2006; ICPSR 1999; Atack Reference Atack2016; Logan Reference Logan2019).Footnote 13 The focus on county taxes is due to the fact that very few municipalities collected any taxes in either 1870 or 1880. For historical public finance, county tax revenue is the key metric for within-state variation (Sylla Reference Sylla, Stanley and Robert1986).Footnote 14 For example, in Alabama, fewer than 20 percent of the counties reported any local or municipal taxes. Out of all municipal taxes collected in Alabama, more than 80 percent came from two urban counties, Mobile and Montgomery. Other Southern states followed a similar pattern of very little municipal taxation.
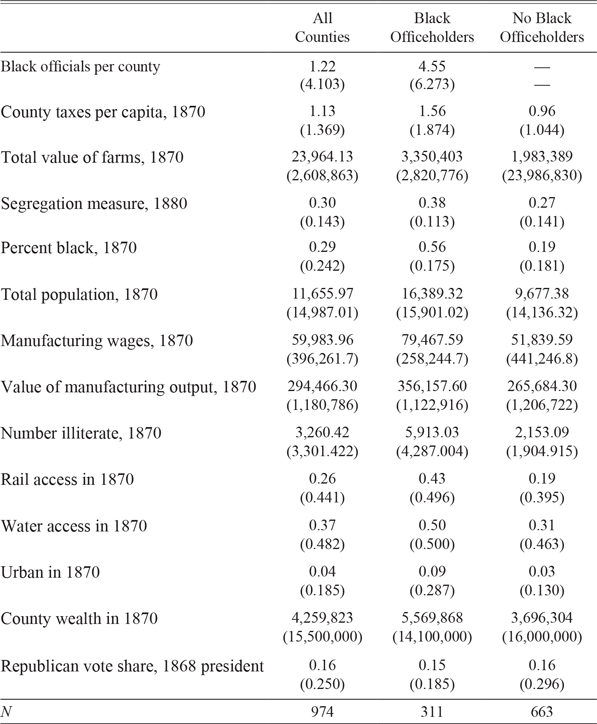
Table 2 shows the summary statistics of county-level information. It also shows means by whether the county had a black officeholder. Nearly one-third of all Southern counties had a black officeholder during Reconstruction. For the counties that were represented by black officeholders, they averaged more than four officeholders during Reconstruction. There are some differences between the counties represented by black officeholders and those that were not. For example, officeholders were more likely to serve in urban counties but slightly less likely to serve in counties with large Republican vote shares. Per capita taxes, farm values, manufacturing wages, and manufacturing output are all larger in counties that had black officeholders.
SUMMARY STATISTICS FOR SOUTHERN COUNTIES

Note: Standard deviations are in parentheses.
Source: Author’s calculations.
EMPIRICAL STRATEGY
As noted above, there were a variety of mechanisms available at the local level to increase revenue. While the specific channels varied by state, necessitating the use of state fixed effects, I test for the effect of black officeholders on county tax revenue. One strategy would be to control for economic and political differences between counties in the same state and estimate the relationship between black politicians and per capita tax revenue net of those controls. County tax revenues are a function of local economic activity, the value of property in an area, and political preferences of voters.
Using this straightforward idea as a guide, the model would be
 $${\tau _{i,s}} = \alpha + \beta Black\,Politician{s_{i,s}} + \Gamma {X_{i,s}} + {\theta _s} + {\varepsilon _{i,s}},$$
where τ is county taxes per capita in county i in state s. The key variable is BlackPoliticians, the number of black political leaders in the county.Footnote 15X includes a host of controls that may influence per capita county taxes. In this analysis, the measures include not only the value of farms and real estate and wealth (the basis for property tax assessment) but also percent black in the county (a proxy for black voting and the need of any policymaker to account for the preferences of the black electorate), total population (a proxy for the provision of poll taxes), average manufacturing wages and the value of manufacturing output (both of which proxy for industrial interests), illiteracy (a proxy for voter education), Republican vote share in the 1868 presidential election (a proxy for baseline political preferences of the electorate), the Logan–Parman measure of racial residential segregation (Logan and Parman Reference Logan2017)—a measure of physical racial separation—and indicators for rail access, water access, and whether the county has more than 10,000 residents (each of these being shifters of land values).Footnote 16 As an example, if the claims of Alesina, Baqir, and Easterly (Reference Alesina, Baqir and Easterly1999) hold and ethnic diversity leads to lower levels of public good expenditure, the effect should be captured in measures of segregation and black population shares and not via officeholders themselves. As another example, if Republican leadership led to differences in taxes, then the effect should be captured in Republican preferences, not in black political leaders themselves.
THE EFFECT OF BLACK POLITICIANS
OLS Results
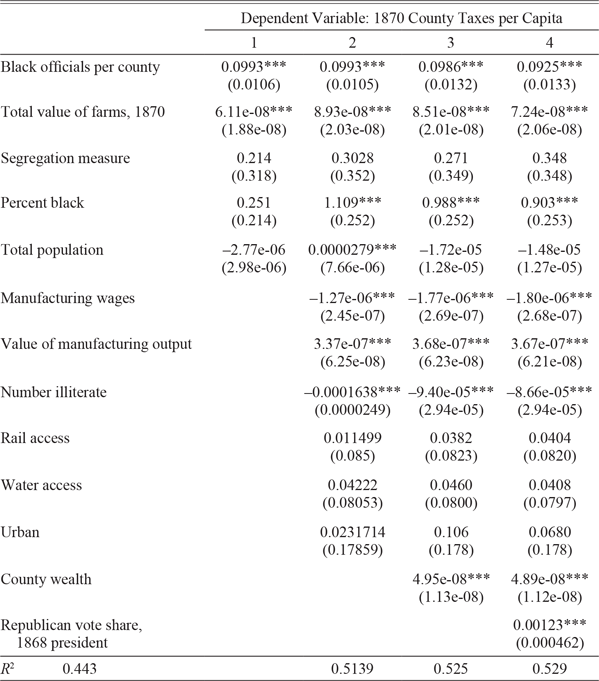
The baseline specification shown in Table 3 suggests that the effect of black politicians on within- state per capita county tax revenue is positive. The identifying assumption is that, conditional on state fixed effects and X, variation in black officeholders is uncorrelated with omitted variables that affect taxes. In regressions with fewer and more controls, the effect of politicians is quite robust and around $0.10 per officeholder. The results appear to be inconsistent with median voter model predictions, which hypothesize that the number of politicians should not matter once proxies for voter preferences are included. The results are consistent with the narrative record about the activities of black officeholders during Reconstruction.Footnote 17 At a minimum, the robust correlation between black politicians and local public finance supports the narrative about the general efficacy of black political leaders during Reconstruction. Places that elected black politicians in Reconstruction had higher taxes in 1870 than observationally similar places that did not elect black politicians. This is the first quantitative evidence suggesting a strong effect of black political leadership on local public finance.
OLS ESTIMATES OF 1870 COUNTY TAXES PER CAPITA

Notes: Robust standard errors are in parentheses. *** p < 0.01, ** p<0.05, * p<0.1.
N = 974 (Column 1). N = 825 (Columns 2–4). All regressions include state fixed effects.
Source: Author’s calculations.
Endogeneity
Is the correlation of black officeholders with taxes due to the efficacy of the black politicians or due to an unobservable constellation of local political economy that brought black men into office and allowed higher taxes? During Reconstruction, black officeholding was a function of several factors that reflected contemporaneous local political and economic realities. The first was the political power of blacks themselves but also the degree to which whites would be able to mount a successful challenge to black political goals, which featured starkly different attitudes toward redistribution, particularly across racial lines. Southern Redemption was focused on taxes. If white resistance and preferences for low levels of redistribution were an increasing function of black political success, the relationship between politicians and tax revenues could be understated. At the same time, black political leadership could have been more likely in areas that had more progressive attitudes toward racial relations or redistribution, which would overstate the relationship. This would include postbellum activities of the Freedmen’s Bureau and Union League, which were explicitly tasked with political education efforts that could have altered the terms of political competition and policy choices. This could lead to larger overall taxes if motivated voters were more likely to vote and, therefore, increase tax receipts via poll taxes. While the estimates in Table 3 show that there is a robust positive correlation between black officeholders and tax revenues, there are several facts of the historical record that would make a causal interpretation difficult. Given the opposing forces, it is difficult to say whether the correlation in Table 3 is overstated, understated, or whether the two effects offset each other.Footnote 18 In either case, the primary concern is that BlackPoliticians is correlated with local preferences for redistribution.
To address this endogeneity concern, I use an instrumental variable for black policymakers during Reconstruction: the number of free blacks in 1860. As noted by the historical record (Lynch Reference Lynch2012; Du Bois Reference Du Bois1935; Foner Reference Foner2014; Hahn Reference Hahn2005; Rabinowitz Reference Rabinowitz1982; Franklin Reference Franklin1961; Williamson Reference Williamson1965) and Table 1, a highly disproportionate number of black politicians were free blacks. As such, we would expect the within-state distribution of free blacks in 1860 to be strongly correlated with the within-state distribution of black politicians during Reconstruction.Footnote 19 The key threat to the validity of free blacks as an IV for black politicians is that the distribution of free blacks could be related to political outcomes or preferences before Reconstruction. In particular, I show that free blacks are uncorrelated with white preferences for redistribution, which is the most significant threat to the instrument since it is measured in 1860.Footnote 20
The within-state distribution of free blacks was driven by idiosyncratic differences in manumission, the length of settlement, and restrictions on between-state or between-county movement. As states began to impose increasing legal restrictions on manumission and purchased freedom, historians note that growth of the free black population was largely due to fertility after the 1840s (Wikrimanayake Reference Wikrimanayake1973). It would be difficult to argue that manumission and purchased freedom would be related to local political preferences for redistribution. These reflected idiosyncratic choices by white slaveowners, and there is little evidence that these choices were driven by features related to community-level preferences for distribution (Bodenhorn Reference Bodenhorn2011; Miller and Genovese 1974; Merritt Reference Merritt2017). The narrative record provides few examples that slaveowners did or did not manumit according to variation in local preferences.
Free blacks had little more than negligible amounts of political influence in 1860. Even in large urban areas where they were more numerous, free blacks did not enjoy political representation in local politics (Foner Reference Foner2014; Wade Reference Wade1967; Johnson Reference Johnson1919; Merritt Reference Merritt2017). In fact, Hesseltine (Reference Hesseltine1935) shows that conservative Democrats won their first victories at the start of Congressional Reconstruction, in 1868, and in areas with large numbers of free blacks. Free blacks were completely disenfranchised in the antebellum era. The only Southern state to allow free blacks to vote upon their admission to the Union was Tennessee, but they were disenfranchised in 1834. The right of free blacks to assemble had been abolished by 1835 in every Southern state (Franklin Reference Franklin1961; Johnson Reference Johnson1919). States frequently restricted their movement or banned free blacks’ immigration, and autonomous social and civic organizations among free blacks were illegal under state law.Footnote 21 Religious groups of free blacks were required to be supervised by white ministers. The citizenship status of free blacks was settled in Dred Scott v. Sandford, when the Supreme Court ruled in 1857 that all blacks were not citizens, had no standing to sue in federal court, and further had “been regarded as beings of an inferior order and altogether unfit to associate with the white race, either in social or political relations; and so far inferior that they had no rights which the white man was bound to respect” (60 U.S. 393, emphasis added). There is little in the narrative record to suggest that free blacks had any influence on local preferences for redistribution before the Civil War, such that their presence would be related to white political objectives in 1860. As such, free blacks are related to the supply of black officeholders but not to the factors that would determine white preferences for public finance at the local level. It would be inconsistent with the narrative record to argue that free blacks would be related to preferences for redistribution given their exclusion from politics (Foner Reference Foner2014), and this is borne out empirically by the lack of a correlation between free blacks and local public finance in 1860.Footnote 22
Similarly, free blacks could be correlated with vote shares for Republican or Democrat candidates for office during Reconstruction, which would reflect voter preferences, the extent of political competition, and voting coalitions that could factor into policy. A related concern would be that places with free blacks would have not only more black officeholders, but officeholders who were longer tenured and would arguably have more influence on local issues than those with shorter tenures. Still another concern would be that free blacks lived in areas with higher levels of political participation during Reconstruction precisely because free blacks were more likely to seek office. Each of these concerns can be addressed empirically.
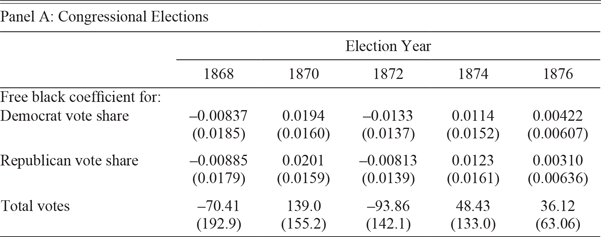
Since Republicans were generally much more supportive of black enfranchisement and Reconstruction policy, the vote share differences can be considered a proxy for political preferences. In Table 4, I show the relationship between the number of free blacks in a county in 1860 and political outcomes over the entire Reconstruction era. Panel A of Table 4 shows that free blacks are unrelated to vote outcomes in any Congressional election between 1868 and 1876. In addition, they have no correlation with the total number of votes cast in those elections.Footnote 23 In Panel B of Table 4, I analyze the officeholders themselves and find that free blacks are unrelated to the average starting year in office, length in office, or year of exit from office for black officeholders. In Panel C of Table 4, I investigate the relationship between voter registration by race and free blacks in 1860 using detailed voter registration recorded by Hume and Gough (Reference Hume and Jerry2008).Footnote 24 The results in Panel C show that the distribution of free blacks was unrelated to black, white, and total voter registration for state constitutional conventions required by Congressional Reconstruction. Moreover, free blacks are also unrelated with the black share of total voter registration. Overall, there is little empirical support for the argument that free blacks were correlated with any measure of political preferences during Reconstruction or at the beginning of black enfranchisement.
FREE BLACKS IN 1860 AND RECONSTRUCTION-ERA POLITICAL OUTCOMES Notes: Robust standard errors are in parentheses. N = 828. Regressions include value of farms in 1870, Logan–Parman segregation measure, percent black, total manufacturing wages, value of manufacturing output, number illiterate, rail access, water access, urban county, county wealth, and state fixed effects. Robust standard errors are in parentheses. N = 311 (counties with black officials). State fixed effects included. Notes: Robust standard errors are in parentheses. *** p < 0.01, ** p < 0.05, * p < 0.1. N = 567. State fixed effects included. Voter registration data are from Hume and Gough (Reference Hume and Jerry2008). Source: Author’s calculations.


IV Estimates
The effect of black officeholders on public finance is estimated in a standard two-stage least squares (2SLS) framework where free blacks are used as an instrument for black officeholders:
 $${BlackPolitician{s_{i,s}} = \varphi + \eta FreeBlack{s_{i,s}} + \Lambda {X_{i,s}} + {\rho _s} + {\varepsilon _{i,s}}}$$
 $${{\tau _{i,s}} = \alpha + {\beta _{IV}}BlackPolitician{s_{i,s}} + \Gamma {X_{i,s}} + {\theta _s} + {\varepsilon _{i,s}}}$$
To motivate the interpretation of the IV estimates, it is useful to think of the experimental analog. Locations with few free blacks serve as a control group, and those with more free blacks serve as a treatment group. If free blacks influence the number of black officeholders and black politicians influence public finance, we would expect to see larger per capita tax revenues in counties with larger free black populations.Footnote 25 If the exclusion restriction holds, this identifies the causal effect of politicians since free blacks, conditional on the controls, have no direct effect on 1870 per capita county tax revenue other than their effect on the number of black politicians.
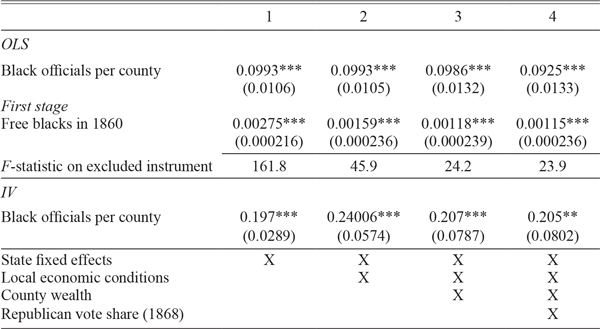
Table 5 shows the results from the first- and second-stage specifications, as well as the OLS relationship for comparison. The estimates from the first stage suggest that for every 1,000 free blacks in a county, there was an additional black officeholder. Essentially, a one-standard-deviation increase in the number of free blacks in a county results in an additional black official. The instrument is quite strong—the F-statistic on the excluded instrument is well above 20 in all specifications, all of which include state fixed effects.Footnote 26 Even with the set of controls in X, which includes factors such as urban county, population size, and economic factors, the estimated effect of free blacks on black officeholders is quite strong.Footnote 27
IV ESTIMATES FOR BLACK ELECTED OFFICIALS

Notes: Robust standard errors are in parentheses. *** p < 0.01, ** p < 0.05, * p < 0.1. N = 825. All regressions include total value of farms in 1870, Logan–Parman segregation measure, percent black, and total population. Column 2 includes manufacturing wages, value of manufacturing output, number illiterate, rail access, water access, and urban county. Column 3 includes county wealth. Column 4 includes Republican vote share in the 1868 presidential election. All regressions include state fixed effects.
Source: Author’s calculations.
The key is how β OLS differs from β IV. The IV estimates in Table 5 show that the OLS results likely understate the effect of black officeholders on per capita county tax revenues. While the OLS estimates were close to $0.10 per black elected official, the IV estimates are more than double the OLS estimates, $0.20.Footnote 28 From estimates of hourly wages in 1870, this is more than one hour’s wage for an unskilled worker at the time.Footnote 29 More specifically, a one-standard-deviation increase in black officeholders increases per capita county taxes by 0.62 standard deviations, a sizable effect.
Another way to scale the size of the results is historical. In 1874, Southern whites in South Carolina organized a Taxpayer’s Convention to protest high local taxes during Congressional Reconstruction. The commissioned report noted that total taxes were increased by $0.38 per capita since the end of the war providing for an extensive amount of public goods that were not available in the antebellum era (Du Bois Reference Du Bois1935). The IV results here suggest that each additional black politician could explain roughly half of the increase in per capita taxes from the antebellum era to Reconstruction, which was the focus of contemporaneous political protests. All of these results support the same conclusion—black elected officials had a large and significant causal effect on local public finance.
ROBUSTNESS
In thinking through the experimental analog to the IV approach, it should be the case that different treatments would yield different effects. It should also be the case that controlling for majority black electorates would not alter the results if they were driven by politicians as opposed to the electorate. Last, if the IV estimates are biased, the effect should remain after the end of Reconstruction and its attendant voting restrictions as the tax effects would be driven by white political preferences and not black political efficacy.
Placebo Tests
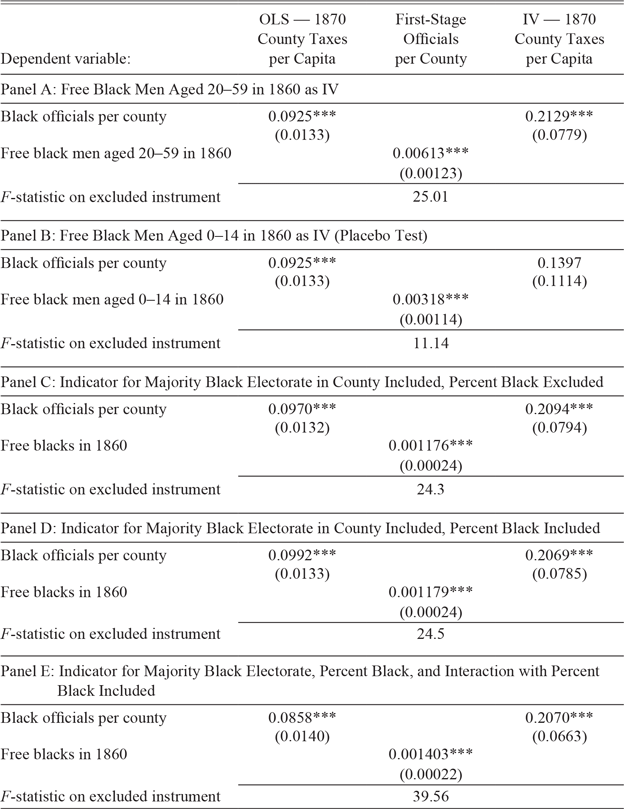
Free blacks who would be most likely to serve as officials should be more strongly related to tax revenues than those that were unlikely to hold office. Black officeholders during Reconstruction were almost universally males of prime age. Those who were children during the antebellum era would not be old enough during Reconstruction to serve in office, and therefore would not be an appropriate instrument for black officeholders, but can act as a placebo test. Additionally, if local political preferences favorable to free blacks were related to higher levels of free black fertility, which was seen as the key growth of the free black population after the 1840s (Wikrimanayake Reference Wikrimanayake1973), a strong relationship between free black children and black officials would be suggestive evidence that the exclusion restriction does not hold. Table 6 replicates the regression in Column 4 of Table 5 by age cohorts of free black men in 1860. Free black men aged 20–59 in 1860 are well correlated with black officeholders, and the IV estimate for this group is slightly larger than the results in Table 5, which used the total free black population. This does not hold for males aged 0–14 in 1860, the oldest of whom who would not have been 30 years old at the very end of Reconstruction.Footnote 30 Table 6 shows that they are less well correlated with black officeholders and the IV estimate is one-third smaller than the estimate for men aged 20-59.Footnote 31 The result shows that the effect is strongest for men who would have been the most likely to serve as officeholders given their age during Reconstruction.
EFFECTS OF POLITICIANS BY FREE BLACK DEMOGRAPHICS AND CONTROLS FOR BLACK ELECTORAL MAJORITIES

Notes: Robust standard errors are in parentheses. *** p < 0.01, ** p < 0.05, * p < 0.1. Note: N = 825 in all regressions. All regressions include Republican vote share in 1868 presidential election, total value of farms, Logan–Parman segregation, percent black (except Panel C), manufacturing wages, value of manufacturing, number illiterate, rail/water access, urban county, county wealth, and state fixed effects.
Source: Author’s calculations.
Controls for Black Electorate Majorities
The estimated effect for black politicians may be due to black voting as opposed to politicians.Footnote 32 It could also be the case that white politicians were more supportive of black political goals in areas where blacks were the electoral majority. While the specifications in Table 5 controlled for percent black, they did not include an indicator for a majority black electorate. If the effect of politicians is due to majority black electorates, the inclusion of a measure of black electoral majorities could diminish the result. On the other hand, if politician race has an effect, it will not be due to black electoral majorities alone. In Table 6, I test this possibility in three ways. First, Panel C shows the results where percent black is replaced with an indicator for black electoral majority. Second, Panel D includes the indicator, percent black, and the indicator interacted with percent black. In all three instances, the control for black majority counties, even allowing black population effects to differ in majority black counties, does not alter the effect of black politicians on county taxes.
WAS THE EFFECT OF BLACK POLITICIANS PERSISTENT?
Given the size of the results in Tables 3 and 5, it is important to investigate whether they were long-lived. Persistence could be evidence against a causal interpretation of the effect of black politicians. If the results for 1870 taxes are driven by local time-invariant electoral preferences for redistribution, then the effect of black politicians would not be due to their presence. Even more, to the extent that blacks began to experience voting restrictions in the waning years of Reconstruction, arguments about the persistence of electoral preferences are implicitly about the preferences of white voters as free blacks were not enfranchised before Congressional Reconstruction and black voting restrictions were in place after.Footnote 33 Since these black political leaders were not in office by the mid-1870s and the Freedmen’s Bureau ended in 1872, the effects on 1880 taxes act as a check to see if local preferences for greater public goods provision were persistent.
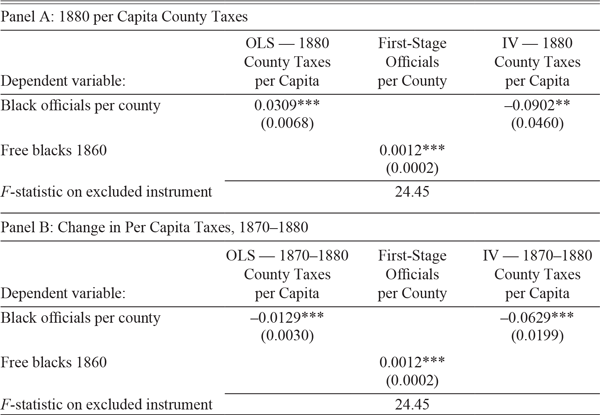
The results in Table 7 show that there was no persistent effect of black political leaders. In 1880, Reconstruction-era black politicians were slightly positively related to taxes in OLS but negatively related to taxes in the IV, implying that the counties where more black politicians served during Reconstruction had lower per capita taxes than others in 1880.Footnote 34 This is evidence that 1870 expenditures were not substitutes for federal outlays, as counties with black officials spent less in 1880 than other counties.
1880 TAXES AND CHANGES IN TAXES 1870–1880

Notes: Robust standard errors are in parentheses. *** p < 0.01, ** p < 0.05, * p < 0.1. N = 825 in all regressions. Regressions include Republican vote share in 1868 presidential election, total value of farms, Logan–Parman segregation, total population, percent black, manufacturing wages, value of manufacturing output, number illiterate, rail access, water access, urban county, county wealth, and state fixed effects.
Source: Author’s calculations.
The second panel of Table 7 looks at the changes in per capita county taxes from 1870 to 1880. There, we see that the removal of black politicians had a negative effect on tax changes from 1870 to 1880. Indeed, a one-standard-deviation change in the number of black politicians (which, in this instance, would mean more black politicians being removed from office) results in a 0.85-standard-deviation change in per capita county tax differences between 1870 and 1880. This essentially implies that the removal of black politicians at the end of Reconstruction more than reversed the differences in taxes seen earlier. Tax revenue per capita for counties without a black politician went from $0.96 in 1870 to $0.98 in 1880, while for counties with black politicians, revenue went from $1.56 in 1870 to $0.89 in 1880. There is little evidence that the areas which had black politicians had long-standing preferences for redistribution that outlived the tenure of black officeholders.
THE IMPACT OF BLACK POLITICIANS
Given that black politicians have an impact on tax revenue in 1870, the open question is whether those revenue effects impacted the two areas of agreement among black politicians. As discussed earlier, black politicians articulated reforms along two main channels—land redistribution and education. Below, I present suggestive evidence of the effects of black politicians’ tax policies, via taxes in 1870, on land reform and education.
Land and Black Politicians
I analyze land redistribution in general, a necessary condition for racial redistribution.Footnote 35 To estimate the effect of taxes in 1870 on land distribution in 1880, I estimate the following regression:
 $${\Delta Farm{s_{i,s}} = \alpha + \eta {\tau _{1870,i,s}} + \Gamma {X_{i,s}} + {\theta _s} + {\varepsilon _{i,s}}}$$
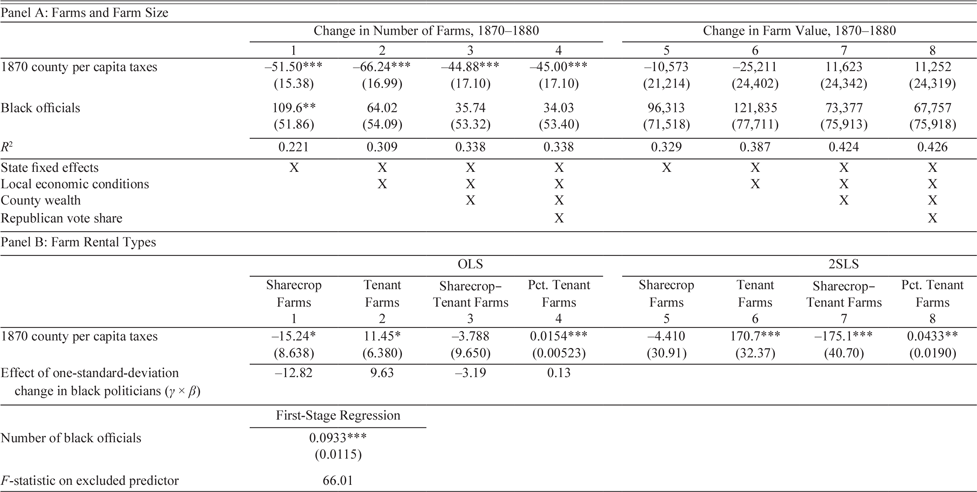
The change in the number of farms in county i is estimated from 1870 to 1880 (∆Farms = 1880−1870). The regression tests whether higher taxes in 1870 led to more farms in the same county, which would be suggestive evidence of the breakup of existing farms, a goal of black politicians. The results in Table 8 show that higher taxes in 1870 were associated with fewer farms in the same county in 1880, exactly the opposite effect of the tax policies advocated by black politicians. In Panel A of Table 8, the effect of taxes on changes in farm size is negative. Panel A includes a dichotomous indicator for whether the county had a black politician, to investigate whether there was an effect due to politicians as opposed to taxes. The results there show that the tax effect does not change with the inclusion of the indicator. The consolidation of farms over time, however, suggests that this was not successful. Another goal of black politicians was to lower the price of land to make it more affordable for blacks to purchase. Panel A also shows that farm value was not affected by tax policy. Overall, there is little evidence that tax policy broke up farms or lowered farm value.Footnote 36
TAXES, BLACK OFFICIALS, LAND REFORM, AND LAND TENANCY

Notes: Robust standard errors are in parentheses. *** p < 0.01, ** p < 0.05, * p < 0.1. All regressions include state fixed effects. N = 974. Regressions include total value of farms in 1870, the Logan–Parman segregation measure, percent black, and total population. Panel A, Columns 2 and 6: manufacturing wages, value of manufacturing output, number illiterate, rail access, water access, urban county, and wealth. Columns 3 and 7: county wealth in 1870. Columns 4 and 8: Republican vote share in 1868. Panel B: all controls listed above.
Source: Author’s calculations.
The tax policy could have spurred landowners to put more land in production, however, and this could have altered the terms of labor negotiations for black (and white) farmers. In Panel B of Table 8, we see that taxes had a positive correlation with the share of all rental farms that were tenant farms, which suggests a marginal improvement in the economic position of landless farmers. The results estimate the value of politicians on rental contract type by calculating η × β IV × σ BlackPoliticians, which estimates the effect of a one-standard-deviation change in the number of black politicians on the number and share of farms by rental type, respectively (under the assumption that β IV is the causal effect of politicians on taxes). As an additional check, Panel B also shows results where black officials were used as an instrument for per capita tax revenues, to scale the results by the effect of black officials on taxes. There, we see that, when scaled by the effect of black politicians on per capita taxes, each additional dollar of per capita tax revenue is correlated with an increased share of tenant farming by 4 percent. The results show that while black landownership did not appear to be influenced by tax policy, the relative position of farmers was related to tax policy.Footnote 37
EDUCATION AND BLACK POLITICAL LEADERS
The largest impetus for tax policies advocated by black politicians was public education (Du Bois Reference Du Bois1935; Foner Reference Foner2014; Hahn Reference Hahn2005; Franklin Reference Franklin1961). As with the land data, we do not have comprehensive race-specific school expenditure data for the Reconstruction and immediate post-Reconstruction eras (Margo Reference Margo1990). I begin by first estimating the relationship between taxes and educational outcomes and then using the effect of black politicians on taxes to estimate the effect attributable to black politicians. First, I estimate
 $${EducationOutcom{e_{i,s}} = \alpha + \gamma {\tau _{1870,i,s}} + \Gamma {X_{i,s}} + {\theta _s} + {\varepsilon _{i,s}}}$$
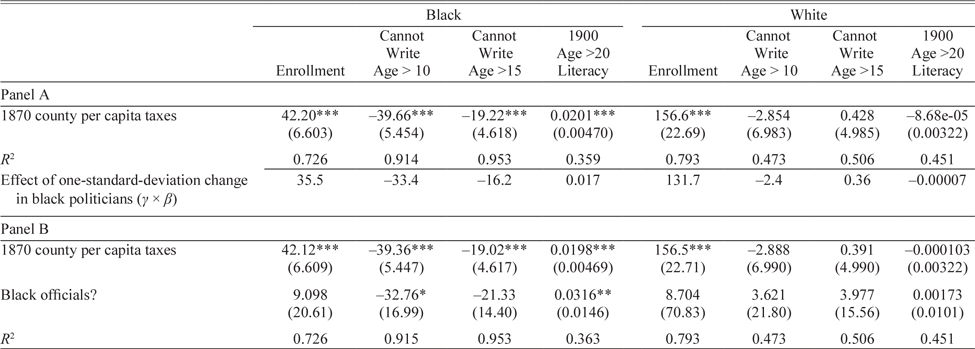
Then, we can estimate the value of politicians on educational outcomes by calculating γ × β IV × σ BlackPoliticians, which estimates the effect of a one-standard-deviation change in the number of black politicians on the educational outcome of interest via the effect of black politicians on taxes (under the assumption that β IV is the causal effect of politicians on taxes). The results for a number of educational outcomes are given in Table 9. The results imply that a one-standard-deviation increase in the number of black politicians correlates to an additional 39 black students enrolled in school and an additional 150 white students enrolled in school. The results also imply that the same change led to a decline in black illiteracy—a one-standard-deviation increase in black politicians correlates to reduced black illiteracy at age 10 by more than 30 persons and illiteracy at age 15 by 15 persons.
TAXES, BLACK OFFICIALS, AND EDUCATIONAL OUTCOMES

Notes: Robust standard errors in parentheses. *** p < 0.01, ** p < 0.05, * p < 0.1. N = 974. Regressions include total value of farms in 1870, the Logan–Parman segregation measure, percent black, total population, manufacturing wages, value of manufacturing output, number illiterate, rail access, water access, urban county, county wealth, and state fixed effects.
Source: Author’s calculations.
Another approach is to look at adult literacy after the end of Reconstruction. To do so, Table 9 presents estimates where the dependent variable is literacy of those 21 and above in 1900, who would have been of school age during the time of black officeholding. The results show that a one-standard-deviation increase in black politicians correlates with increased adult black male literacy by 1.6 percentage points. Given the baseline literacy rate of black men above the age of 21 was 50 percent in 1900 (Margo Reference Margo1990), this implies a more than 3 percent increase in black male literacy due to black politicians. While black politicians also play a role in white school enrollment, they are not significantly related to white literacy rates.Footnote 38
CONCLUSION
The unique history of Reconstruction offers an opportunity to investigate the effect of politician race on public finance. I showed that counties with black politicians had much larger county tax revenues than others. Black politicians were related to significant public goods provision. The counties where they held office had higher rates of tenant farming, school enrollment, and literacy rates for whites and blacks and showed more convergence in black-white literacy rates. The specific policy of education reform advanced by black politicians appears to have had a large effect on human capital among blacks. The causal effect of politicians was acute—black politicians during Reconstruction mattered.
Overall, this study provides the first quantitative evidence consistent with the historical arguments of Du Bois (Reference Du Bois1935), Foner (Reference Foner2014), Franklin (Reference Franklin1961), Hahn (Reference Hahn2005), Williamson (Reference Williamson1965), Coates (Reference Coates2017), and others who argued with narrative evidence that black politicians were important during the Reconstruction era. Building on those narrative histories, this study identified an instrument to yield a plausibly causal estimate of black politicians on local public finance and the specific areas of policy agreement, allowing for tests of the efficacy of the policies they advocated. Further, the narrative guided the search for specific policies and found that, while land reform failed, the educational priorities of black politicians had a large impact on literacy among both blacks and whites. True to being a political effect, the result holds for legislative officials but is not evident for judicial or executive officeholders.
The effect of black politicians, however, was not persistent. When whites reclaimed control of political offices during Redemption, tax revenue in areas where blacks held political leadership declined substantially. While the effect of the end of black officeholding was equally dramatic, Redemption policy also signaled a dramatic intensity of social and legal racial restrictions in the South. The combined economic, social, and political changes at the end of the nineteenth century were far more persistent than the Reconstruction-era policies and are a signature of American politics in general (Alesina, Glaser, and Sacerdote Reference Alesina, Glaser and Sacerdote2001). The dramatic gains to black political involvement and their nearly complete reversal is an important historical caution to models that posit the permanence of political change with extension of the franchise. Indeed, the reversal of Reconstruction policy has been used as an analogy for the rise of contemporary ethno-national movements in the United States (Coates Reference Coates2017). The framework outlined here could be used to consider a number of additional outcomes. While the results so far have confined themselves to taxes, education, and land reform, additional outcomes to consider would include returns to education, occupational structure, migration, and local economic growth. This would add even further empirical evidence of the effect of black policymakers and would make a substantial contribution to our understanding of the Reconstruction era, its long-term effects on outcomes, and the role of candidate demographics in shaping policy and individual outcomes.