

Introduction
The analysis of structure has a potential which has not been exhausted in archaeology
Hodder 1982b, 9
The concept of ‘structured deposition’ – in its many and varied guises – has been prevalent within archaeological interpretation since the early 1980s. This persistence says a great deal about its importance and success as a concept. The idea clearly struck a chord in the early days of postprocessualism and has continued to resonate ever since. Following publication of the key paper relating to the idea (Richards and Thomas 1984), which focused on structured deposition during the Late Neolithic in Britain, the concept has spread far and wide – into other periods (e.g. Hill 1995; Clarke 1997) and other parts of the world (e.g. Chapman 2000; Pearce 2008). It has featured in dozens of academic papers and probably hundreds of archaeological site reports. Significantly, while reflecting recently on the lasting influence of his seminal 1982 edited volume Symbolic and structural archaeology, Hodder (2007, 201) specifically mentioned ‘the idea that refuse can be structured to be socially active’ as one of the main concepts which has survived the test of time. ‘Structured deposition’ now merits definitions in archaeological dictionaries (Darvill 2008) and textbook glossaries (Greene and Moore 2010, 320).
Given the very widespread take-up of the concept and considerable number of years which have passed since its inception, it is surprising that the idea of structured deposition has seen so little critical attention. People have tended to develop or transform the concept, rather than dismiss or argue directly against it. This too speaks volumes for its resilience and flexibility as an idea. Significantly, for some, the concept has actually come to be an interpretation in itself rather than a means of getting towards one. The paper presented here makes the most of what is in fact a surprisingly rarely taken opportunity to chart the history of one idea over the course of its lifetime, thus contributing to the history of archaeological interpretation more broadly. It investigates where the concept came from, but perhaps more importantly how it has subsequently been adapted and transformed. It also addresses the issue of whether the concept remains relevant today, and considers where it might be taken in future.
Richards and Thomas 1984
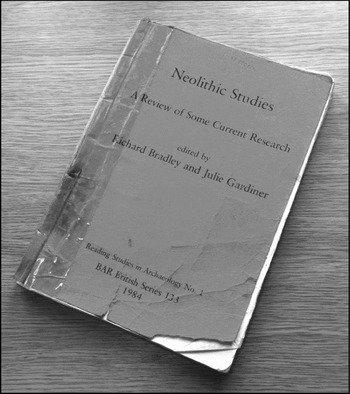
Any paper focusing on structured deposition really has to begin with Richards and Thomas's 1984 paper ‘Ritual activity and structured deposition in Later Neolithic Wessex’ (figure 1). As we shall see, Richards and Thomas did not necessarily ‘invent’ the concept, in its broader sense at least – their work drew substantially on the earliest postprocessual theorizations of depositional practice, and indeed, with hindsight, elements of the concept can be detected in some even older research. They did, however, coin the term ‘structured deposition’, and pushed interpretations of past material culture patterning into completely new territory.
The University of Liverpool library copy of the book in which Richards and Thomas's 1984 paper was published.

As the title of their paper suggests, Richards and Thomas were concerned with the relationship between ‘ritual’ activity and the deposition of material culture. They began by highlighting the problem of interpreting the Late Neolithic henges of Wessex. A core question at that time was whether these monuments had a ‘ritual’ function. The generally unusual character of henges suggested that they may well have had a special ceremonial purpose. However, the large amounts of ‘rubbish’ and post-built structures found at some sites had confused the issue, suggesting a possible ‘domestic’ function as well or instead (Richards and Thomas 1984, 189; see also Bradley 2005, 10–16).
Richards and Thomas moved on to discuss the problems associated with the definition of ‘ritual’ generally, noting the tendency for it to be used as ‘a catch-all designation for anything which defies a crudely utilitarian explanation’ (Richards and Thomas 1984, 189). One way out of this situation, they argued, was to employ ‘a systematic approach to ritual, which is specific to archaeology itself and allows the examination of both symbolism and structure as embodied in material culture’ (ibid.). The fundamental element of the argument they put forward was the fact that ‘as ritual activities involve highly formalised, repetitive behaviour, we would expect any depositional patterns [associated with these] observed in the archaeological record to maintain a high level of structure’ (ibid., 191) – the original core concept of ‘structured deposition’.
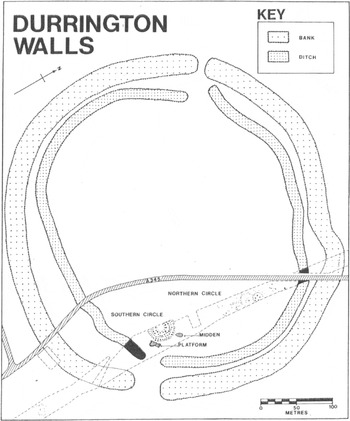
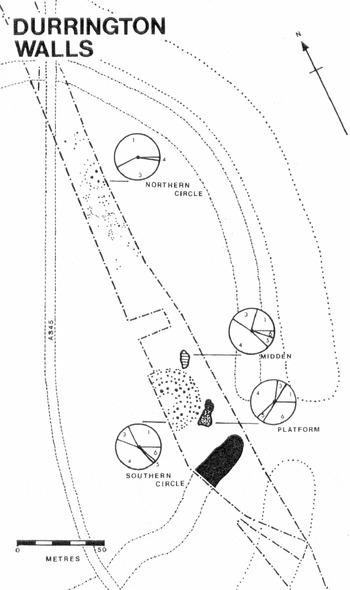
The site they selected to test out these ideas was Durrington Walls (figure 2), a well-known and extensively excavated henge in southern England (Wainwright and Longworth 1971; see papers in Larsson and Parker Pearson 2007 for a summary of recent excavations). The materials with which they chose to investigate the ‘ritual’ patterning of material culture were pottery (Grooved Ware), animal bone and, to a lesser extent, flint. In order to assess the deposition of pottery at Durrington Walls, Richards and Thomas defined a Grooved Ware ‘design structure’ with six ‘stages’ (types) of decoration (ibid., 194–95). Essentially, different types predominated in different places (figure 3). They noted that other forms of material culture (flint and bone tools) displayed a similar degree of variability (ibid.). On the basis of this patterning, they argued that ‘the deposition of particular items was being controlled across the site’ (ibid., 204). The second level of patterning investigated was the distribution of flint and pottery specifically within the Southern Circle. They highlighted ‘a striking pattern of mutual avoidance . . . the post holes containing the highest frequencies of flint flakes are those which contain little or no Grooved Ware’ (ibid.). Interpreting these findings, they argued that ‘such clear patterning surely points to a pattern of formal deposition’ (ibid.).
Plan of Durrington Walls, as excavated prior to 1984 (Richards and Thomas 1984, figure 12.2).

Spatial representation of the variation in Grooved Ware design stages between features at Durrington Walls (Richards and Thomas 1984, figure 12.3).

The distribution of animal bones was, in many senses, fairly ‘complex’ (ibid., 207) to interpret. Overall, as with the pottery, they argued on the basis of differential distributions that ‘a set of rules governed the deposition of appropriate elements in different parts of the site’ (ibid.), going on to suggest that ‘part of the symbolic restructuring of the world which took place within henges involved the deliberate selection of wild animals, their use in feasting and their purposeful deposition in specified locations’ (ibid.). Interestingly, following on from this, they briefly considered other examples elsewhere of odd deposits involving animal remains, which they noted were often associated with other ‘high-quality’ or ‘unusual’ material. They concluded by saying that ‘the deposition of valued items – in isolated pits, in pits inside causewayed enclosures, in henges and in long barrow ditches – seems to have been an important element of ritual practice’ (ibid., 214).
In summing up the results of their analysis, Richards and Thomas reiterated their key point: ‘our analyses were designed to show whether the finds from Durrington Walls exhibit the clearcut spatial patterning that might be expected in a ritual context. The results of this investigation do suggest that this is the case . . . ritual is not beyond the realm of archaeological inference’ (ibid., 215).
Rereading Richards and Thomas 1984 in 2012
On rereading Richards and Thomas's classic paper in 2012, it comes across as a very optimistic study, with a considerable amount of work behind it. It made a number of important interpretive points, and took the analysis of material culture patterning into new territory. As discussed above, its influence has been long-lasting for very good reasons. At the same time, however, the paper does come across as slightly naive in places, and arguably flawed in others (see also Brück 1999b, 316; Thomas 1999, 81; 2007, 149; 2011; Albarella and Serjeantson 2002; Pollard 2008, 43). Before highlighting three of the main problematic issues, I want to make it very clear that comparable problems would be expected in any paper which is almost three decades old, especially one written so close to the beginning of a pioneering phase of archaeological theorization which was explicitly experimental in its methodology. It is worth noting that Thomas recently revisited the paper (having gone back to excavate at Durrington Walls) himself, and consequently has touched briefly upon some of these problems as well (Thomas 2011, 380–83).
The first point of criticism concerns the paper's approach to archaeological process. One key omission is the almost total absence of any serious consideration of the effects of time in creating the patterns observed (see also Thomas 2011, 380). Elements of the site are compared unilaterally, without any consideration of the fact that they may not always have been in use at once, in a monument which even then was thought to have been in use for several centuries (Wainwright and Longworth 1971, 225; Richards and Thomas 1984, 214). Additionally, the paper might also be criticized for its comparisons of depositional patterning between contexts which are not necessarily directly comparable; for example, the ways in which material culture would have come to be deposited in the Ditch, the Southern Circle and the Midden would almost certainly have been very different.
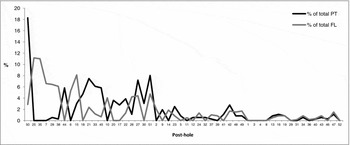
Second, in pushing the interpretation of material culture patterning to new limits, it might also be argued that the case for that patterning was slightly overstated. For example, while it is certainly true that within the Southern Circle some post-holes with large amounts of flint contained small amounts of pottery and vice versa (visible to the left in figure 4), overall it is difficult to support the suggestion of ‘a pattern of mutual avoidance’ (ibid., 204). In fact, 31 out of 52 post-holes contained directly comparable quantities (here defined as a difference of < 2%) of both materials (visible to the right of figure 4).
Graphic representation of the relative amounts of pottery and flint in each post-hole within Circles A and B of the Southern Circle. In order to make the two materials directly comparable, the quantity of sherds/flakes in each post-hole was calculated as a percentage of the total number. To make the graph more straightforward to read, the x-axis has been arranged in order of the percentage difference between the two materials rather than in order of feature number; those with large differences fall to the left-hand side, those with small to the right. Data from Richards and Thomas (1984, figure 12.6).

Interestingly, a final point of criticism – one which is absolutely fundamental to this paper – was actually touched upon by Richards and Thomas themselves right at the end of their discussion in 1984. It concerns the interpretive leap made from (a) an observation of patterns of variability within excavated material to (b) the assertion that these patterns were created intentionally through ‘ritual’ deposition. Having reiterated the key argument of their paper – that ‘the performance of ritual involves formalised repetitive actions which may be detected archaeologically through a highly structured mode of deposition’ – they went on to point out, somewhat contradictorily, that ‘domestic activity may also involve a high degree of structure’ (ibid., 215). The difference between the archaeological signature of ‘ritual’ and everyday ‘domestic’ activities might thus be seen as, ultimately, very much blurred.
The issue of how to interpret material patterning – and whether it was created intentionally or not – is one which will be considered in detail towards the end of this paper. Next, in order to understand better where Richards and Thomas were coming from in their paper, and also to begin this history of ‘structured deposition’ at the beginning, we turn to other discussions of depositional practice immediately prior to 1984.
Postprocessualism and the origins of ‘structured deposition’
Processes of deposition (and thus also their interpretation) are a fundamental element of archaeology. As a result, archaeologists have tried to ‘capture’ them in various ways – from Worsaae's ‘closed assemblages’, through Pitt-Rivers's sequencing of material culture via section drawings, to Wheeler's regimented boxes – since controlled excavation began (Lucas 2001; Trigger 2006). Significantly, many authors also speculated on the purposes of Neolithic depositional practice in particular over the course of the twentieth century, often alluding to possible ‘ritual’ motives, if not always exactly in those words (e.g. Stone and Young 1948; Field, Matthews and Smith 1964, 369; Case 1973).
In terms of the more immediate origins of Richards and Thomas's conceptualization of ‘structured deposition’, it is possible to identify two main strands of influence. The first is the general postprocessual theorization of the relationship between ideology/belief and the deposition of material culture, focused mainly on ethnoarchaeological studies. The second is a widespread movement within British prehistoric archaeology towards an interest in Late Neolithic ‘ritual’ and the idea that ‘deposition’ may have constituted a meaningful practice in itself.
Postprocessual archaeology developed, at least in part, directly out of a dissatisfaction with earlier theorizations of material culture patterning. In what is probably the clearest outline of the early postprocessual agenda, Hodder explicitly criticized Clarke for suggesting that ‘depositional theory can be separated from interpretive theory’ (1982b, 6), and the New Archaeology for viewing patterning within archaeological deposits as merely a passive reflection of what people had done in the past (ibid., 4). In making the case for an ‘active’ role of material culture, it was argued that artefacts had the capacity to intervene in people's ideologies and social worlds.
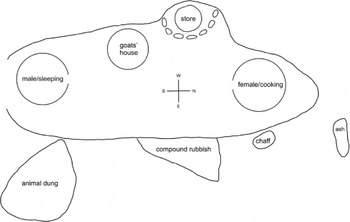
Much early postprocessual ethnoarchaeological work focused on deposition, and the role played by ideology/beliefs/symbolism in creating patterning within the modern ‘archaeological’ record. For example, in her 1981 paper concerned with ‘possibilities for the future’ in animal bone analysis, Moore discussed how the beliefs of gypsies structured the way in which they disposed of their rubbish (1981, 90). In that imagined future, she went on to publish her highly influential study of rubbish disposal in Kenya, within which she outlined the ways that the Marakwet people's conceptual boundaries and beliefs served to create highly structured material patterning in and around their compounds (Moore 1982; 1986; see figure 5). Around the same time, Hodder was attempting to get at very similar issues in his own ethnoarchaeological work amongst the Nuba (e.g. Hodder 1982a, 155–61).
Rubbish disposal patterns within ‘a typical Endo compound’ (after Moore 1986, figure 17).

The second strand of influence detectable within Richards and Thomas's formulation of ‘structured deposition’ was more directly related to developments in British prehistory. Given the character of British Neolithic archaeology – known more for its ceremonial monuments than for its often ephemeral ‘domestic’ sites – it is unsurprising that there should be a deep-seated interest in ‘ritual’ amongst those working in the period. However, in the first few years of the 1980s, the topic took on a new significance (e.g. Braithwaite 1984; Thorpe and Richards 1984). Around the same time, roughly the same group of archaeologists began to take seriously the idea that ‘deposition’ in itself may have been an important social practice. For example, in a discussion which was in many ways several years ahead of its time, Bradley (1975, 34 and 20) considered the deliberate filling of pits at various sites in southern England, and the placement of the skulls of red deer within the henge at Maumbury Rings. A key distinction drawn by several authors was that between what were often termed ‘formal’ deposits of rare/unusual objects (large slabs of decorated pottery, polished flint axes, complete skulls and so on) and more abstract material patterning (e.g. the overrepresentation of particular flint tools) created by the selection of certain objects for deposition (see, for example, Cleal 1984, 148; Thomas 1984, 167). Alongside this work, similar issues were also being considered – if not as heavily theorized – within the Iron Age, particularly in relation to the deposition of material within grain storage pits (Cunliffe 1983, 157–65; Grant 1984; Walker 1984).
The legacy of structured deposition: interpretations, 1985–2011
The following section charts the subsequent development of ‘structured deposition’, highlighting the various ways in which the concept has been transformed. Within this historical overview, I offer relatively little in the way of direct critique. It is not necessarily my intention to comment on individual papers and the specific approaches taken within them, but rather to highlight general trends and interests over the past three decades. The enormous success and staying power of the concept has ensured that huge numbers of papers, book chapters and site reports have been devoted to discussions of deposition. I have attempted to mention all of the key texts within the historical overview which follows, but cannot claim to have conducted an entirely exhaustive review.
As a result of this multiplicity of publications, a wide variety of equivalent terms has been used in place of, and often interchangeably with, the term ‘structured deposition’: ceremonial, deliberate, formal, formalized, intentional, non-utilitarian, odd, peculiar, placed, ritual, selected, special, symbolic, token and unusual deposits have all featured as well. Any history of ‘structured’ deposition must necessarily incorporate all of these, since this list of words in itself speaks volumes about the adaptability of the original idea. As we shall see, what people mean by structured deposition (and these various associated terms) also varies a great deal.
It is important to make clear from the outset that my focus in this paper is specifically ‘structured deposition’ (i.e. a particular concept in the present) rather than ‘ritual’ deposition (i.e. a suite of practices in the past) more broadly conceived; I do of course acknowledge that there can be a very close connection between the two. Consequently, I do not touch on the full spectrum of archaeological discussions concerning ‘ritual’ deposition (e.g. Walker 1995; Berggren and Nilsson Stutz 2010; Schiffer 2010) or indeed socially meaningful artefactual patterning (e.g. Clarke 1972; Grøn 2003). Equally, I focus exclusively on the Neolithic, Bronze Age and Iron Age archaeology of Britain, in relation to which the vast majority discussions of ‘structured deposition’ (specifically) have taken place. It is worth pointing out that this restricted geographical and temporal focus is primarily a consequence of recent scholarly traditions, rather than because similar deposits are not identified in other places and periods (see, for example, Clarke 1997; Chapman 2000; Pearce 2008; Berggren and Nilsson Stutz 2010; Stiftelsen Kulturmiljövård 2011). Equally, I deal primarily with certain types of deposit – material usually associated with settlements and monuments (often in amongst a wide variety of ‘rubbish’), rather than deposits which are more isolated (e.g. metalwork and metalwork hoards – see, for example, Fontijn 2002; Yates and Bradley 2010) – again because the latter have not usually been discussed under the banner of ‘structured deposition’.
In an attempt to represent the variety of interpretations associated with the concept of structured deposition as simply as possible, in the remainder of this paper I have characterized the deposits under discussion by using two main terms (italicized in the text throughout). It is vital to emphasize that they are primarily designed to describe interpretations in the present rather than practices in the past. The first category I have termed odd deposits (following Brück 1999a); an example of this might be the burial of a complete horse, whose head had been removed and placed next to a complete dog, on the base of an Iron Age storage pit within a hill fort (Grant 1984, 534). The second category I have termed material culture patterning; an example of this might be subtly different distributions of flint tools (7.8%, 5.1% and 9.1% of the whole assemblage) within each of the three circuits of a causewayed enclosure (Whittle, Pollard and Grigson 1999, 370). It is important to stress that these two ‘types’ should not be seen as distinct, but as representing two ends of what is in fact a continuous spectrum.
In drawing a distinction between these two ends of a spectrum, I am mindful of Bell's work on ‘ritualization’ (1992), which has subsequently been taken up fairly widely within archaeology (e.g. Bradley 2005; Lamdin-Whymark 2008; Berggren and Nilsson Stutz 2010). In investigating ‘ritual’ practice within social anthropology, Bell suggests that ritual should be seen not as a clearly defined category, but as a relational and context-specific concept that is brought about through practices of ‘ritualization’. She argues (Bell 1992, 74) that ‘ritualization is a way of acting that is designed and orchestrated to distinguish and privilege what is being done in comparison to other, usually more quotidian, activities’. In Bell's terms, odd deposits would be viewed as the result of clearly ritualized practices, since they were (arguably) consciously made ‘different’ from the rest. The processes through which material culture patterning came about are more complicated to tie down (as we shall see below), but certainly could be the result of ‘quotidian’ or non-ritualized practices. My own understanding of material culture patterning in relation to both ‘ritual’/‘ritualized’ and ‘non-ritual’/‘everyday’ practice is outlined in more detail within the later sections of the paper.
Finally, it is worth noting that again, for simplicity's sake, in the history which follows I have usually chosen to deal with work which focuses on the Neolithic separately from that which focuses on the Bronze and Iron Ages. This is not because I see these two strains of discussion as separate, but to ensure that my reading of a complex series of developments can be presented as clearly as possible.
The late 1980s: a slow start and some ‘heavy’ theorization
Interestingly, for the five or so years immediately following the publication of Richards and Thomas's 1984 paper, there were relatively few published discussions of their ideas. While people continued to consider ‘deliberate’ deposition as a practice (e.g. Pryor, French and Taylor 1985; Evans 1988, 47), it was not until the early 1990s that structured deposition really took off as a concept (see the next section). A delay in the widespread uptake of key theoretical concepts within prehistoric archaeology in Britain more generally has been noted elsewhere (Cooper, in press). In this particular case, it was perhaps inevitable that there would be a pause, as people took stock of the ideas put forward in 1984, recalibrated them to suit their own sites, carried out the relevant analyses and then published that work. Additionally, following the initial impact of postprocessualism in the early 1980s, several of the main protagonists went on to publish book-length texts developing the theoretical agenda (Hodder 1986; Shanks and Tilley 1987a; 1987b). A prominent discussion within these and associated papers (e.g. Barrett 1988; Hodder 1989) was the extent to which material culture could be read as a kind of ‘text’. Consequently, ideas relevant to, and in some cases at least partly derived from, Richards and Thomas's work were being discussed, but mostly in abstract theoretical terms rather than specifically in relation to the Neolithic.
Having highlighted a delay in its uptake, it is important to stress that the more specific concept of structured deposition was not ignored entirely during this period. Thomas and Whittle's (1986) reanalysis of West Kennett long barrow, for instance, explicitly built upon Richards and Thomas's ideas. They identified ‘significant patterning in pottery deposition in the five chambers according to style and decorative motifs’ (ibid., 130), which they viewed as having been designed to convey specific meanings associated with ‘age, sex or other social divisions’ (ibid., 153). Equally, in his study of the material culture deposited at Stonehenge, Burl (1987, 95) also cited their argument, embellishing it in his own imaginative style: ‘this was not rubbish but material deliberately gathered together in magical combinations that would generate power and protection’. The concept of deposition as a meaningful practice was also beginning to solidify within Iron Age research at this time: ‘put bluntly, people were doing something “pretty weird” in Iron Age Wessex pits, which is not that incomparable to the “oddity” of Neolithic deposition’ (Hill 1989, 21).
Early to mid-1990s: consolidation and expansion
The early to mid-1990s saw significant and sustained work on structured deposition within the Neolithic, a full expansion of discussion into the Bronze and Iron Ages, and the publication of three key books (Bradley 1990; Thomas 1991; Hill 1995).
Neolithic
In terms of continued work within the Neolithic, Thomas's book Rethinking the Neolithic (1991) set the agenda for many years to come. Chapter 4 – ‘Pits, pots and dirt. A genealogy of depositional practices’ – was given over entirely to an extended discussion of deposition. His fundamental point was that ‘deposition was a social and cultural practice in itself’ (ibid., 56, italics original), and in making it he placed intentional deposits firmly at the centre of subsequent debates. The initial focus of Thomas's chapter was on pits, rather than on impressive ceremonial monuments. Pits represented a particularly good type of feature through which to make the argument that deposition was a fundamental practice at that time, since it was possible to suggest that – unlike henges and so on – they had no clear function other than deposition (ibid., 59–60). In making this argument, Thomas focused predominantly on odd deposits (see definition above). By citing instances in which pristine bone pins, decorated chalk plaques, human bones and even the remains of brown bears had been placed in pits (ibid., 62), he was able to suggest that their burial had in itself been a meaningful act. In the same year, Barrett, Bradley and Green (1991) also dwelt substantially on deposition within pits. Like Thomas, they too used odd deposits (large slabs of pottery ‘placed’ with decoration upwards, complete antler picks and so on) to suggest that ‘formal’ deposition had occurred (ibid., 77). However, notably, in an attempt to show that ‘ritual’ was not something which occurred only in monumental contexts, they also used broader material culture patterning (variable distributions of artefact types, animal bones and so on) within pits to argue that depositional practices comparable to those described at Durrington Walls had occurred (ibid., 83–84). In the accompanying specialist reports volume, Brown (1991) in particular discussed structured deposition at considerable length. Echoing Richards and Thomas's original study, he focused on the ‘mutual avoidance of symbolically disassociated [artefact] types’ within pits and so on (ibid., 120), viewing material culture as having been used to convey complex social ‘statements’ about gender relations.
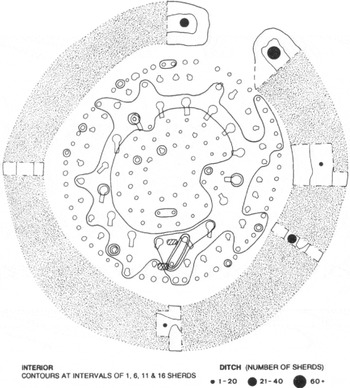
In the latter half of chapter 4, Thomas (1991, 70) moved from pits back into more familiar territory: ‘it is in the context of henge-monuments that the formality of structured deposition is most pronounced and hence most easily recognised’. Expanding his previous work at Durrington Walls, he discussed deposition within the comparable monuments of Maumbury Rings and Woodhenge (ibid, 71). As at Durrington Walls, particular combinations and variability in the distribution of material culture across these sites were seen as having been meaningfully constituted, ‘concerned with drawing contrasts and emphasizing boundaries between inside and outside, tame and wild, culture and nature, and with an emphasis on entrances and transitions’ (ibid., 72). This dual theme (a) of uneven patterning of material culture being viewed as having been intentionally created to convey a message and (b) of entrances and particular cardinal points being stressed through deposition subsequently became highly prominent, being developed in a number of key papers relating to the Sanctuary (Pollard 1992), Woodhenge (Pollard 1995; see figure 6) and Mount Pleasant (Thomas 1996). A quote from one of Pollard's abstracts (1995, 137) nicely sums up the sort of argument being made: ‘deposition is seen as a process through which a variety of connotations and symbolic references were incorporated in the monument [Woodhenge], in addition to contributing towards a complex classification of space that served to order ceremonial and ritual practices’.
The distribution of Grooved Ware at Woodhenge (Pollard 1995, figure 4).

Bronze and Iron Ages
Due to its ambitious scope, Bradley's book The passage of arms (1990) – which investigated ‘hoard and votive deposits’ throughout prehistory across north-western Europe – perhaps even more than Thomas's work placed the practice of deposition firmly at the centre of prehistoric archaeology. Notably, it expanded discussion into new periods, focusing mainly on the Bronze Age, but also on the Iron Age (and the Neolithic). Bradley did not always deal with deposits which are ‘structured’ in Richards and Thomas's original sense: the ‘votive’ deposition of a hoard of bronze jewellery in a bog is not quite the same thing as the patterned deposition of broken pottery and animal bones within a henge ditch. However, in focusing on (a) deposition as a meaningful practice, (b) the identification of ‘ritual’ deposits and (c) particular combinations of objects he did touch on many directly comparable issues.
Over the course of the early to mid-1990s a number of papers focused on Iron Age material culture deposition as it reflected ideologies and the social use of space (e.g. Hingley 1990; Parker Pearson and Richards 1994; Parker Pearson 1996). Broadly speaking, there was an assumption within this work that activity areas could be inferred directly from material culture patterning (e.g. the differential distribution of fineware pottery) in roundhouses, and that on the basis of this evidence it was possible to infer gender hierarchies and so on. Odd deposits (complete animal carcasses and so on) were also drawn in at times, to reinforce arguments about east–west spatial oppositions, for example (Parker Pearson and Richards 1994, 54). It must be said that many of these interpretations of deposition come across as rather uncritical, and it is certainly possible to critique them (see Brück 1999a; Pope 2007; Webley 2007). ‘Special’ deposits in the Bronze Age were also discussed at this time (Needham 1992).
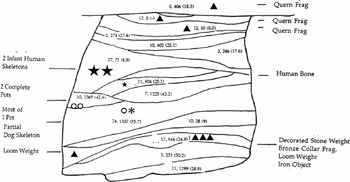
Hill's 1995 book Ritual and rubbish in the Iron Age of Wessex (an extended version of his 1993 Ph.D. thesis) represented the most extensive examination of structured deposition published so far at that point, and arguably remains so today. Within this short review, it is difficult to do justice to the full extent and complexity of Hill's analysis and interpretations. He drew direct inspiration from Neolithic research, where he suggested that it was much easier to argue for the existence of ‘odd’ deposits (Hill 1995, 5). Hill adopted an explicitly critical approach to the formation of the archaeological record, problematizing the notion of ‘rubbish’ (ibid., 1) and questioning the temporality of deposition through which material would actually have come to be deposited (ibid., 4). Like Richards and Thomas (1984), Hill was interested in the material visibility of ‘ritual’, yet he correctly took a more complex view of its archaeological signature: ‘discovering significant degrees of structure and symbolism in archaeological deposits is not a secure basis for their interpretation as ritual deposits’ (ibid., 4). He was also more rigorous in his identification of what he termed ‘special’ (ibid., 27) and ‘non-average’ (ibid., 34) deposits, ultimately noting that the former (unusual assemblages of pottery, certain groups of animal bones, two or more small finds, and human bones – ibid., 40) were often correlated with the latter (pit layers with especially large numbers of sherds, for example – ibid., 95; see figure 7). He also explored the idea that ‘special’ deposits were sometimes used in order to emphasize the symbolism of settlement boundaries/entrances and so on (ibid., 76–83; see also Hill 1994). These spatial patterns – notably identified in both vertical and horizontal dimensions – were viewed as meaningfully ‘structured’ (e.g. Hill 1995, 96). In the final three chapters of the book, Hill summarized his overall impression of what was going on. It is interesting to note a number of points of close comparison with some of the Neolithic interpretations we have already discussed: these deposits represented an ‘explicit articulation of key classifying principles through the deposition of material in particular parts of sites’ (ibid., 113) and so on. Very similar readings of material culture patterning were being made in relation to archaeology from very different contexts.
Schematic diagram of the deposits within Pit 7372 at Winnal Down (Hill 1995, figure 7.10).

Hill's study, like Bradley's (1990) before it, set the agenda for many years. Its influence on subsequent papers is clear, with ‘deliberate’ deposition in settlement boundaries, ‘unusual’ deposits of pottery in pits and so on distinctive features of Iron Age research (e.g. Fitzpatrick 1997; Gwilt 1997). In her study of human remains in Late Bronze Age Britain, published in the same year as Hill's book, Brück (1995, 254) also drew direct inspiration from Neolithic research. Again like Hill, she stressed the need to be cautious in identifying ‘ritual’, since ‘most day-to-day activities, including refuse disposal . . . may result in structured deposits in the archaeological record’ (ibid., 254).
Late 1990s to early 2000s: pushing the boundaries and the beginnings of critique
If the previous period was one of consolidation, in the late 1990s and the early 2000s there is a sense that structured deposition had become very much part of the later prehistoric interpretive furniture. The fact that deliberate and meaningful deposition had happened was, broadly speaking, taken for granted. One significant consequence of this widespread acceptance was that people no longer spent as much effort proving its existence, and thus time and space were freed up in which to push interpretation further (sometimes to the extreme).
Neolithic
The Neolithic interpretive landscape in the late 1990s is captured nicely within two site reports for causewayed enclosures: Etton (Pryor 1998) and Windmill Hill (Whittle, Pollard and Grigson 1999). Both were excavated (re-excavated in the case of Windmill Hill) in the mid- to late 1980s, ensuring that all post-excavation analysis would have been undertaken after the concept of structured deposition had been introduced. In Pryor's report, ‘placed’ or ‘structured’ deposits were given prominence from the outset (Pryor 1998, xix). Notably, he assumed that all of the deposits there were meaningful: ‘there was no evidence to suggest that any of the finds . . . represented casual loss or disposal of rubbish, or were derived or residual. Everything that was found was put there – and presumably for a purpose’ (ibid., 67). Significantly, he placed the burden of proof firmly on the side of non-ritual deposits – if no evidence could be found to suggest that they were not intentionally placed, then they were. This shift reflects the much wider increased acceptance of, and reliance on, the concept within prehistoric archaeology noted above. Importantly, the phrase ‘structured deposition’ was also used as interpretation in itself, rather than as a means to describe patterning within deposits (e.g. ibid., 66) – another tendency which became increasingly commonplace from then on. In line with previous work on henges, Pryor stressed differences between the western and eastern halves of the enclosure (ibid., 66), a pattern which has been revisited on numerous occasions since.
Whittle, Pollard and Grigson's (1999) publication of Windmill Hill presented an extended, and much more considered, discussion of depositional practices there. Their understanding of the formation processes in evidence at the site was somewhat less predetermined than Pryor's had been: ‘artefacts and faunal remains could have worked their way into the ditches through a variety of processes: by accident, through casual discard, patterned disposal routines, or intentionally “structured” deposition’ (ibid., 355). However, in line with much previous work, they ultimately came to suggest that most deposits were inherently meaningful: ‘the mixing of materials in depositions was perhaps used to create complex symbolic statements’ (ibid., 371), and that deposition had been one of the primary ‘functions’ of the enclosure (ibid., 381). Like Pryor, in arguing this, they highlighted a few clearly odd deposits (e.g. ibid., 357), but also stressed subtle differences between the three different circuits. Acknowledging that these differences may have come about at least partly through ‘routine’ activity, they nevertheless went on to argue that ‘the patterning . . . does seem to embody commonly held notions about appropriate actions in relation to particular parts of the monument’ (ibid.).
Thomas's book Understanding the Neolithic (1999), a reworked and updated edition of Rethinking the Neolithic (1991), offers an excellent opportunity to see how things had changed over the course of that eight-year period. The main differences in his chapter on deposition are a significant expansion of the section on pits (which almost doubled in length from six to eleven pages), echoing a broader trend within Neolithic archaeology (e.g. Whittle 1997; Pollard 1999), and the incorporation of his own and Pollard's work since 1991 in the discussion of henges (ibid., 81). Interestingly, in 1999 he also chose to revisit Richards and Thomas (1984), presenting a much more critical view of his findings back then than he had done in 1991, stressing in particular that deposition at Durrington Walls had not perhaps been quite as rule-bound as they had argued (Thomas 1999, 81).
Notably, again suggesting that by this point the concept was firmly embedded in academic discourse, two other papers published around this time attempted to integrate discussions of structured deposition with other topics of contemporary concern, including ‘landscapes’ and phenomenology. Jones (1998, 315), for example, presented an extended argument focusing on Neolithic Orkney, suggesting that different animals had been deposited ‘in certain places according to a series of topographic and symbolic principles’, being used to embed particular meanings (drawn from the local landscape) within many settlements and tombs. Bradley also dealt with the relationship between structured deposits and the landscape in his book An archaeology of natural places (2000). He presented a useful review of ‘the sheer complexity of the phenomenon that has become known as structured deposition’ (ibid., 122), summarizing previous work and contemporary perspectives on the subject at that point in time (ibid., 117–31). In an explicit attempt to unite the concept of structured deposition with more recent phenomenological ideas, he suggested that the choreographed manner in which many monuments may have been experienced would itself have led to strong material culture patterning (ibid., 127).
In two papers published in 2001, Pollard and Pollard and Ruggles put forward two quite different, but both relatively extreme, arguments concerning deposition. In his innovative paper ‘The aesthetics of depositional practice’, Pollard brought attention to the aesthetic qualities of Neolithic deposits, suggesting that ‘in a post-Duchampian tradition they could even be seen as artworks’ (Pollard 2001, 315). In making this argument, he also reinvigorated the late 1980s textual metaphor, arguing that ‘objects are part of a material “language”, and through structured sets of association, separation and linkage in deposition construct specific statements’ (ibid., 316). He also emphasized the performative nature of pit digging, suggesting that ‘particular dispositions, the use of left and right hands, and the laying out of objects in relation to the sides and back/front of the body, could have served to reproduce classificatory principles of purity, gender symbolism and so forth’ (ibid., 325) – the sort of argument which previously had been made only in a monumental context. This subtle move towards the process of deposition being seen as important (as well as the material message conveyed by the artefacts deposited) represented a key shift in outlook which has been maintained ever since.
Turning to arguably the most monumental context of all, Stonehenge, Pollard and Ruggles (2001) put forward one of the most extreme interpretations of depositional complexity so far. Ultimately, within their paper, they suggested that deposits had been placed differentially across the monument with reference to (1) segmented, (2) radial and (3) concentric conceptions of the monument; (4) right-sidedness (when entering the ditch); (5) previous deposits and the associated memories of what should go where; (6) wild/domestic oppositions; (7) ideas of fertility and renewal; (8) ancestors and the supernatural; and finally the passage of first (9) the sun and then (10) the moon (ibid., 79–88).
Bronze and Iron Ages
In the late 1990s and early 2000s, the continuing legacy of Hill's (1995) work is clear. The notion that the deposition of ‘rubbish’ in a settlement boundary may have served to emphasize its significance (e.g. Brück 1999a, 153; Guttman and Last 2000, 355) and that key deposits may have been used to mark significant moments in time as well as space (Brück 1999a, 154) clearly owe a debt to his work. Similarly, several researchers chose to use his criteria directly in order to identify ‘special’ pottery deposits around this time (e.g. Guttman and Last 2000; see also Brudenell and Cooper 2008). Within two papers published in 1999, Brück brought a much-needed critical perspective to the debate. In her discussion of ‘ritual and rationality’ (1999b) she deconstructed the distinction between the two terms, arguing that it was unhelpful, both methodologically and theoretically, to impose this post-Enlightenment opposition on a pre-Enlightenment past. She also pointed out that what we see as ‘odd’ deposits might have been completely normal to people in the past (ibid., 329). Critically, in terms of many of the arguments discussed above, she also argued that within later prehistoric archaeology ‘the symbolic aspects of human action all too often have been stressed at the expense of the practical’ (ibid., 325). In her other 1999 paper, she set out some of these arguments in more concrete terms by focusing on the evidence from Middle Bronze Age settlements. Importantly, she managed to discuss the potential symbolism of odd deposits (e.g. 1999b, 152), but at the same time to consider material culture patterning as a product of routine practice (ibid., 151).
Mid-2000s to the present day: the resurgence of ‘the everyday’ and hyperinterpretation
Recent work on structured deposition in both the Neolithic and the Bronze Age/Iron Age has been characterized by interpretations which, seemingly, are heading in two very different directions. On the one hand, people have come to look in much more detail at what might be termed the ‘everyday’ processes which might lead to structured deposition. On the other, however, there has at the same time been a movement towards what, following Fleming (2006), might be termed a ‘hyperinterpretive’ approach to material-culture meanings. There is also, still, a lingering aura of ‘ritual’ that arguably biases interpretation of deposition, especially within Neolithic monuments.
Neolithic
Following the lead of Thomas (1999), Pollard (2001) and others, the 2000s saw substantial continuing focus on Neolithic pit deposits. Interestingly, however, there was a notable shift in emphasis within many of these accounts towards the ‘everyday’. For example, in our publication of the large pit site at Kilverstone, myself, Emma Beadsmoore and Mark Knight chose to focus predominantly on what the material culture within the 200 or so pits was able to tell us about the rhythms of everyday life, and about the nature of occupation at the site, rather than any (arguably) symbolic meanings (Garrow, Beadsmoore and Knight 2005; Garrow, Lucy and Gibson 2006; see also discussion below). I took a similar approach to the material found in pits across East Anglia in my Ph.D. (published as Garrow 2006). Similarly, both Harding (2006) and Lamdin-Whymark (2008) focused mainly on the evidence for everyday life contained in pits, in Rudston Wold and the Middle Thames Valley. Harding (2006, 122), for example, chose to interpret pits made up of multiple layers containing just burnt flint and then predominantly pottery not as a complex material ‘statement’ of meaning, but rather as a direct reflection of the activities which had occurred on the site. Similarly, Lamdin-Whymark (2008, 104) suggested that the significant contrasts observed between the contents of apparently ‘paired’ pits potentially reflected the fact that each had been filled at a different time, or was derived from a different zone of activity associated with different practices.
Significantly, while people have recently begun to feel comfortable discussing the ‘everyday’ processes which could have led to structured deposits within pits, there has not been a comparable interpretive shift in monumental contexts (although see Beadsmoore, Garrow and Knight 2010). For instance, in direct contrast to the perspective he took in interpreting the material within pits, Lamdin-Whymark (2008, 147–48) viewed differences in the material deposited in different parts of the causewayed enclosure at Staines as the result of deliberate and ‘formal’ segregation of materials. In a similar vein, Mercer and Healy (2008, 762) – having considered the possibility that differences in the distribution of pottery types between the two enclosures at Hambledon Hill may have come about because they were used mainly by two different sets of people – went on to dismiss that interpretation, preferring instead a symbolic one (directly drawing on Pryor's interpretation of Etton) whereby certain kinds of ceremony involving certain materials were considered appropriate in different places within the monument complex.
The effect of a monumental location in evoking ‘symbolic’ readings of material culture is especially clear within what I have termed ‘hyperinterpretive’ accounts. Harris (2005, 47), for example, argues that ‘within the ritualising architecture of Etton these acts [of deposition] would take on greater significance and greater meaning’. One example cited of this accentuated meaning is ‘that both the fox skull and the first pot were placed in the ground upside down is surely significant, stressing inversion, the breakdown of normality, perhaps even the carnivalesque’ (ibid., 45). Pollard (2008, 53) made a comparable case for enhanced meanings within the same enclosure, arguing that the killing and subsequent deposition of animals, for example, ‘could have been a strategy to draw in something of their raw, generative energy, enhancing the potency of the enclosure’. He went on to describe a quernstone as ‘inverted’ (not just upside down) with leaves and twigs ‘packed over and around’ (not just on top of) it (ibid., 55), again making clear the exaggerated meanings which he felt would have characterized these deposits. Harris has subsequently made similar cases for the enhanced meaning of deposits within the Early Neolithic pit at Rowden (Harris 2009) and at Hambledon Hill (Harris 2010).
Interestingly, in the 2000s, both Pollard and Thomas got to revisit their previous desk-based work in a more hands-on manner, re-excavating small parts of Woodhenge (Pollard and Robinson 2007) and the Southern Circle at Durrington Walls (Thomas 2007) respectively. While both writers took the chance to re-evaluate the formation processes through which the deposits on those sites had formed, they did not substantially revise the ways in which they saw any ‘structure’ within them as having come about.
Bronze and Iron Ages
A comparable shift in emphasis – towards more ‘everyday’ explanations for the structuring of deposits – to that described above within the Neolithic has also occurred within Bronze and Iron Age archaeology. Woodward and Hughes (2007), for example, highlighted the need to explore unintended patterning within roundhouse gullies alongside the more obviously ‘odd’ deposits. Similarly, Webley (2007) pointed out the complexities of the depositional processes through which the material culture in roundhouse gullies came to be ‘structured’, and the need to take non-symbolic possibilities into account. Perhaps the most detailed recent critique of structured deposition within a Bronze Age/Iron Age context is Brudenell and Cooper's (2008) consideration of ‘depositional histories’ on a series of later Bronze Age sites in Bedfordshire. In their paper, they argued that the idea of structured deposition has often been ‘adopted and applied somewhat simplistically’, leading to a situation in which ‘the potential complexity and interpretive scope of depositional histories on later prehistoric sites has been substantially curtailed’ (ibid., 15). In a similar manner to some of the Neolithic work described above, they described various ways that material culture patterning which would usually be taken as evidence of ‘special’ deposits could in fact have come about as a result of relatively ‘mundane’ practices of everyday life (ibid., 30–33).
The ‘hyperinterpretive’ turn has not been as pronounced within the Bronze and Iron Ages. Nevertheless, items of material culture have been attributed enhanced meaning by some. Brück (2006, 304), for example, suggested that grain may have been viewed as a powerful symbol of transformation, and quernstones as ‘redolent with the symbolism of life and death’. Equally, again in a similar way to the Neolithic, it has proved hard to shed entirely the spectre of ‘ritual’ explanations for material culture patterning. For instance, Woodward and Hughes (2007) continued to view the differential patterning of deposits within roundhouse gullies as, for the most part, both intentional and symbolically meaningful, while Webley (2007, 139) discussed the likelihood of ‘“ritualized” house abandonment behaviour’.
Rethinking structured deposition
In this section, my aim is to question some of the things which have been taken for granted about structured deposition since 1984, and to turn the spotlight onto those issues associated with it which I view as problematic. In doing so, I hope to initiate a debate – one of the main reasons why I wanted to publish this paper in Archaeological dialogues – in order to reinvigorate the concept for the 21st century.
Over the past 28 years, as I see it, three main issues have arisen which need to be addressed:
1 There has been a tendency to conceptualize different types of deposit, which formed through quite different processes and may well have had quite different meanings, in similar ways, under the banner of ‘structured deposition’. We need to be more explicit about where on the sliding scale from odd deposits to material culture patterning (as I have termed it here) various acts of deposition should be situated, and distinguish between them more clearly.
2 In most discussions of structured deposition, there has been a tendency to attribute enhanced meaningfulness to material culture patterning. Generally speaking, variability has been viewed as both intentionally created and symbolically relevant. We need to devote more attention and effort to examining the validity of any such meanings proposed, and to think through whether and how they could actually have been conveyed in practice.
3 When investigating depositional patterning within the material record, there has been a tendency to place interpretive emphasis on just one section of what should in fact be a broad spectrum of explanations for it. We need to engage more critically with the past processes which led to material culture patterning, and shift our expectations as to the material signature(s) of ‘everyday’ practices. While the latter have, since the very beginning, always been acknowledged, they have broadly been ignored at the expense of other (‘ritual’) acts of deposition, and thus remain undertheorized and underexplored. In Bell's (1992) terms, we need to focus not just on the ‘ritualized’ but also on the non-ritualized (or ‘quotidian’) practices as well.
I will deal with each of these three points – which, as we shall see, are intimately related – in turn below. At the root of much of what I will be saying is a dissatisfaction with the balance so far achieved between what might be characterized as the ‘ritual’ and the ‘everyday’. It is important to stress that I am not wanting to reinstate any kind of ritual/domestic divide, which has been very effectively critiqued within archaeology in recent years. Brück (1999b), for example, has made the important point that any characterization of practices as being either ‘ritual’ or ‘rational’ is a consequence of post-Enlightenment thought; this distinction may not have had any validity in the prehistoric past and so should not be imposed upon it. Equally, Bradley (2005) has shown how practices that we might be tempted to divide up into the ‘ritual’ and the ‘domestic’ spheres were in fact closely linked in many elements of prehistoric life.
‘Ritual’ practices (including deposition) are also very hard to define. Bell (1992; 1997) in particular has shown how, within anthropology, ‘ritual’ can mean many different things to many different researchers, and the same is certainly true for archaeology. Similarly, she has also argued that amongst people studied ethnographically, what is considered ‘ritual’ and what is not is both context-specific and relationally determined; again, the same can almost certainly be said for the people we study archaeologically as well. Nevertheless, Bell argues (1992, 6) that ritual is still a meaningful sphere of study, and develops a distinction between ‘quotidian’ and ‘ritualized’ practices in order to get towards it (ibid., 74). Similarly, I have maintained my use of the ritual/everyday opposition because it represents a clear way of framing the argument, especially since that opposition (or something very similar), as we have just seen, has seemingly been in most archaeologists’ minds when discussing structured deposition.
It is important to stress that in reasserting the ‘everyday’ or ‘mundane’ elements of deposition, I am in no way seeking to deny the ‘ritual’ or ‘symbolically meaningful’ aspects. Rather, by emphasizing both (overlapping) spheres, and thus facilitating more varied (and arguably more accurate) interpretations of structured deposition, it should be possible to work towards a better appreciation of the signatures of past practice, and thus ultimately to create richer understandings of the past.
Exploring the full spectrum of structured deposition
Right from the start of this paper, I have characterized the types of deposit we encounter by using two different terms – odd deposits and material culture patterning. As explained above, I see these as representing convenient terms to characterize either end of a continuous spectrum. From the very beginning, there has been a tendency to discuss these two ‘types’ of deposit together, to elide them as examples of just one phenomenon – structured deposition. As mentioned above, despite the serious theoretical attention and methodological prominence they gave to more abstract material culture patterning, Richards and Thomas were still tempted to mention odd deposits (bear bones, pristine arrowheads, polished axes and so on) in their argument (1984, 206). The latter were ultimately used in order to bolster the suggestion that the former could be understood as meaningful.
A certain asymmetry generally resides within the elision of these two ‘types’ of deposition – odd deposits are almost always used to support the meaningfulness of material culture patterning. Pollard (1995, 145), for example, used carefully ‘placed’ bundles of antler picks in the ditch at Woodhenge (a deposit which would probably be placed towards the odd deposit end of the spectrum) as evidence to support his argument that the broader distributions of animal bone and other materials at the site (deposits more towards the material culture patterning end) could be seen as intentionally constituted and meaningful. Similarly, odd deposits – including groups of ‘nested’ sherds and bundles of cattle ribs (Whittle, Pollard and Grigson 1999, 357 and 364), complete pots, quernstones and polissoirs (Pryor 1998, 33 and 107), ‘token’ deposits of human bone (Brück 2006) and so on – have all been mentioned alongside rather less clearly ‘odd’ material culture patterning for similar reasons.
It is important to stress that, in most cases, the use of odd deposits to bolster the argument that material culture patterning was indeed meaningful has been implicit rather than explicit. The underlying assumption is that people did deliberately deposit seemingly valuable or symbolically rich objects in the ground, and that therefore deposition can be seen as a meaningful practice in the past. This much is, I think, undeniable. However, once the argument moves on from this point, to the suggestion that most or all material culture patterning in henges, causewayed enclosures, settlement boundaries and so on can be interpreted as being symbolically meaningful and/or as having been intentionally created, it becomes, for me, much more difficult to accept. As we will see in the next two sections, material culture patterning can come about by other means. In eliding the different ends of the depositional spectrum, and treating all structured deposits as essentially one category, we have, I feel, curtailed the interpretive possibilities open to us and thus made structured deposition a less helpful means through which to interrogate the past. This tendency has also contributed to the situation where the identification of structured deposition is viewed as an interpretation in itself; a ‘black box’ which holds the truth but is hard to access. Often, it now seems to be considered enough to identify a ‘structured deposit’ and leave it at that – people did funny things in the past, end of story. For me, it is in studies which have maintained an interpretive distinction between these two ‘types’ of deposit, enabling discussion of the dynamic between them (e.g. Hill 1995; and especially Brück 1999a), that the most effective discussions of past depositional practice have come about.
Enhanced meaningfulness and the symbolism of structured deposits
Towards the end of the preceding history section, I discussed the fact that ‘hyperinterpretive’ accounts of material culture have risen to prominence over the past ten years. It is not in fact this strand of enhanced meaning attribution that I want to question here, however. Although I myself have not generally found these accounts especially convincing, they have usually been self-consciously ‘creative’ and are perhaps an inevitable outcome of the postprocessual opening up of interpretation (see Fleming 2006, 268). Rather, my focus here will be on the relationship between material culture patterning and ideological/symbolic meaningfulness – a subject which has been on the agenda since the early 1980s.
Historically, in discussions concerning the meaningfulness of structured deposition, two subtly different arguments have been made. The first is that people in the past deposited things differentially on a site in order to convey a set of specific meanings. The second is that people deposited things differentially on a site because of the meanings that the different parts of that site had. It is worth noting that these two strands can be viewed, quite justifiably, as two stages of essentially the same recursive cycle of meaning/practice.
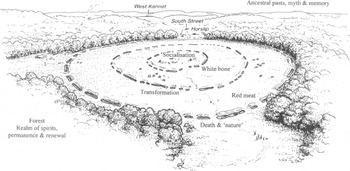
The first slant of this argument was clearly visible within Richards and Thomas's original paper, where they argued, for instance, that material culture may have been deposited in specific sequences in order to ‘communicate rules and categories’ (1984, 191). In a similar vein, Shanks and Tilley had previously argued (1982, 151) that human bones were differentially deposited in chambered tombs in order to present a particular message about the make-up of society. Equally, Hill suggested an ‘explicit articulation of key classifying principles through the deposition of material culture’ (1995, 113, italics original). This view of the meaningfulness of material culture patterning clearly has its roots in the early postprocessual discussion of the active (‘textual’) role of material culture, and a contemporary desire to make the most of the archaeological record. Over time, however, the second slant has become more prominent. For example, in his discussion of Mount Pleasant, Thomas argued (1996, 202) that ‘particular kinds of vessel, decorated in particular ways, were appropriate for use in given parts of the site, or at least for deposition there’. Similarly, Whittle, Pollard and Grigson suggested (1999, 382; see figure 8) that a broad symbolic scheme of life in general was mapped onto the enclosure at Windmill Hill, affecting what could be deposited where.
‘Simplified interpretation of the setting, major activities and possible meanings of the enclosure’ at Windmill Hill (Whittle, Pollard and Grigson 1999, figure 227 detail).

In these scenarios, the meaningfulness of deposition is conveyed intentionally – people either used material culture to convey specific messages, or deposited it specifically with reference to key classificatory principles (usually associated with particular parts of a site). As Brück has put it,
the material products of human action (artefacts, sites, etc.) are frequently interpreted as metaphorical representations of past social and cosmological orders. According to such a viewpoint, sites and artefacts (as repositories of cultural meaning) often appear to have been created through the application of abstract symbolic schemes; human action is seen as governed by belief systems rather than practical considerations (1999b, 325).
Again, it is not my intention here to question the possibility that material culture may have been deposited in order to convey a message or in accordance with some symbolic scheme. The issue I want to highlight is the fact that, in making these arguments, people have often felt compelled to interpret all variability as being representative of some kind of symbolic scheme. Thus, to mention just one example amongst dozens, Pollard viewed a 65–35 percentage split in the distribution of pottery at Woodhenge as being illustrative of a symbolic east–west divide within the monument (1995, 148; see figure 6). In my opinion, this general position is untenable – variability does not have to have been intended or explicitly meaningful.
Moreover, in order to accommodate the often contradictory material culture patterning observed between different material types (e.g. where pottery distributions do not match the flint), people have often been forced either to put forward extremely complex explanations and rules affecting deposition, or to resort to vague statements which are general enough to incorporate the variability. In the case of the former, it sometimes becomes difficult to understand how people in the past could possibly have remembered them all. In the case of the latter, explanations often come to seem rather banal. Equally, time is often flattened significantly, as the deposits plotted two-dimensionally across causewayed enclosures and henges are compared without full consideration of the temporality of their deposition. People have generally failed to consider the complexity of the processes which lay behind the patterning observed.
As we will see in the next section, other possible interpretations of the variability observed in the distribution of material culture are possible. Before turning to these alternative views, it is important to highlight a third strand of discussion, relating to the unintentional, yet still symbolically meaningful, patterning of material culture. These arguments have usually been made by those arguing that not all material culture patterning need necessarily be ‘ritual’. As Brück (1995, 255) puts it, ‘both ritual and [more ‘everyday’] rubbish disposal practices may be structured according to cultural principles’. Essentially the same point has been made by many other authors (e.g. Hill 1995, 16; Whittle, Pollard and Grigson 1999, 355). Moore's (1982; 1986) ethnoarchaeological work amongst the Marakwet in Kenya, which is frequently quoted, demonstrated that even ‘routine’ rubbish disposal practices could potentially be spatially ‘structured’ in relation to a society's symbolic categorization schemes (see figure 5). The Marakwet did not necessarily explicitly reference these schemes in disposing of their refuse, but those schemes did nevertheless influence the ‘archaeological’ record that was created. Essentially, the same thing is assumed to have occurred in the past.
In the next section, I turn to the final point I wish to make: that material culture patterning does not even have to have come about (unintentionally) as a result of underlying symbolic schemes. It can just happen.
The material signature of ‘everyday’ practice
Since the first study of structured deposition, variability in terms of material culture patterning has been central to almost every argument made. Richards and Thomas (1984) argued that differences in the prevalence of decoration on pottery across the site were symbolically meaningful, and that differences in the amount of pottery and flint in the Southern Circle post-holes could be taken as evidence for ritual practice. As we have seen, numerous others have made many similar points since then. I do not want to argue here against the suggestion that material culture patterning was not in the past, and cannot be today, explicitly meaningful. It can. However, I do think that in attributing enhanced meaningfulness to all patterning, we have foreclosed other interpretive possibilities (see also Brudenell and Cooper 2008; Beadsmoore, Garrow and Knight 2010). Essentially, what might be characterized as the ‘symbolic’ side of interpretation has come to dominate the ‘mundane’ to an unacceptable degree. Perhaps more importantly, it strikes me that underlying many of these arguments has been a fundamental misunderstanding of the archaeological signature of ‘everyday’ practice.
It is this last point to which the phrase ‘average practice’ in the title of this paper refers. A quote from Pryor's Etton report (1998, 254) perfectly illustrates the point I am making: ‘first and foremost, the patterning [of flint] was not homogeneous; this indicates beyond reasonable doubt that the assemblage(s) was not the result of random processes’. Similar arguments have been made many times elsewhere (e.g. Thomas 1996, 201–2; Whittle, Pollard and Grigson 1999, 370; Lamdin-Whymark 2008, 147). Because he considered this issue in the most detail, Hill's study represents perhaps the most extreme example. He states (1995, 41), for instance, ‘I would expect the majority of layers to contain thoroughly homogeneous deposits’. Crucial to his argument was the notion of an ‘average’ and ‘non-average’ pit fill, the latter being defined by standard deviations away from the mean (ibid., 34). The assumption within all of this work is that the non-homogeneous or non-even patterning of material (often identified using chi-squared tests) can be taken as evidence that those differences must have been intentionally created in the past. What I want to suggest here is that the ‘random’ processes of everyday life which Pryor mentions (above) in fact absolutely do create uneven patterning.
It is important to stress at this juncture that many of the studies mentioned above have considered the possibility that material culture patterning under discussion could have come about for relatively mundane reasons (e.g. Hill 1995, 2; Whittle, Pollard and Grigson 1999, 371; Mercer and Healy 2008, 762). However, due to the historical legacy of structured deposition's original formulation, these interpretive options have ultimately been sidelined or dismissed. In my opinion, the archaeological signature – in terms of the structure of deposits – of ‘everyday’ practice needs to be taken as seriously, and to be as heavily theorized, as the ‘symbolic’ or ‘ritual’. In order to demonstrate the point I am trying to make concerning the material signature of ‘everyday’ practice, I would like to turn briefly to two examples, one from the modern world, the other from the Neolithic.
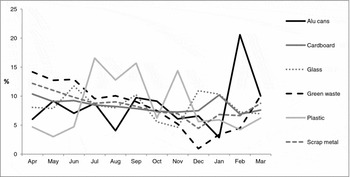
Figure 9 shows the amount of each material deposited by the public in recycling centres across Merseyside during the 2010–11 financial year. Some materials (e.g. cardboard) were disposed of in fairly regular quantities throughout the year. Others (e.g. green waste, glass, plastic, aluminium cans) fluctuated significantly. In the case of green waste, such variability is easily explained as a result of the seasonal cycle of plant growth/gardening activity. Similarly, glass disposal peaked markedly over and after the Christmas period, as one might expect given the increased consumption of drinks during seasonal festivities. However, the variability in terms of the disposal of plastic and of aluminium cans is much harder to explain. In the case of plastic, one might expect deposition to increase over the summer (with increased consumption of bottled drinks), but the peak in November cannot be explained in this way. Similarly, it is not clear why aluminium cans should have peaked so dramatically in February.
Quantities of six different material types recycled each month in Merseyside during the 2010–11 financial year. In order to make the six materials directly comparable, quantities are expressed as a percentage of the total. Data from Merseyside Waste Disposal Authority.

It would be mistaken to suggest that the deposition captured within this graph is in no way a meaningful reflection of ideology or symbolism: the fact that any of these materials were brought for recycling at all reflects the ideologies of green living and sustainability; the disposal of glass at Christmas is clearly tied in to cosmology, belief systems and so on. However, importantly, what these data emphasize is that variability can in fact be the norm. These patterns of variability were not created intentionally in order to convey a symbolic message. The people making these deposits will not have been aware of the patterns they helped to create. However, that is not to say that those patterns are meaningless. They do have something significant to say about the rhythms of everyday practice and consumption – the deposition of objects is often the final stage in a long series of practices and processes, and the material culture represented can therefore fluctuate simply as a result of the inherent ebbs and flows of life.
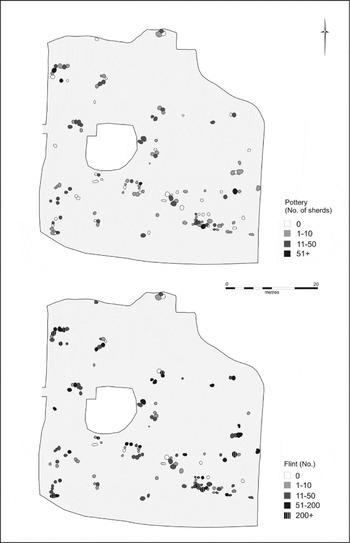
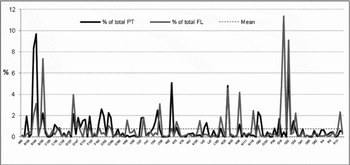
Turning to the Neolithic, we can see comparable patterns emerging within a very different dataset. Figure 10 shows the quantities of material deposited within 138 Early Neolithic pits at Kilverstone, Norfolk (Garrow, Beadsmoore and Knight 2005; Garrow, Lucy and Gibson 2006). Figure 11 shows those quantities in a way which allows us to compare the amounts of flint and pottery in each pit directly. In some cases, the amount of both materials is closely comparable, but often the two numbers are very different. Equally, the majority of pits show significant deviations from the mean. It would certainly be possible to interpret patterns such as these as having been intentionally (and meaningfully) constituted in the past – a material-culture text designed to express contradictions within society and so on. However, it is also possible to put forward a more ‘everyday’ explanation. It is perfectly feasible to view variability in the quantities of different materials within each pit and within each different pit cluster – like the recycling dumped in Merseyside – as reflecting the fluctuations of everyday life at the site. The accumulation of pottery and flint, and the digging and filling of pits, occurred at different ‘tempos’ (see Garrow, Lucy and Gibson 2006, 74–75). Consequently, when one pit was filled, there may have been lots of all materials available in the pre-pit context. However, when the next pit was filled, it is possible that while lots of flint had been knapped, no further pots had been broken; as a result, that pit would have been sparse in terms of pottery, but rich in terms of flint (ibid.). Through these simple processes, the picture of Neolithic life captured in Figure 11 gradually emerged. Importantly, just like the recycling data presented in figure 9, while the patterns revealed probably were not meaningful to those filling the pits nearly 6,000 years ago, and were not created intentionally, they are meaningful to us in our attempts to understand ‘everyday’ past practice.
Pottery and flint distributions at Kilverstone, Area E (Garrow, Lucy and Gibson 2006, figure 2.7).

Graphic representation of the relative amounts of pottery and flint in each pit at Kilverstone, Area E. In order to make the two materials directly comparable, the quantity of sherds/flakes in each post-hole was calculated as a percentage of the total number.

Conclusion
It is something of a cliché that, in constructing a history, one turns a spotlight on the assumptions which underlie interpretation in the present. In writing this history of structured deposition, I must admit that I was surprised by quite how persistent the ideas put forward in Richards and Thomas's 1984 paper have been. Not because it was not a good paper – it was. It is just that 28 years seems a long time for any idea(s) to have stood the test of time. As we have seen, to a significant extent the concept of structured deposition has done so. One key explanation as to why it has must be, simply, that it works. Richards and Thomas captured an idea which has remained in tune with interpretations since, and which also successfully captured the essence of a genuine suite of practices in the past. Consequently, the assumptions of that paper still do underpin interpretations today.
In the preceding section, I attempted to question a few of those assumptions. I argued (a) that we need to be more explicit and less complacent in our labelling of structured deposits; (b) that ‘everyday’ explanations for material culture patterning should be investigated more; and (c) that the signature of everyday practice is not usually ‘even’ or ‘average’, but highly varied and variable. Underlying these suggestions is a general feeling that the ‘ritual’ side of interpretation has perhaps unfairly come to dominate the ‘everyday’. The possibility that deposits could come to have structure for relatively ‘ordinary’ reasons has been considered ever since Richards and Thomas's original paper. However, due to the historical legacy of structured deposition outlined in this paper, the implications of this possibility have often been ignored.
As mentioned above, I do not want in any way to argue for a total shift away from the ritual to the mundane. Structured deposition was, at least in part, introduced in order to bring out the ‘strangeness’ or ‘alterity’ of the past (see Thomas 1991, 1; Hill 1995, 5), allowing the investigation of ritual, symbolic meanings and so on. This aim was a good one, and one which was certainly achieved, enriching our understanding of the prehistoric past considerably and for the better. However, it strikes me that over the years the strangeness of structured deposition has gradually become more and more familiar. The identification of structured deposits can now seem rather formulaic. Consequently, I feel it is vital that, as archaeologists trying to understand the past, we properly investigate the material signature(s) of normal everyday life as well. Importantly, in saying this, I am not advocating a move to make the past more boring. Ultimately, I think that if we are able to investigate the ‘everyday’, and make that seem strange or different, that is even more of an achievement. It is therefore vitally important that, as archaeologists, we gain confidence to explore the mundane in more detail – in monumental contexts just as much as on seemingly more ‘everyday’ sites.
It is possible to suggest that, in taking the approach we took to Kilverstone, and focusing on the everyday (and ‘meaningless’) in our interpretation, we moved understandings of Neolithic pit sites further on than we would have done if we had stressed the ritual (and ‘meaningful’). Different interpretive possibilities were opened up. I would argue that, if we are ever to understand fully the processes behind structured deposition, it is crucial that we explore this side of life elsewhere as well. For instance, if we saw the variability of pottery decorations across Durrington Walls not as evidence for intentionally constructed statements about society's rules and symbolism, but as a consequence of the fact that different elements of the site simply came into focus at different times when different traditions of pottery decoration were prevalent, our understanding of the site would be changed significantly. Similarly, to take a couple more of the examples discussed above at random, would we perhaps learn more about the pits at Down Farm if we saw the presence of different types of flint in different pits as a sign not of symbolic exclusion (Brown 1991), but of the fact that people visiting the site had simply been using different materials at different times? And what would happen if we did explore further the differential distribution of fabric types at Hambledon Hill not as a sign of depositional rules, but as evidence that different contemporary groups of people had had access to different parts of the hilltop (Mercer and Healy 2008)?
To my mind, if such possibilities were at least considered, our understanding of those sites and others would change significantly, and perhaps for the better. As soon as the structure evident within deposition is made potentially ‘everyday’ in this way, different interpretations become possible. Equally, the ‘meaning’ of those patterns is not some obscure material-culture text (which we cannot easily decipher), but relates directly to past practices (which, arguably, we can). The opening up of interpretive possibilities was one of the main elements of the postprocessual agenda back when the notion of ‘structured deposition’ first took off. In revisiting that interpretive world, charting the evolution of ideas since, and questioning some which have persisted, it is hoped that this paper might revitalize the possibilities for structured deposition that seemed so fresh back in 1984.
Acknowledgements
This paper has been a very long time in the making, and so here, even more than usual, it is important to acknowledge many people. I would like to thank J.D. Hill, whose Iron Age lectures in the early 1990s first inspired my interest in deposition; Anwen Cooper, Christopher Evans, Chris Gosden, Mark Knight, Lesley McFadyen and Marie Louise Stig Sørensen who have all (in their very different ways) made me question, reconsider and consolidate my ideas about deposition over the years since then; Emma Beadsmoore and Mark Knight for their insight and inspiration in analysing the assemblages from Kilverstone and Etton; Josh Pollard and Julian Thomas for their helpful and encouraging examiners’ comments on my Ph.D.; Anne Teather for organizing the Re-depositing Prehistory session at TAG 2005 in Sheffield, where I first formalized some of these thoughts in a presentation entitled ‘Rethinking the structure in deposition’; Chris Wakefield, with whom recent conversations about his own insightful undergraduate dissertation on structured deposition within causewayed enclosures helped me to clarify my own thinking a great deal; Matt Grove for his much-needed advice about statistics; and Lee Jones at the Merseyside Waste Disposal Authority for taking the time to search out their monthly recycling data for me. A number of people very kindly allowed me to reproduce their original figures: Colin Richards and Julian Thomas (figures 2 and 3); Josh Pollard and the Prehistoric Society (figure 6); J.D. Hill (figure 7); and Alasdair Whittle, Josh Pollard, Caroline Grigson and Oxbow Books (figure 8). Finally, I would like to thank Anwen Cooper, Jody Joy, Elizabeth Shove and Fraser Sturt; the Archaeological dialogues editorial committee; and the two anonymous referees for their insightful and very helpful comments on earlier versions of this paper.