

Dominant parties – parties winning electoral majorities for a sustained amount of time – exist in many developing countries.Footnote 1 In Sub-Saharan Africa, such parties rule in a majority of countries (Bogaards Reference Bogaards2004; Lindberg and Jones Reference Lindberg and Jones2010) but they are also present in countries such as Algeria, Armenia and Singapore. Their prevalence has generated new research interest in recent years (see Bogaards and Boucek Reference Bogaards and Boucek2010; Boucek Reference Boucek2012; De Jager and Du Toit Reference De Jager and Du Toit2013).
A core focus of this literature is the implications of dominant parties for the quality of democracy.Footnote 2 The relationship of dominant parties with democracy is mostly addressed in terms of infractions of democratic rules and procedures. This is well illustrated in the literature about party dominance in South Africa, where the African National Congress (ANC) has been in power for the past 20 years. The literature on the perils of the ANC’s dominance emerged shortly after South Africa’s first democratic elections in 1994 (Giliomee Reference Giliomee1998; Giliomee et al. Reference Giliomee, Myburgh and Schlemmer2001; Southall Reference Southall2005). A significant part of these studies are cast in terms of the threats dominant parties pose to democracy and assumes a ‘basic tension between dominant-party rule and democracy’ (Giliomee and Simkins Reference Giliomee and Simkins1999: 337).Footnote 3 The main question put forward in much South African work on the topic is whether there is a natural evolution from a dominant party in a democracy to a dominant autocratic party and whether South Africa is on that path (for recent examples, see De Jager and Du Toit Reference De Jager and Du Toit2013: 3; or Southall Reference Southall2014: 48).
In contrast to this concern about regime-level issues, another core element of democracy – accountability to voters – is not a major focus of this literature. The dominant party literature naturally recognizes vertical accountability to be relevant for the quality of democracy but does not take the issue up systematically (e.g. De Jager and Du Toit Reference De Jager and Du Toit2013). Some work addresses the issue indirectly and argues that dominant parties may be sensitive to public pressures and demands because of internal factions from all ideological spectrums and the mere existence of opposition parties but does not explore the mechanisms and scope conditions in more detail (e.g. Kothari Reference Kothari1964; Reddy Reference Reddy2005; see also discussion in Southall Reference Southall2005). At any rate, most work appears to take a certain disregard for voters for granted, not least because many dominant parties win electoral majorities as a result of having a special bond with the electorate (which may be ethnic or because of the party’s role in major historical events). This is again illustrated by parts of the South African literature that paint a picture of a party that is essentially unconcerned with its voters, given that it benefits from race-based support (see, for example, Giliomee and Simkins 1999).Footnote 4
However, whether and how dominant parties react to voter concerns is essentially an empirical question. Does a dominant party setting automatically imply a disregard for voters, or do parties in such a setting still react to electoral incentives?
This article investigates this question by looking at the ANC’s responsiveness to voters at the local level. Since the first democratic local elections in 2000, the ANC has governed the overwhelming majority of South African municipalities. This general dominance masks, however, large differences in the margins of victory – ranging from 0.5 to 90 percentage points (pps) – by which the ANC won local elections. The article systematically studies how the ANC reacts to electoral incentives by comparing the ANC’s degree of responsiveness to voters in municipalities where the ANC is dominant in elections vs. those where it is not.
In this article, responsiveness to voters is addressed via studying whether high-quality politicians remain and low-quality politicians are removed from office. The analysis focuses on the ANC’s renomination choices regarding municipal councillors. The ANC’s dominance in elections and its highly formalized nomination process implies that accountability of individual politicians in South Africa operates by and large via the party committees that control nomination. Whether better-performing councillors are more likely to be renominated for a second term is thus a crucial test for the party’s responsiveness to voters.
Looking at renomination has the additional advantage that there is a record of voter signals and of achievements in service delivery and financial management that the party could consider in the nomination process. Generally, if voter signals and performance affect renomination, it would mean that the ANC shows some degree of responsiveness to voters in spite of its electoral dominance. If those factors are unrelated to renomination, it implies that other considerations, such as party loyalty or closeness to the leaders, matter more for ANC candidate nominations.
The results show a mixed picture. The strongest and most consistent finding is that the ANC does differentiate between places where it has electoral hegemony and places where it does not. In competitive places (that is, municipalities with low margins of victory), renomination for higher status councillor positions is strongly and positively associated with all performance indicators. In uncompetitive municipalities, only service delivery is positively associated with renomination, whereas voter signals and financial management have no impact. Moreover, the effect of service delivery in competitive municipalities is much larger than in uncompetitive municipalities. These results are robust to alternative specifications of competitiveness.
These findings have important implications for the literature on dominant parties. The first is that a lack of accountability in dominant party systems is not a given and that the literature should focus more on party–voter relations at different levels of government in these systems. At the local level, the ANC behaved very much like a ‘standard party’ as described by the literature on political competition and accountability: when electoral competition is high, parties are more responsive to voter concerns and perform better on various issues (Besley and Burgess Reference Besley and Burgess2002; Griffin Reference Griffin2006; Hobolt and Klemmensen Reference Hobolt and Klemmensen2008). The results of this article show that this logic appears to guide the behaviour of the ANC at the local level.
At the same time, accountability was not altogether absent in uncompetitive municipalities, as suggested by the findings on service delivery. The fact that responsiveness to voters’ concerns exists for highly salient issues – as is the case for service delivery that has generated waves of protest in South Africa over the past decade (Alexander Reference Alexander2010; Booysen Reference Booysen2007) – suggests that even dominant parties might exhibit some responsiveness when the stakes are high.
Second, the findings in this article can inform the debate on dominant parties at the national level. Local-level findings are certainly not directly transferable to the national level, and the prospects of losing power at the national level might induce other reactions than losing power in a municipality. Nevertheless, the findings from the local level would suggest that accountability increases as margins of victory decrease and that a dominant party threatened by the loss of power might well react by putting up a bigger electoral fight rather than bend the rules.
The article is organized as follows. The next section briefly presents local government prerogatives and challenges in South Africa. It then explains the empirical approach and data. The fourth section discusses candidate selection procedures and renomination patterns in the 2011 election. The following section presents the empirical model and the results, and discusses the mechanisms at play. A final section provides some concluding remarks.
Local Government and Local Elections in South Africa
The present-day shape of local government in South Africa originates from the final transition negotiations in the early 1990s. In 1995–6, transitional local councils were elected. Similarly to the national level, local governments of unity were established that also included apartheid local elites, and important decisions such as the budget vote could only be taken with a two-thirds majority (Powell Reference Powell2012). In this interim phase, new municipalities were demarcated. These municipalities are rather large, with a total of 232 local municipalities and an additional eight so-called metropolitan municipalities with high population density (such as Cape Town, Johannesburg or Port Elizabeth). In addition, district municipalities were established that include around four local municipalities and are supposed to support local governments. The transition phase ended in 2000 with the holding of the first truly democratic local elections. Since then, two additional elections were held at the local level in 2006 and 2011; in both, the ANC won the majority of seats in an overwhelming proportion of the municipalities (in 203 municipalities in 2006, in 197 municipalities in 2011).
Local governments are financed by a mix of local taxes, service charges and grants from the national treasury. Because of the very uneven socioeconomic development of South African provinces – a legacy of apartheid politics – the share of own resources and transfers from national treasury differs greatly between municipalities. Many municipalities that absorbed former homelands and rural areas in provinces such as Mpumalanga or Limpopo depend fully on these national transfers.Footnote 5
The core functions of local governments are the delivery of basic services (such as electricity, water, sanitation, waste removal, housing) and local economic development. Because the apartheid regime invested very little in non-white areas, a large number of black households had no access to such services in the mid-1990s. Since the end of apartheid, there have been large investments in the extension of infrastructure and services, and a policy of providing free basic services to poor households was introduced during the 2000s. Nevertheless, there are still significant numbers of South African households that remain without access to decent sanitation, electricity or clean water.Footnote 6 Indeed, service delivery remains the core battleground of local politics, with high numbers of so-called service delivery protests (Alexander Reference Alexander2010; Atkinson Reference Atkinson2007; Booysen Reference Booysen2007) and many election slogans focusing on the topic.
There is a broad consensus that local governments are under-performing. Core problems are lack of qualified personnel, wasteful expenditures, inefficiency and corruption (Amtaika Reference Amtaika2013). These problems are acknowledged as much in the reports of the auditor-general (Auditor-General 2011), the presidency (Department of Performance and Evaluation 2012) or the Ministry of Cooperative Government and Traditional Affairs (Department of Cooperative Government and Traditional Affairs 2009) as in national-level initiatives to improve the performance of local governments (such as the National Turnaround Strategy for Local Government (see Powell Reference Powell2012).
In sum, local governments have been assigned a very important role in addressing the large inequalities in basic service provision found at the end of apartheid in South Africa but are struggling to achieve this goal. Responsiveness to voter demands at the local level would imply that the ANC rewards councillors who are doing a better job in reaching this objective.
Empirical Approach and Data
This study aims to assess the degree of accountability of the nationally dominant ANC at the local level in South Africa. The main question is whether good-quality politicians remain and low-quality politicians are removed from office. The analysis thus focuses on whether the ANC, as a party, is more likely to renominate better-quality municipal councillors. This contrasts with the standard approach to accountability that investigates the relationship between the performance of individual politicians and voting behaviour (see, for example, the review by Pande Reference Pande2011). The focus on renomination choices by parties is, however, particularly sensible in South Africa because a high level of formalization of the candidate selection process (Mac Giollabhuí Reference Mac Giollabhuí2013), together with party dominance, implies that individual councillors are mostly accountable to the party.
There are, of course, many factors potentially affecting candidate selection for local office in the ANC in addition to councillor quality. The most important one noted in the literature is factionalism. Factions play a role because the ANC’s ‘official factions’ (that is, the South African Communist Party and the Congress of South African Trade Unions) have to be accommodated in the candidate selection process (Mac Giollabhuí Reference Mac Giollabhuí2013) or because ‘unofficial factions’ (that is, Jacob Zuma vs. Thabo Mbeki, Zuma vs. Kgalema Motlanthe, Zuma vs. Julius Malema, or even more localized factions) attempt to influence the selection procedures, for example, by adding members to the local branches (Butler Reference Butler2015; Cooper Reference Cooper2015). The importance of factionalism for candidate selection is, however, not a problem for this study. To the contrary: to find that councillor performance has an effect on renomination would be an even more important signal of responsiveness to voters in view of such a countervailing force.
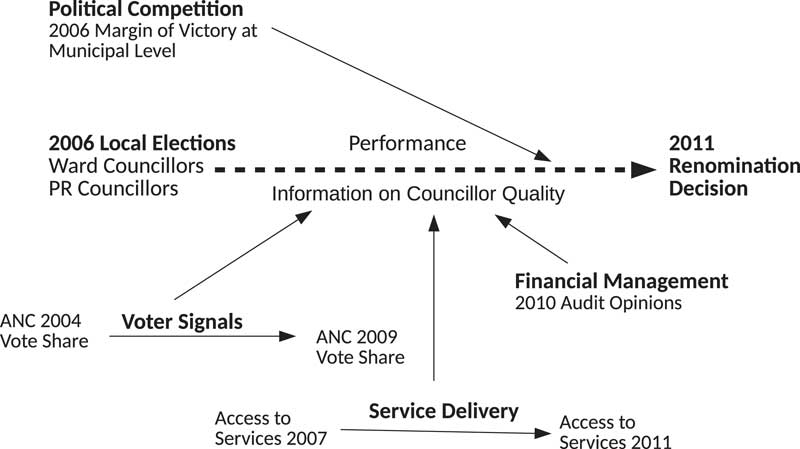
Figure 1 shows a schematic representation of the study’s approach, including the timing at which the different outcomes and explanatory variables are observed. As shown in the figure, the analysis concerns councillors who were elected in 2006. During their term, the party receives information on their quality. Councillor quality is operationalized by municipal-level performance indicators. The analysis focuses on observable performance – that is, voter signals, service delivery and the financial management of the municipality.Footnote 7 Apart from audits, the explanatory variables are measured as that variable’s evolution during the councillors’ term. When it comes to the renomination decision in 2011, the party may or may not take councillor performance into consideration; possibly, the effect is mediated by the degree of electoral competition at the municipality.
Schematic Representation of the Approach

The analysis relies on South African electoral and administrative data that are publicly available. Table A.1 in the online appendix provides a definition of the variables and their data sources. The article has to rely on aggregate municipal data because electoral wards are redistricted before each municipal election in South Africa and are thus not comparable across time. Performance indicators are thus averages at the municipal level, renomination decisions are expressed in terms of municipal-level share. The analysis is restricted to the 192 municipalities governed by the ANC from 2006 to 2011. For councillor renomination, it relies on data from South Africa’s Independent Electoral Commission, which publishes the names of elected councillors as well as the names of candidates on its website.Footnote 8 The analysis considers two types of councillors: ward councillors, who are selected via a first-past-the-post system in municipal subunits (wards), and proportional representation councillors – PR councillors – who are selected as part of a closed party list at the municipal level.Footnote 9
Voter signals about local government performance are proxied by the Evolution of the ANC’s vote share in national elections in a given municipality. Thus, for voter signals about the performance of local governments elected in 2006, the evolution of the party’s vote share between the 2004 and the 2009 national elections is used. This is based on the assumption that the design, provision and implementation of municipal-level policies – such as crucial service delivery – are key for the quality of life of a majority of South Africans and are thus likely to affect strongly national vote share.
Using changes in vote share as a performance indicator would, of course, make little sense if voting in South Africa was indeed a racial census – that is, a simple ‘racial headcount’. However, the works of Ferree (Reference Ferree2011) and Mattes (Reference Mattes2002) show that this is not the case. According to these studies, voters do care about government performance, and changes in voting behaviour thus provide information about whether voters evaluate performance positively or negatively. At the same time, many African voters view the key opposition party Democratic Alliance as serving white interests.Footnote 10 This implies, firstly, that voters react less strongly to ANC performance than they would if better alternatives were available, and, secondly, that dissatisfied voters would rather protest by abstaining than by voting for another party (Mattes Reference Mattes2002). Therefore, an indicator of voter signals needs to take turnout into account and will be the evolution of ANC vote share between 2004 and 2009 as a percentage of registered voters.
In addition to this subjective indicator, the analysis is based on two objective indicators of local performance. Objective performance will be assessed most importantly by service delivery which, as discussed above, is a core task and challenge for local governments. Differences in the access to water, good-quality sanitation and electricity will be used as indicators of changes in service delivery between the 2006 and 2011 elections according to data from the South African Community Survey in 2007 and from the Census in 2011.Footnote 11 The variables used are the differences of logs in household access to tap water, to sanitation (as measured by households having a flush toilet connected to the sewer system) and to electricity (as measured by the main source for lighting).Footnote 12 These variables thus capture percentage changes in service delivery over the council term.
The second objective performance indicator is the audit opinions in 2010. These audit opinions are provided in yearly reports by the auditor-general and will be used as an indicator of the seriousness with which a municipality approaches financial management.Footnote 13 The variable is coded from 0 (disclaimer) to 4 (unqualified opinion). In 2010, only 2 per cent of the municipalities received an unqualified audit opinion (that is, outright approval with no provisos), 40 per cent were financially unqualified but had issues with compliance with laws and regulations, and the remainder ranged from disclaimers over adverse, to qualified opinions (Auditor-General 2011). Although the state of a municipality’s accounts is obviously related to the skills of that town’s municipal manager and chief financial officer, a town’s governing party is supposed to oversee them and therefore has a role to play in how well the budget is managed.Footnote 14
Renomination Patterns in the ANC
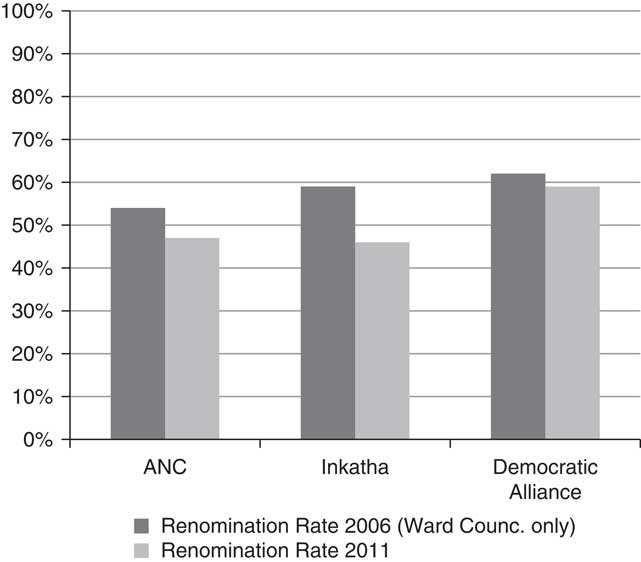
Renomination rates at the local level are generally low in South Africa. Figure 2 shows the ANC’s renomination outcomes by displaying the fate of ANC councillors alongside those of its two core competitors during the period of this study, the Democratic Alliance and the Inkatha Freedom Party.Footnote 15 For comparison, it also includes the renomination rates for the ward councillors that were elected in 2000 (not used in the subsequent analysis because the names of the PR councillors were not available for that election). The figure highlights the generally very low renomination rates for ANC councillors, with about half of them not running in the subsequent elections. The ANC is not an exception: the renomination rates of the Inkatha Freedom Party are as low and those of the Democratic Alliance are only about 10 percentage points higher. This is true as much for the councillors elected in 2000 as those elected in 2006. Low levels of renomination are thus a general feature of South African municipal politics.
Renomination Rates of Municipal Councillors

It is important to note that these low renomination rates are the effect of neither a lack of attractiveness of councillor positions nor substantial political upward mobility. Especially since 2006, municipal councillors earn sizeable salaries even in smaller towns. Most of the councillors would have few outside employment opportunities, and being a councillor opens the door not only to a salary but to opportunities of patronage and personal enrichment (Atkinson Reference Atkinson2007). There is also no evidence that significant numbers of councillors move on to district-, provincial- or even national-level political careers.Footnote 16 The most plausible explanation for the low renomination rates is thus that parties do not want to nominate councillors for a second term.
It is important to distinguish between the different status of the different councillor positions, namely ward, PR and district councillors. The hierarchy between these positions is quite clear. The least desirable job is that of ward councillor, who is directly exposed to citizen discontent and is generally expected to attend community meetings and run a ward committee (which are not included in the duties of PR councillors). PR councillors are more likely to be appointed to better remunerated and more prestigious municipal positions, such as mayor or member of the municipality’s executive committee (Piper Reference Piper2012). Additionally, being a PR or district councillor is still viewed as opening the path to a provincial or even national career.Footnote 17 This hierarchy of councillor positions implies that a study of party accountability has to consider not only the overall renomination rate, but also who gets renominated for better status jobs (PR or district councillor). The analysis below will thus use as outcome variable the renomination share for better status councillor position alongside the overall renomination share.
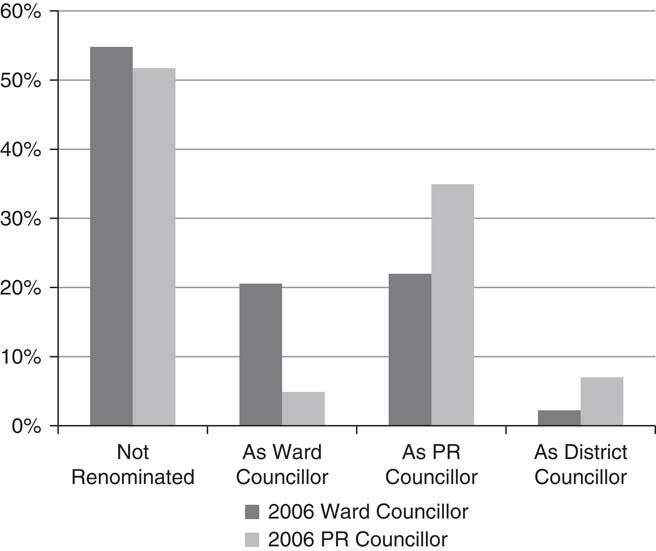
Figure 3 displays the renomination rates for different councillor positions, distinguished by whether a councillor was elected in 2006 in a ward or on the PR list. Both types of councillors have about a 50 per cent chance of being nominated for another term, implying that dissatisfaction with both types of councillor is equal. The specific renomination pattern is, however, rather distinct and supports the argument of different statuses associated with different councillor positions. Ward councillors are as likely to be renominated for PR councillor roles as they are to remain in the ward, suggesting that they strive to become PR councillors. Conversely, PR councillors are rarely nominated as ward candidates (about 5 per cent). District councillor nominations are more likely for PR councillors (7 per cent) than for ward councillors (2 per cent), suggesting that upward mobility occurs stepwise (from ward to PR to district.
2011 Renomination Status, ANC Councillors

Nominations for different councillor positions are controlled by different ANC party bodies, which affects to whom councillors are accountable. Ward councillors are nominated by the ANC’s local branches, which are geographically aligned with the wards, with some involvement of the regional list committee, located at the level of the district municipalities. In the final choice, popularity in the ward is supposed to be a key criterion (African National Congress 2010: C.34).Footnote 18 In principle, ward-level interests and concerns should play a core role in the selection of this type of candidate.Footnote 19 Nominations for the proportional representation list also come from the local branches, but the role of the regional list committee is much more important in their selection. The list committee is supposed to consider the number of nominations received by a candidate, the candidate’s skills and experience and – not further specified – ‘criteria of the ANC’ (African National Congress 2010: C.40). This implies that the regional list committee has wide scope to draw up the list and that the interests pursued by this committee will be very strongly reflected in the selection of party representative candidates.
Therefore, the selection of PR councillors signals party-level concerns whereas the selection of ward councillors is more driven by the local communities. For a study of party-level accountability, the drivers of renomination for PR councillors should thus be of special interest.
Performance, Electoral Competition and Renomination in the ANC
Empirical Model
The empirical model consists of OLS regressions of renomination shares (outcome variables) on different performance indicators (explanatory variables). The party is considered accountable if renomination shares are higher in municipalities with better outcomes; it is considered unresponsive if renomination shares are unrelated to municipal-level performance. The analysis considers first the relationship between renomination and performance for all municipalities; in a second step, it considers the role of electoral competitiveness for the relationship.
For the basic results, equations of the following type are estimated:
 $$ R_{{ij}} =\alpha _{j} {\plus}\beta _{1} CQ_{i} {\plus}\beta _{2} pop_{i} {\plus}\beta _{3} Ash_{i} {\plus}\beta _{4} Csh_{i} {\plus}\beta _{5} Wsh_{i} {\plus}{\varepsilon}_{i} $$
where i indexes municipalities and j indexes provinces. R denotes generically the renomination share and can either be the renomination shares of ward councillors (Wr), PR councillors (Pr), or for high-status councillor positions (HSr). The coefficient of interest is β1, the associated variable CQ represents councillor quality and is measured by voter signals (chgV), service delivery (chgEl, chgWa, chgSa), or financial management (aud), as explained above (see Table A.1 in the online appendix). α j are provincial fixed effects ensuring that the analysis does compare relatively similar municipalities and does not simply capture the difference between very developed, high capacity municipalities (for instance, in the Western Cape and Gauteng) and those with low levels of socioeconomic development and low capacity (for instance, in Mpumalanga and Limpopo). Pop i (log of population size) as well as Ash i , Csh i and Wsh i (shares of the respective population groups) are additional controls accounting for differences in income and starting levels of service delivery and capacity of the municipalities. ε i is the error term.
In a second step, the role of political competition is brought in. In this study, political competition is defined as margins of victory below 25 percentage points. Although this high threshold defies common understandings of political competition, it was necessary to ensure enough statistical power for this analysis.Footnote 20 The number of competitive municipalities in the analysis is 37 out of the 192 municipalities won by the ANC. The mean margin of victory in competitive municipalities is 11 percentage points, in uncompetitive municipalities, it is 60 percentage points. Political competition defined in this way takes place mainly in the Western Cape and KwaZulu-Natal, with some additional municipalities in the Eastern Cape and the Northern Cape.
For the results on the role of political competition, equations of the following type are estimated:
 $$\eqalign {R_{{ij}} = \,\alpha _{j} {\plus}\beta _{1} CQ_{i} {\plus}\beta _{2} CQ_{i} Xcomp_{i} {\plus}\beta _{3} comp_{i} {\plus}\beta _{4} pop_{i} \cr{\plus}\beta _{5} Ash_{i} {\plus}\beta _{6} Csh_{i} {\plus}\beta _{7} Wsh_{i} {\plus}{\varepsilon}_{i} $$
where the coefficients of interest are β 1 that shows the effect of councillor quality in uncompetitive municipalities and β 2 that shows the differential effect of political competition.
Basic Results: Performance and Renomination
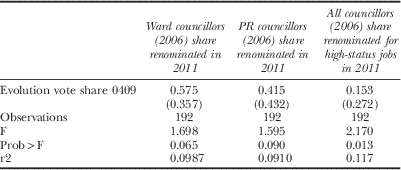
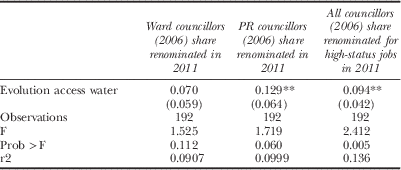
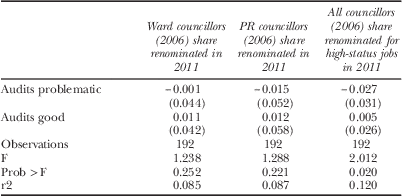
Tables 1–3 display the results from OLS regressions of renomination shares of councillors elected in 2006 on the different performance indicators. In each table, the three columns correspond to different renomination outcomes. The first column displays the overall share of ward councillors (elected in 2006) that received a nomination for another term in 2011 – in any form. The second column displays the same information for the PR councillors. The third column shows the share of those being renominated for a high-status position in 2011 – that is, as PR or district municipality councillor – irrespective of the position they held in 2006. Whereas the first two columns thus capture the overall shares of those seen fit to stand for another term, the third column shows the type of councillor the ANC renominates for better jobs.
OLS Regression of 2011 Renominations on Voter Signals

Note: Each regression with provincial fixed effect and controls for population group shares and log of municipality population.
Robust standard errors in parentheses.
*p<0.1, **p<0.05, ***p<0.01.
OLS Regression of Renomination on Changes in Access to Water

Note: Each regression with provincial fixed effects and controls for population group shares and log of municipality population.
Robust standard errors in parentheses.
*p<0.1, **p<0.05, ***p<0.01.
OLS Regression of Renomination on Audit Outcomes, 2010

Note: Each regression with provincial fixed effects and controls for population group shares and log of municipality population.
Reference (Omitted) Category: disclaimer. Audits problematic: opinion adverse opinion and qualified. Audits good: opinion unqualified
Robust standard errors in parentheses.
*p<0.1, **p<0.05, ***p<0.01.
The coefficients are generally positive but typically not very large and mostly insignificant. There is no significant effect of voter signals on renomination, for audits the coefficients are virtually zero. On the other hand, improvements in service delivery appear to be correlated with renomination for better status jobs. In particular, a 10 per cent increase in households with access to tap water leads to a 1 percentage point increase in renomination for better positions. Additional results for electricity and sanitation are shown in Tables A.3 and A.4 in the online appendix and confirm these findings.
In sum, it appears that local government performance has overall no important impact on renomination in the ANC, a result that would suggest that party dominance does indeed go together with relative lack of responsiveness to voter concerns. Only performance in terms of service delivery improvements appears to be related to renomination, but the effects are small in size.
The Role of Political Competition
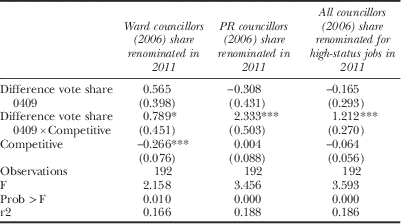
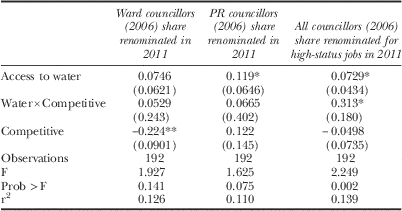
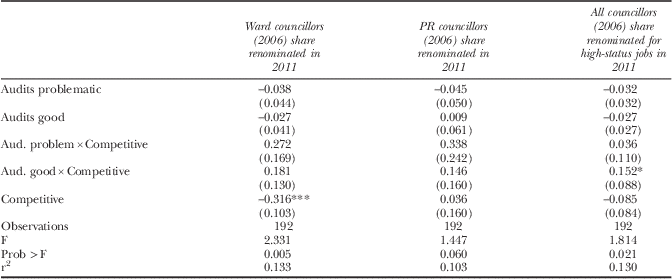
Tables 4–6 display the results on the role of political competition. As in the previous tables, the columns represent different types of renomination outcomes. As mentioned, the coefficients of interest are those showing the results for the respective performance indicator in uncompetitive municipalities (for example, access to water or audits) and those showing the effect in competitive municipalities as given by the interaction term of the performance indicator with an indicator variable of political competition (e.g. water×competitive or audits×competitive). Footnote 21
OLS Regression of Renomination on Voter Signals with Competitiveness

Note: Each regression with provincial fixed effects and controls for population group shares and log of municipality population.
Robust standard errors in parentheses.
*p<0.1, **p<0.05, ***p<0.01.
OLS Regression of Renomination on Access to Water with Competitiveness

Note: Each regression with provincial fixed effects and controls for population group shares and log of municipality population.
Robust standard errors in parentheses.
*p<0.1, **p<0.05, ***p<0.01.
OLS Regression of Renomination on Audit Opinions with Competitiveness

Note: Each regression with provincial fixed effects and controls for population group shares and log of municipality population.
Reference (Omitted) Category: disclaimer. Audits problematic: opinion adverse and qualified. Audits good: opinion unqualified.
Robust standard errors in parentheses.
*p<0.1, **p<0.05, ***p<0.01.
The general picture emerging from these tables is clear: Performance is generally unrelated to renomination in uncompetitive municipalities except for service delivery. In contrast, political competition plays a clear role – whether in terms of voter signals, service delivery or audit reports – in renomination for higher-status councillor positions, that is, as PR or district councillor. The coefficients displaying the interaction terms of political competition and the respective performance indicator are almost always large, positive and significant. For example, for voter signals, the coefficient for renomination in uncompetitive municipalities is mostly zero. In contrast, a 10 percentage point increase in vote share leads to a 12 per cent increase in renomination for better status councillor positions. Results for additional service delivery indicators (electricity and sanitation, displayed in Tables A.5 and A.6 in the online appendix) confirm these findings.
Unlike renomination for higher-status positions, competitiveness has no influence on the overall renomination shares of ward councillors where the effect is mostly 0 and always insignificant. For PR councillors, the picture looks slightly different with a large differential effect of voter signals in competitive municipalities, and generally positive and relatively large coefficients for the other performance indicators although with large standard errors.
In sum, it appears that nomination in the ANC follows quite different logics in competitive and uncompetitive municipalities. When the party faces more serious political competition, the performance of local governments plays a role in securing a nomination for a higher-status position whereas on the whole this is not the case when it is fully dominant in local governments. These results suggest that even if a party is overall dominant in elections, it can react to local electoral incentives. In competitive places, disgruntled voters have a bigger chance of having an impact on the party’s re-election into local government and the party thus selects political personnel that have better track records. In turn, fewer incentives for responsiveness to voter demands are present in uncompetitive places, and criteria other than performance appear to drive renomination. Interestingly, the effect of competitiveness is only present for renomination for higher-status councillor positions, and, to some extent, for overall renomination shares of PR councillors.Footnote 22
Discussion
These results raise a number of questions concerning the interpretation and the possible channels through which competitiveness operates.
The first question is whether competitiveness is really driving the results. The most important argument against the interpretation that it is political competition per se is that the effect is not present for renomination as ward councillor. In other words, if the concern is that the party might lose control over a municipality, should it not also renominate better-performing ward councillors? This is perhaps even more puzzling because ward councillors are elected through a first-past-the-post electoral system that would allow voters to vote a disliked councillor directly out of office. However, there are two factors that can explain why municipal-level competitiveness might not affect the renomination as ward councillors. The first concerns the different nomination procedures for these positions. As discussed above, the nomination of ward councillors is mainly an affair of the party’s local branches, which are aligned with the wards. In these nominations, local concerns and local assessments of ward councillor quality are likely to matter more than municipal-level considerations. This quality is probably not captured by municipal-level indicators of performance – that is, a ward councillor might have been doing a good job for the ward irrespective of the overall performance of the municipality’s government. In contrast, PR councillors are nominated by a municipal-level committee with additional interference from the higher-level party committees. It makes sense that this type of committee would have the party’s overall success in the municipality in mind, if necessary.
The second factor is that wards in competitive municipalities do not have to be more competitive than in uncompetitive municipalities. Indeed, in South Africa, the average margin of victory at the ward level is much higher than the average margin of victory at the municipal level in competitive municipalities (see Table A.7 in the online appendix). For wards, it is 34 percentage points, for the municipalities it is more than 20 percentage points lower. In short, wards within competitive municipalities do not face the same electoral incentives as the municipality as a whole.
The second question is whether the specific threshold (<25 percentage points margin of victory) affected the results. Tables A.8–A.10 in the online appendix therefore show the results with an alternative specification for the interaction term that measures the closeness of elections in a continuous variable (1 minus margin of victory). All main results hold with this alternative specification of competitiveness.Footnote 23
The third question is whether there is something about these competitive municipalities that contradicts the story that it is the performance of councillors that affects their renomination for better-status jobs. Two alternative interpretations are possible. One is that the ANC put better-quality politicians in competitive municipalities in the first place – that is, as candidates in 2006 local elections. Because they are better qualified and/or more motivated, these better-quality councillors do a better job during their term and are more likely to be renominated. This would not contradict the general argument that the ANC differentiates its strategy according to local electoral incentives, but the mechanism would not be via an ex post responsiveness to performance but as an a priori concern (as put forward by Galasso and Nannicini Reference Galasso and Nannicini2011). If it were the case that better-quality councillors were already installed in 2006, one should expect that councillors are generally more likely to be renominated in competitive municipalities than in uncompetitive ones. However, this is not the case for the ANC, as the renomination rate in 2011 is quite similar (46 per cent in competitive municipalities versus 48 per cent in uncompetitive municipalities).
A second alternative interpretation against the argument that it is indeed councillor performance that is related to renomination in competitive municipalities is that the ANC as a whole cares about competitive places and invests more in these municipalities through national or provincial spending. As a result, service delivery improves and voters might be happier with local governments, and possibly this could also affect renomination. Although this would again imply that the ANC has a special strategy for competitive municipalities, the mechanism would look to be a deliberate vote-buying strategy, made possible through national and provincial dominance. However, as shown in Table A.17 in the online appendix, the evolution in service delivery is unrelated to competitiveness.
In sum, it appears that the mechanism at play is in fact that councillor performance as measured by voter signals, service delivery and financial management plays a role for renomination in the ANC in municipalities where political competition is higher.
Concluding Remarks
This article studied accountability at the local level in South Africa’s dominant party system. It analysed whether performance and voter signals mattered in the renomination decision regarding municipal councillors. The findings showed that the ANC is mainly responsive to voters in municipalities that it won with smaller margins of victory. In this type of municipality, performance and voter signals were strongly and positively correlated with renomination for better councillor positions. In municipalities that the ANC had won with larger margins of victory, only improvements in service delivery appeared to matter for renomination, and the effects were comparatively small.
The findings of this article point to a need to expand dominant party research in additional directions. Firstly, the findings suggest a more general importance of looking at consequences of dominant party systems beyond the regime/democracy level. Among these consequences are crucial outcomes in terms of vertical accountability of dominant parties as well as – as Lindberg and Jones (Reference Lindberg and Jones2010) argue – the thus far little-studied consequences for economic development or corruption. Secondly, the findings highlight the significance of dominant party behaviour at the sub-national level. On the one hand, this is relevant if we are to understand the full impact of dominant party systems on citizen welfare. On the other hand, it is relevant because the behaviour of dominant parties at the sub-national level can generate insights on whether a specific party is still playing by the rules when faced by heightened electoral competition.
Supplementary Material
To view supplementary material for this article, please visit http://dx.doi.org/10.1017/gov.2016.1