Introduction
Tinnitus is usually defined as sound perception without the external acoustic stimulus. It affects about 12–15 per cent of adults and seriously impacts the life quality of 1–2 per cent of patients.Reference Schecklmann, Lehner, Poeppl, Kreuzer, Rupprecht and Rackl 1 – Reference Seidman, Standring and Dornhoffer 3
Although many hypotheses have been proposed regarding its aetiology, the mechanism of tinnitus has not yet been fully elucidated. Sound without an external stimulus is thought to arise from aberrant neural activity from any point along the auditory pathway, from the cochlear apparatus to the auditory cortex. Other theories on tinnitus include: damaged hairy cells with unregulated discharge and over-stimulated auditory nerves, hyperactive auditory synovial fibres, excessive stimulation of the auditory nerve, and lack of peripheral auditory nerve activity suppression in the auditory cortex.Reference Seidman, Standring and Dornhoffer 3
Noise exposure, ototoxic drug use, presbycusis, otosclerosis, otitis, cerumen, Ménière's disease and sensorineural hearing loss are the most common causes of tinnitus. The infectious causes of tinnitus include otitis, meningitis and other auditory inflammatory conditions. It has been reported that genetic factors may affect the formation of tinnitus. Tinnitus was first presumed to be due to hearing loss or cochlear damage. However, the relationship between tinnitus and hearing loss has not been fully elucidated. Not everyone with hearing loss develops tinnitus, and hearing loss does not occur in every patient with tinnitus.Reference Schecklmann, Lehner, Poeppl, Kreuzer, Rupprecht and Rackl 1 , Reference Seidman, Standring and Dornhoffer 3
This study aimed to evaluate patients with tinnitus in terms of mean platelet volume and platelet distribution width,Reference Chen, Xiao, Lin, Xiao, He and Bihl 4 – Reference Vagdatli, Gounari, Lazaridou, Katsibourlia, Tsikopoulou and Labrianou 6 and to explore neutrophil-to-lymphocyte ratio and platelet-to-lymphocyte ratio, recently reported in the literature as being possible inflammation markers.Reference Seo, Jeong, Choi and Moon 7 , Reference Ulu, Ulu, Bucak, Ahsen, Yucedag and Aycicek 8
Materials and methods
This prospective study comprised 64 consecutive tinnitus patients aged 18–65 years, and 64 age-matched healthy controls.
Routine ENT and audiological examinations, complete blood count and blood lipid profile measurements, and thyroid function tests, were performed to determine the aetiology. Temporal bone magnetic resonance imaging with gadolinium contrast medium was requested in those with unilateral tinnitus or asymmetric sensorineural hearing loss. Patients who had no pathology detected during these examinations were included in this study. Only complete blood count examination was requested in the control group.
Patients who had established aetiological reasons for the tinnitus, including objective tinnitus, chronic inflammatory disease, acute infection, acute or chronic kidney disease, chronic obstructive pulmonary disease, coronary artery disease, connective tissue disease, allergic rhinitis, liver disease, and otological diseases (such as otosclerosis, chronic otitis media and meningitis), were excluded from the study.
Haematological examination
Neutrophil-to-lymphocyte ratio was calculated as a simple ratio between the absolute neutrophil count and the absolute lymphocyte count in the complete blood count measurements. Platelet-to-lymphocyte ratio was calculated as a simple ratio between the absolute platelet count and the absolute lymphocyte count. Mean platelet volume and platelet distribution width were also obtained from the complete blood count measurements. Neutrophil-to-lymphocyte ratio, platelet-to-lymphocyte ratio, mean platelet volume and platelet distribution width were calculated in the control group in a similar manner. An automated blood cell counter (model XE-2100; Sysmex, Kobe, Japan) was used for the analyses.
Audiological examination
Audiometry tests of the patients were performed using an Orbiter 922 version 2 audiometry device (model EN60645-1; Madsen, Taastrup, Denmark) in the hospital audiology centre. Pure tone air-conduction thresholds were 0.25, 0.5, 1, 2, 4 and 8 kHz. Bone-conduction thresholds were 0.25, 0.5, 1, 2 and 4 kHz.
Ethics approval
The study was carried out with the approval of the Clinical Research Ethics Committee (number 26379996/13) at Ankara Yıldırım Beyazıt University.
Population size and power
The sample size and power calculations required for the study were determined using the software program G*Power, version 3.1.9.2.Reference Faul, Erdfelder, Lang and Buchner 9 The effect size was calculated as d = 0.55 to determine a 10 per cent change in platelet-to-lymphocyte ratio (the primary variable), with a 15 per cent standard deviation. It was estimated that 58 participants were required for the control and patient groups (116 subjects in total) in this study to achieve α = 0.05 type I error, β = 0.10 type II error and 90 per cent power. This study was conducted with 10 per cent more volunteers, with 64 participants in the control and patient groups (a total of 128 volunteers), to compensate for possible data loss.
Statistical analyses
The distribution of each variable in the study, including age, platelet-to-lymphocyte ratio, neutrophil-to-lymphocyte ratio, platelet counts, platelet distribution width, white blood cell (WBC) count and mean platelet volume, was graphically assessed using the Shapiro–Wilk test. Although mean platelet volume showed a normal distribution, other variables did not fit the normal distribution.
Descriptive statistics were presented as number and percentage for gender, and mean ± standard deviation for mean platelet volume (variables with normal distribution); median (and interquartile range) values were used for the other variables, which were not normally distributed.
The Mann–Whitney U test was used to examine differences in age, platelet-to-lymphocyte ratio, neutrophil-to-lymphocyte ratio, platelet count, platelet distribution width and WBC count between the patient group and the control group. The independent-samples t-test (student's t-test) was used to compare the mean platelet volume variables according to the groups. A chi-square test was performed to test the similarity of gender distribution between the groups.
For the statistical analyses and calculations, SPSS Statistics version 21.0 (IBM, New York, USA) and Microsoft Excel® 2007 software were used. Statistical significance level was accepted as p < 0.05.
Results
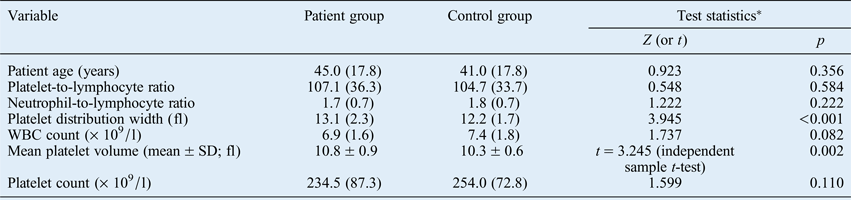
This study comprised 64 patients and 64 healthy volunteers. The median age was 41.0 years (interquartile range = 17.8) in the control group and 45.0 years (interquartile range = 17.8) in the patient group. No statistically significant difference in age was found between the patient group and the control group (Z = 0.923, p > 0.05) (Table I). In addition, no statistically significant difference was observed between the groups in terms of gender (χ2 = 0.791, p > 0.05). The female:male ratio was 26:38 (40.6 per cent females) in the control group, and 31:33 (48.4 per cent females) in the patient group.
Between-group comparison of descriptive statistics of variables

Data represent medians (and interquartile ranges), unless indicated otherwise. *Mann–Whitney U test statistics were conducted, with data representing Z values, unless indicated otherwise. WBC = white blood cell; SD = standard deviation
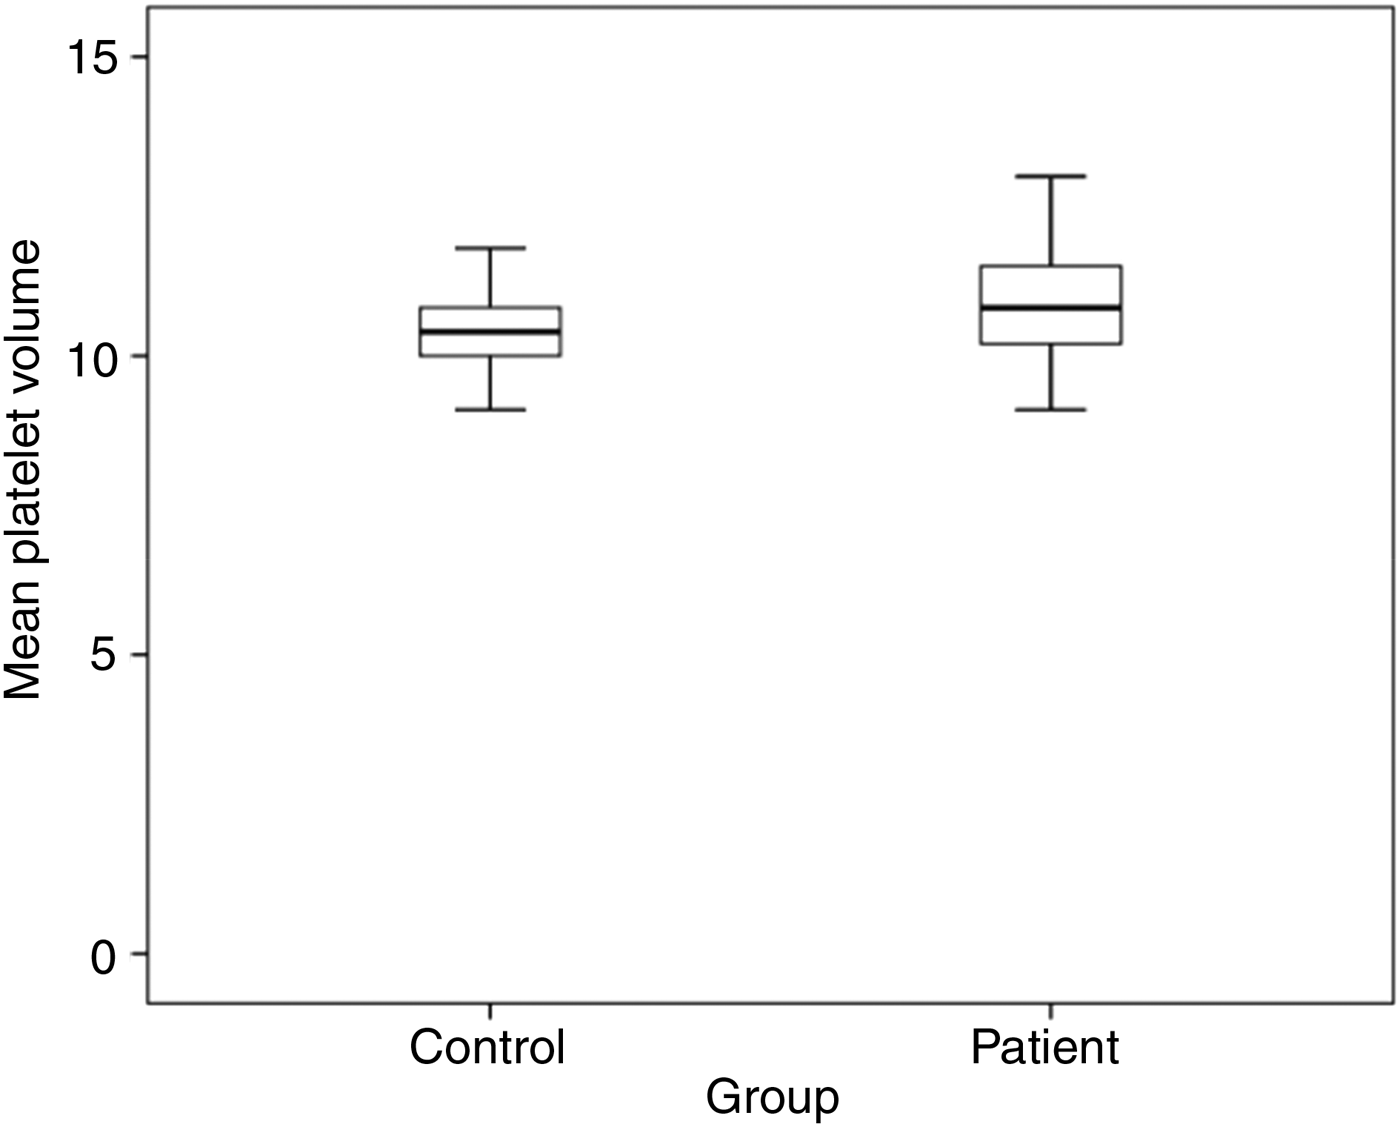
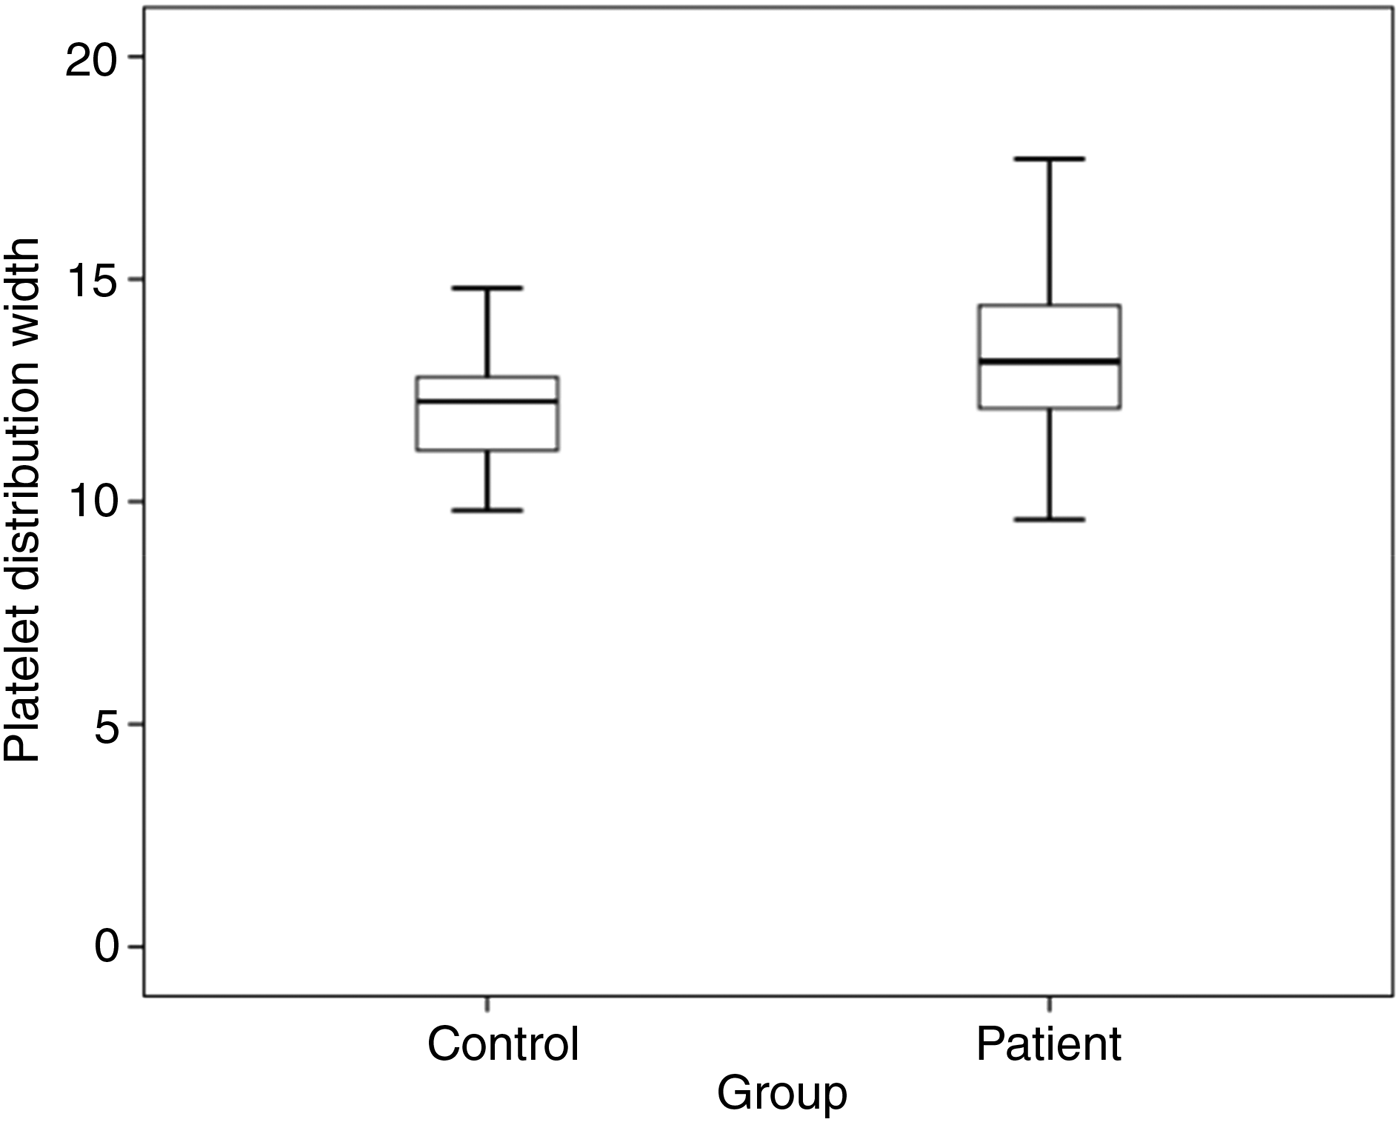
The mean platelet volume was 10.8 ± 0.9 fl in the patient group and 10.3 ± 0.6 fl in the control group (Figure 1). Mean platelet volume was significantly higher in the patient group than the control group (t = 3.245, p = 0.002). The median platelet distribution width was 13.1 fl (interquartile range = 2.3) in the patient group and 12.2 fl (interquartile range = 1.7) in the control group (Figure 2). Median platelet distribution width was significantly higher in the patient group than the control group (Z = 3.945, p < 0.001) (Table I).
Mean platelet volume in the control group and patient group.

Platelet distribution width in the control group and patient group.

The neutrophil-to-lymphocyte ratio was 1.7 (interquartile range = 0.7) in the patient group and 1.8 (interquartile range = 0.7) in the control group, with no significant difference between the groups (Z = 1.222, p > 0.05). The platelet-to-lymphocyte ratio was 107.1 (interquartile range = 36.3) in the patient group and 104.7 (interquartile range = 33.7) in the control group, with no significant difference between the groups (Z = 0.548, p > 0.05) (Table I).
Discussion
Although many theories have been proposed about the aetiology and pathophysiology of tinnitus, the mechanisms have not been fully elucidated.Reference Seidman, Standring and Dornhoffer 3 The most significant finding of this study was that mean platelet volume and platelet distribution width were higher in the patients with tinnitus.
Mean platelet volume and platelet distribution width are markers of platelet activation, with mean platelet volume being the most frequent marker used.Reference Chen, Xiao, Lin, Xiao, He and Bihl 4 – Reference Vagdatli, Gounari, Lazaridou, Katsibourlia, Tsikopoulou and Labrianou 6 Mean platelet volume indicates the size of platelets and platelet distribution width is used to assess variations in platelet size. An increase in these parameters suggests that bone marrow has released larger-volume platelets into blood circulation. Platelets with a large volume have been reported to be metabolically and enzymatically more active and more prone to aggregation compared with the small ones.Reference Martin, Trowbridge, Salmon and Plumb 5 , Reference Vagdatli, Gounari, Lazaridou, Katsibourlia, Tsikopoulou and Labrianou 6 , Reference Sevuk, Bahadir, Altindag, Baysal, Yaylak and Ay 10
It has been reported that the concurrent use of mean platelet volume and platelet distribution width is more meaningful for the evaluation of coagulation tendency.Reference Vagdatli, Gounari, Lazaridou, Katsibourlia, Tsikopoulou and Labrianou 6 , Reference Sevuk, Bahadir, Altindag, Baysal, Yaylak and Ay 10
Yilmaz et al. reported that myocardial infarction and ischaemic complications were more frequent in acute coronary syndrome patients with elevated mean platelet volume levels and without ST-segment elevation.Reference Yilmaz, Cihan, Guray, Guray, Kisacik and Sasmaz 11 Another study reported that platelet microparticles and mean platelet volume levels were higher in acute ischaemic stroke patients than in healthy subjects.Reference Chen, Xiao, Lin, Xiao, He and Bihl 4 In another study, mean platelet volume and platelet distribution width were high in patients with cerebral venous sinus thrombosis.Reference Kamisli, Kamisli, Kablan, Gonullu and Ozcan 12 It has been suggested that auditory system perfusion may be impaired in tinnitus patients.Reference Sarıkaya, Bayraktar, Karatas, Dogan, Olt and Kaskalan 13 , Reference Kemal, Muderris, Basar, Kutlar and Gul 14 Sarıkaya et al. reported that mean platelet volume was significantly increased in patients with tinnitus.Reference Sarıkaya, Bayraktar, Karatas, Dogan, Olt and Kaskalan 13
Tinnitus characteristics, including duration, frequency, episode length, intermittency and noise description, have been evaluated using mean platelet volume. However, no relationship has been reported between mean platelet volume and tinnitus characteristics such as duration, frequency, episode length and sound identification.Reference Sarıkaya, Bayraktar, Karatas, Dogan, Olt and Kaskalan 13
In a retrospective study by Kemal et al., mean platelet volume was higher in patients with tinnitus.Reference Kemal, Muderris, Basar, Kutlar and Gul 14 Both mean platelet volume and platelet distribution width were higher in the tinnitus patients in the present study, in line with the literature. These results suggest that a prothrombotic condition might exist in patients with tinnitus. Previous studies have also reported that mean platelet volume is lower in patients with tinnitus,Reference Yuksel and Karatas 15 with no significant difference compared with healthy subjects.Reference Bayram, Yaşar, Doğan, Güneri and Özcan 16
-
• The aetiology of tinnitus has not yet been fully elucidated
-
• This prospective study evaluated tinnitus patients in terms of mean platelet volume and platelet distribution width
-
• Mean platelet volume and platelet distribution width were significantly increased in tinnitus patients
-
• Mean platelet volume and platelet distribution width are markers of platelet activation
-
• Large volume platelets are metabolically and enzymatically more active and more prone to aggregation than small ones
-
• Prothrombotic condition might play a role in the pathophysiology of tinnitus
Neutrophil-to-lymphocyte ratio and platelet-to-lymphocyte ratio have been used frequently as indicators of inflammation in recent publications.Reference Seo, Jeong, Choi and Moon 7 , Reference Ulu, Ulu, Bucak, Ahsen, Yucedag and Aycicek 8 Özbay et al. reported that neutrophil-to-lymphocyte ratio was higher in patients with severe tinnitus compared with healthy subjects, but they reported no significant difference in mean platelet volume.Reference Özbay, Kahraman, Balikci, Kucur, Kahraman and Ozkaya 17 However, Bayram et al. reported no significant increase in neutrophil-to-lymphocyte ratio and platelet-to-lymphocyte ratio in patients with tinnitus.Reference Bayram, Yaşar, Doğan, Güneri and Özcan 16 In the present study, no significant differences were found between patients with tinnitus and healthy participants in terms of neutrophil-to-lymphocyte ratio and platelet-to-lymphocyte ratio.
Conclusion
The results of this study suggest that a prothrombotic condition might play a role in the pathophysiology of tinnitus. However, further studies are required to confirm these results.